Abstract
This article provides not only a description of an electroencephalogram (EEG), the principle of its operation, conditions of use, methods of decoding but also studies aimed at improving this procedure and facilitating the work of highly professional employees studying EEG results. A study of published articles related to electroencephalograms was carried out in order to trace the entire path of development and use of EEGs.
Today, the word “electroencephalogram” is not something unknown. Many people, whether for medical or research purposes, have come across it. An electroencephalogram (EEG) is a physiological assessment method that is used to study the functioning of the nervous system by recording the electrical activity of the brain, especially the cerebral cortex. Thus, with the help of an EEG, it is possible to detect the normal pattern of our brain functioning and the activation of the brain or its individual parts when faced with external or internal stimulation. Measurements can be taken while awake or asleep, depending on the purpose of the test. Through the electrodes, the measuring system captures the radiation of brain waves and their rhythm, shape, duration, and frequency of radiation.
The captured waves can be alpha, beta, theta, and delta. Each of them will cause the EEG to draw one or another pattern of wave frequencies.
- Alpha waves appear in moments of relaxation or before tasks that do not require concentration or effort.
- Beta waves usually reflect the results of intense mental effort, usually occurring while awake or during REM sleep.
- Theta waves are a type of brainwaves that are commonly observed during periods of relaxation, drowsiness, and deep meditation, and they play a significant role in memory consolidation and creative thinking.
Finally, delta waves are associated with deep sleep, as they have traditionally been associated with rest and the repair of nerve tissue.
With an encephalogram, you can measure both the general pattern of brain functioning and the differences between some areas and others by analyzing the differences in voltage between different areas. With regard to its use in medicine, it can be used to determine the normal functioning of the brain, the control of the state of consciousness during surgery, or the presence of changes in the nature of the radiation of waves. In this aspect, this type of technique tends to be used for suspected disorders such as epilepsy (seizures are provoked voluntarily to fix what is happening and how), dementia, encephalopathies, typical outbreaks of some mental disorders, and even differentiation between coma and brain death (while the former has brain activity, the latter will show a flat electroencephalogram). It is also widely used to analyze sleep problems and disorders. Throughout the history of the existence of the electroencephalogram, various studies have been carried out not only to detect diseases but also to improve the technology itself. Let us take a look at some research examples.
A group of scientists, which included: Bob Kemp, Aeilko H. Zwinderman, Bert Tuk, Hilbert A C Kamphuisen, and Josefien J L Oberye, published an article in IEEE Transactions on Biomedical Engineering in October 2000 entitled “Analysis of a sleep-dependent neuronal feedback loop: The slow-wave microcontinuity of the EEG”. In this article, the authors talked about the experiment they conducted, the conditions for its conduct, the participants, the equipment, and the results obtained. As a result of the study, they obtained an estimate of the feedback gain and applied it to quantify the depth of sleep [1].
In addition, in their article, the authors referred to the article by Allan Rechtschaffen and Antony Kales “A Manual of Standardized Terminology, Techniques and Scoring System for Sleep Stages of Human Subjects”, published in 1968 in the journal Psychiatry and Clinical Neurosciences. This guide to standard terminology and scoring reflects the consensus of a group of researchers, each with years of experience in evaluating polygraph sleep recordings. The development of this guide required extensive discussion of all emerging issues. This guide should be seen as a working tool and not a teaching aid, based on which the study was carried out. It involved 22 people (both men and women) of different ages; each of them took temazepam (benzodiazepine—psychoactive substances that are part of a wide group of central nervous system depressants) once, and they were observed for two nights. It was found that in men, the power of slow waves is two times lower than in women. However, no influence of gender on slow-wavelength microcontinuity was found. All this leads to the conclusion that slow-wave microcontinuity based on the physiological model of sleep reflects the depth of sleep more accurately than the power of slow waves [2].
A new paper came out in 2020 related to the two previous research topics. It was published by Mostafa Neo Mohsenvand, Mohammad Rasool Izadi, and Pattie Maes in Proceedings of Machine Learning Research. The article is called “Contrastive Representation Learning for Electroencephalogram Classification”. Here, the authors present a model for learning the representation of electroencephalogram signals using contrast learning. Reflecting on the complex task of EEG interpretation and labeling facing an experienced specialist, the authors increase the number of samples per record by recombining the channels of the records. Thus, the amount of labeled data required for tasks such as emotion recognition, anomaly classification, and sleep stage assessment is significantly reduced. Moreover, the model showed improved performance compared to supervised and self-observed models [3].
In 1937, “Cerebral states during sleep, as studied by human brain potentials” was published in The Journal of Experimental Psychology by Alfred L Loomis, E Newton Harvey, and Garret A Hobart. To study potential sleep patterns, a new type of push–pull amplification system was used, specifically designed to accurately record large slow potentials. It has been discovered that during sleep, there is a continuous fluctuation of states in a person, which can be associated with stimulus recognition or occur without external influences. During sleep there was a constant shifting of states up and down, sometimes associated with recognizable stimuli, sometimes without any external stimuli, but probably as a result of internal stimuli [4].
Based on the results (Figure 1) of the above article, Hubert Banville, Omar Chehab, Aapo Hyvarinen, Denis-Alexander Engemann, and Alexandre Gramfort published a study in 2020 entitled “Uncovering the structure of clinical EEG signals with self-supervised learning”, which aimed to investigate self-supervised learning. It is a method for detecting structure in unlabeled data to study the presentation of EEG signals. The authors worked with two of the most significant problems—determining the stage of sleep based on electroencephalograms and detecting pathologies. The experiment was conducted with several public datasets containing thousands of records. As a result, the authors concluded that this algorithm may be the beginning of a wider use of deep learning models on EEG data [5].
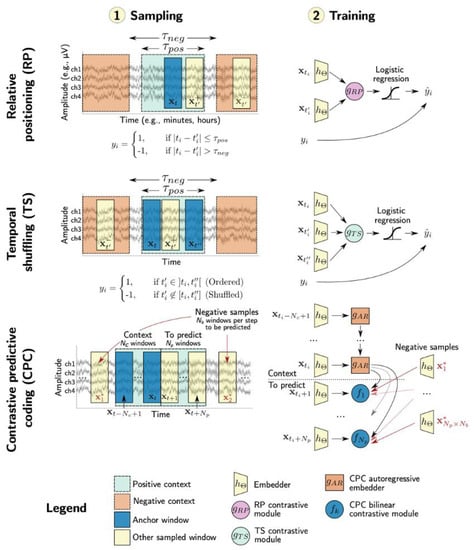
Figure 1.
Visual explanation of the three tasks used in this study. The first column illustrates the sampling process by which examples are obtained in each of the tasks. The second column describes the learning process in which sample examples are used to train the hΘ extractor end-to-end.
In 2017, Albert Vilamala, Kristoffer H Madsen, and Lars K Hansen published an article entitled “Deep convolutional neural networks for interpretable analysis of EEG sleep stage scoring”, in which they drew attention to the importance of sleep studies for diagnosing sleep disorders such as insomnia, narcolepsy, and sleep apnea. Despite advances in medicine, sleep assessment from raw polysomnography signals remains a tedious visual task for highly trained professionals, and various attempts have been made recently to conduct a number of studies to create an automatic assessment based on machine learning methods. The authors turn to multi-cone spectral analysis to generate visually interpretable images of sleep patterns from EEG signals as input to a deep convolutional network trained to solve visual recognition problems. In this article, emphasis was placed not only on the medical component but also on the mathematical one [6]. Thus, the authors refer to L. Fejér’s article “Über trigonometrische Polynome”, published in The Journal für die reine und angewandte Mathematik (Crelles Journal) in 1916, which describes the supertrigonometric polynomial [7]. Additionally mentioned is the article by G. Szego “Beiträge zur Theorie der Toeplitzschen Formen”, which was published in Mathematische Zeitschrift back in 1920. It was in this article that the Hellinger–Toeplitz theorem applied to the Hilbert space was described [8]. Another article they linked to was D.J. Thomson’s “Spectrum estimation and harmonic analysis”, published in Proceedings of the IEEE in 1982. This article presented a method based on a “local” eigendecomposition for estimating the spectrum in terms of solving an integral equation [9].
In the book “Automatic Diagnostics and Processing of EEG”, written by A. Khramov, A. Koronovskii, V. Makarov, A. Pavlov, and E. Sitnikova, one of the modern methods of time series analysis is considered—continuous wavelet analysis. In short, it outlines the general information and concepts of wavelet transform, the mathematical apparatus, the method for the numerical implementation of wavelet transform, the wavelet analysis of random processes, and the methods for applying wavelet transform to the analysis of nonlinear systems of various nature. In addition, aspects related to the study of spatially distributed systems, and, accordingly, structures that arise both in time and space, using wavelet analysis, are touched upon. In the world literature, a large number of different methods for recognizing peak–wave discharges are mentioned. The authors of this book propose to divide them all into three classes:
- The first one uses a non-linear dynamics approach and quantifies various characteristics of EEG signals, such as Lyapunov exponents or entropy;
- The second one uses artificial neural networks and learning algorithms for data classification;
- The third formalizes the definition of SWD (peak–wave discharges) and compares the statistical features of different typical epochs in the EEG.
In addition, the authors note a number of shortcomings of the above methods, namely:
- They are not applicable for real-time signal processing. For example, methods based on the calculation of Lyapunov exponents or entropy.
- Low accuracy. For example, methods for estimating the statistical properties of different epochs.
- Unstable operation, requiring individual adjustment of EEG parameters. For example, methods based on artificial neural networks.
Consider wavelet transform. Its use is a natural way to detect an increase in power in the gamma range. The main essence of the method is to estimate the instantaneous energy of the wavelet spectrum in the gamma band and compare it with the threshold: if the energy exceeds a certain critical value—the threshold—then the expert system concludes that SWD is present.
Figure 2 shows a typical energy distribution of the E(f) wavelet spectrum for SWD, sleep spindle, and background EEG. The main part of the SWD fluctuations is about 8 Hz, which corresponds to the strongest peak of the wavelet spectrum. However, at low frequencies (f < 15 Hz) this peak overlaps with the spindle wave spectral peak, which can confuse SWD with spindle events. However, the SWD epochs have more power at higher frequencies f > 15–20 Hz, i.e., in the gamma frequency range, due to the presence of the second and third harmonics of the fundamental SWD frequency (the harmonics are marked with arrows in Figure 2). Thus, each individual peak, except for the peak–wave complex, is displayed in the wavelet spectrum as a local burst of wavelet power [10].
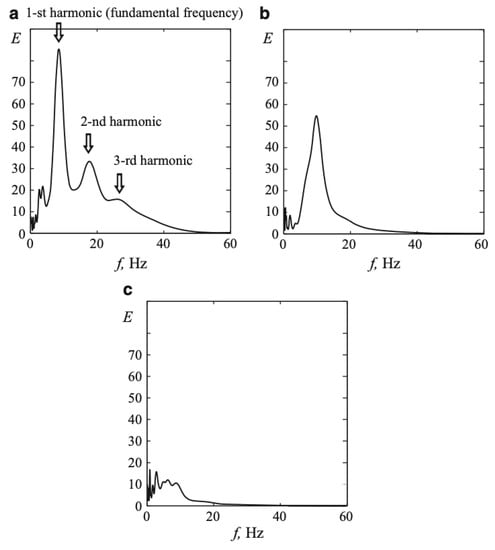
Figure 2.
Typical frequency distributions of the wavelet spectrum energy E(f) characterizing various oscillatory patterns in the EEG of WAG/Rij rats. (a) Spike wave discharge. Arrows mark the fundamental frequency of SWD oscillations and its harmonics. (b) Sleep spindles. (c) Baseline EEG. The wavelet spectra were calculated using the Morlet wavelet.
The article “Review on Mathematical Modelling of Electroencephalography (EEG)” discusses the mathematical aspects of EEG modeling. When modeling an electroencephalogram, the greatest interest is not only the human head but also the various tissues inside it. As a rule, two types of head models can be found in the literature—a classical spherical model and a more realistic one. The second type of model allows you to more accurately describe the geometry of the structure of the head since it can be obtained by combining magnetic resonance imaging (MRI) and computed tomography (CT) [11].
The article “A review of parametric modelling techniques for EEG analysis” discusses autoregressive modeling. Thus, the AR modeling technique can be defined in the private domain as a spectral matching problem or in the time domain as a linear prediction problem. The authors of the article choose the latter approach since an important advantage of the model based on linear prediction is the relative simplicity of parameter estimation using linear signal processing procedures [12].
This article describes various methods for more accurate EEG removal. In addition to describing algorithms that help in solving the above problem, the authors talk about platforms for analyzing biosignals, one of which is EEG. Let us look at some of them. BioSig is an open-source software library for processing biomedical signals, including, for example, the analysis of biosignals such as an electroencephalogram (EEG), electrocorticogram (ECoG), electrocardiogram (ECG), electroculogram (EOG), electromyogram (EMG), respiration, and so on. Another platform, MATLAB—with powerful filters for importing and exporting data, algorithms for extracting functions, classification methods and powerful software for viewing and evaluating—allows you to work with EEG data [13].
There are many approaches for EEG processing; we have looked at many of them and for the engineering approach within the framework of medical cybernetics, we plan to develop a simple software for EEG processing that does not require special knowledge in IT from a doctor.
Summing up, I would like to draw attention to the fact that in this article, the articles that were analyzed covered a period of a little more than a hundred years. Each of the above articles is a reflection of the development of science of its time. Thus, we not only followed the first publications on EEGs but also saw the development and application of electroencephalograms, ways to decipher them, and the possibility of automatically reading their results, which will contribute to more accurate diagnoses in the future and avoid medical errors (since the risk of human error will be minimal). All this in general will help relieve medical personnel from unnecessary work on deciphering EEG results and direct all efforts to treating patients.
Author Contributions
Conceptualization, D.A.; methodology, D.A.; validation, D.A.; investigation, V.T.; writing—original draft preparation, V.T.; writing—review and editing, D.A.; visualization, V.T. All authors have read and agreed to the published version of the manuscript.
Funding
This research received no external funding.
Institutional Review Board Statement
The data was taken from open sources such as ResearchGate.
Informed Consent Statement
Not applicable.
Data Availability Statement
Not applicable.
Conflicts of Interest
The authors declare no conflict of interest.
References
- Kemp, B.; Zwinderman, A.H.; Tuk, B.; Kamphuisen, H.A.C.; Oberye, J.J.L. Analysis of a sleep-dependent neuronal feedback loop: The slow-wave microcontinuity of the eeg. IEEE Trans. Biomed. Eng. 2000, 47, 1185–1194. [Google Scholar] [CrossRef] [PubMed]
- Rechtschaffen, A.Q.; Kales, A.A. A Manual of Standardized Terminology Techniques and Scoring System for Sleep Stages of Human Subjects; U.S. National Institute of Neurological Diseases and Blindness, Neurological Information Network: Bethesda, MD, USA, 1968. [Google Scholar]
- Mohsenvand, M.N.; Izadi, M.R.; Maes, P. Constrastive Representation Learning for Elecroencephalogram Classification. Proc. Mach. Learn. Res. 2020, 136, 238–253. [Google Scholar]
- Loomis, A.L.; Harvey, E.N.; Hobart, G.A. Cerebral states during sleep, as studied by human brain potentials. Eur. J. Exp. Psychol. 1937, 21, 127. [Google Scholar] [CrossRef]
- Banville, H.; Chehab, O.; Hyvarinen, A.; Engemann, D.-A.; Gramfort, A. Uncovering the structure of clinical eeg signals with self-supervised learning. arXiv 2020, arXiv:2007.16104. [Google Scholar] [CrossRef] [PubMed]
- Vilamala, A.; Madsen, K.H.; Hansen, L.K. Deep convolutional neural networks for interpretable analysis of eeg sleep stage scoring. In Proceedings of the IEEE International Workshop on Machine Learning for Signal Processing, Tokyo, Japan, 25–28 September 2017. [Google Scholar]
- Fejer, L. Uber trigonometrische Polynome. J. Reine Angew. Math. 1916. [Google Scholar] [CrossRef]
- Szego, O. Beitrage zur Theorie der Toeplitzschen Formen. Math. Z. 1920, 6, 167–202. [Google Scholar] [CrossRef]
- Thomson, D.J. Spectrum Estimation and Harmonic Analysis. Proc. IEEE 1982, 70, 1055–1096. [Google Scholar] [CrossRef]
- Hramov, A.E.; Koronovskii, A.A.; Makarov, V.A.; Pavlov, A.N.; Sitnikova, E. Automatic Diagnostics and Processing of EEG. SSSYN 2015. [Google Scholar] [CrossRef]
- Darbas, M.; Lohrengel, S. Review on Mathematical Modelling of Electroencephalography (EEG). Jahresber. Dtsch. Math.-Ver. 2018, 121, 3–39. [Google Scholar] [CrossRef]
- Pardey, J.; Roberts, S.; Tarassenko, L. A review of parametric modelling techniques for EEG analysis. Med. Eng. Phys. 1996, 18, 2–11. [Google Scholar] [CrossRef] [PubMed]
- Balam, V.P.; Plawiak, P.; Prakash, A.J. A Brief Review on EEG Signal Pre-processing Techniques for Real-Time Brain-Computer Interface Applications. TechRxiv 2021. [Google Scholar] [CrossRef]


Disclaimer/Publisher’s Note: The statements, opinions and data contained in all publications are solely those of the individual author(s) and contributor(s) and not of MDPI and/or the editor(s). MDPI and/or the editor(s) disclaim responsibility for any injury to people or property resulting from any ideas, methods, instructions or products referred to in the content. |
© 2023 by the authors. Licensee MDPI, Basel, Switzerland. This article is an open access article distributed under the terms and conditions of the Creative Commons Attribution (CC BY) license (https://creativecommons.org/licenses/by/4.0/).