1. Introduction
Most radio signal analysis systems rely on hardware and operate within specific frequency ranges, making modifications costly and inefficient. The pandemic has increased the demand for virtual labs, especially in educational institutions, particularly with engineering majors such as the Electronics and Telecommunications program of the Escuela Politécnica Nacional, where the lack of virtual labs for analog and digital communications has hindered students’ academic progress [
1]. SDR technology is ideal for space applications because space communications increasingly require more flexible, adaptable, and reconfigurable radios. This has led to software-defined radios beginning to be used in some missions. For example, NASA’s Curiosity rover uses a software-defined radio to establish communications in the UHF band with the Mars Reconnaissance Orbiter (MRO). The incorporation of SDR technology in the Curiosity–MRO link has managed to increase the data transmission rate between the two systems from 256 kbps to 2048 kbps by implementing algorithms for adapting the data rate depending on the conditions of the communication channel [
2].
This work aims to develop a system for spectrum analysis using software-defined radio (SDR) technology to observe the behavior of systems such as Digital Terrestrial Television (DTT), which, in Ecuador, is in the process of implementation, with the purpose of analyzing different points and detecting possible problems. The system developed with SDR is low cost and constitutes an excellent teaching tool for learning this new technology [
3]. The SDR-based spectrum analyzer will enable the analysis of signals within the 470–698 MHz frequency range, like a physical spectrum analyzer, without the need for in-person communication labs. The goal is to facilitate the study of the transmission and reception parameters of authorized TV channels in Quito, complying with the regulation of the Agency for the Regulation and Control of Telecommunications of Ecuador (ARCOTEL) and improving the capacities of education and research in telecommunications [
4].
2. Objectives and Contribution
In this work, the following objectives are established:
Implement a spectrum analyzer in the 470–698 MHz band using an SDR system for the analysis of terrestrial digital television signal parameters in sectors of the city of Quito. The specific objectives are the following:
Study the basic concepts and operation of an SDR system. Design the spectral analysis of the 470–698 MHz frequency band using an SDR system.
Implement a system to visualize radio spectrum parameters for receiving terrestrial digital television (TDT) signals.
Perform measurements at different strategic points in the city of Quito to verify the functionality of the implemented spectrum analyzer.
The significant contribution is supported by the inclusion of the application of the ISDB-Tb standard for the real-time processing of television channel signals, the setup and operation of an SDR system using GNU Radio, and compliance with ARCOTEL regulations for signal modeling and processing [
5]. Furthermore, the establishment of a valuable, cost-effective, and efficient virtual communication laboratory enables the in-depth analysis of transmission and reception parameters for authorized channels in Quito, supporting research and academic training in this critical field.
3. Other Investigations
While it is true that the research area in terms of systems and applications with SDR has grown and evolved, there are works in this area.
One work involves developing an algorithm to analyze and display data collected from the NOAA satellite. The interface is designed and programmed in NI LabVIEW, where satellite signals are taken from the antenna using a USRP N2920 device, which allows for signal conversion and transport to the interface [
6], or the reception of DTT signals using an SDR device through Matlab to finally visualize the received multiplex audiovisual programs [
7]. There is even a work on the creation of a prototype spectrum analyzer using software-defined radio techniques, a single-board computer, and an RTL-SDR blog V3 tuner device for the reception of electromagnetic signals [
8].
It is worth noting that these are important applications, but in the current research, efforts have been made to keep implementation costs low by using an SDR-RTL device, which has basic electronic components, rather than a USRP, which can cost up to 20 times more and may have an onboard programmable FPGA card. The goal is to minimize hardware usage so that everything can be completed through software and to use a free programming platform. This involves applying the knowledge of signal reception and processing, and although it is primarily used for DTT due to its current popularity, it is also applicable for receiving any type of RF signal.
4. Project Development
4.1. Methodology
This article focused on reviewing concepts related to terrestrial digital transmission signals, as well as the standard used in Ecuador and the functioning of One-seg. Subsequently, a problem that could be addressed using software-defined radio (SDR) 2832U and signal analysis equipment currently accessible for enhancing learning and research was investigated. The article proposes a prototype that aids in signal analysis, enabling the visualization of the signal spectrum and conducting measurements to achieve these objectives. The necessary steps for project development were established, and its implementation was carried out.
4.2. Project Overview
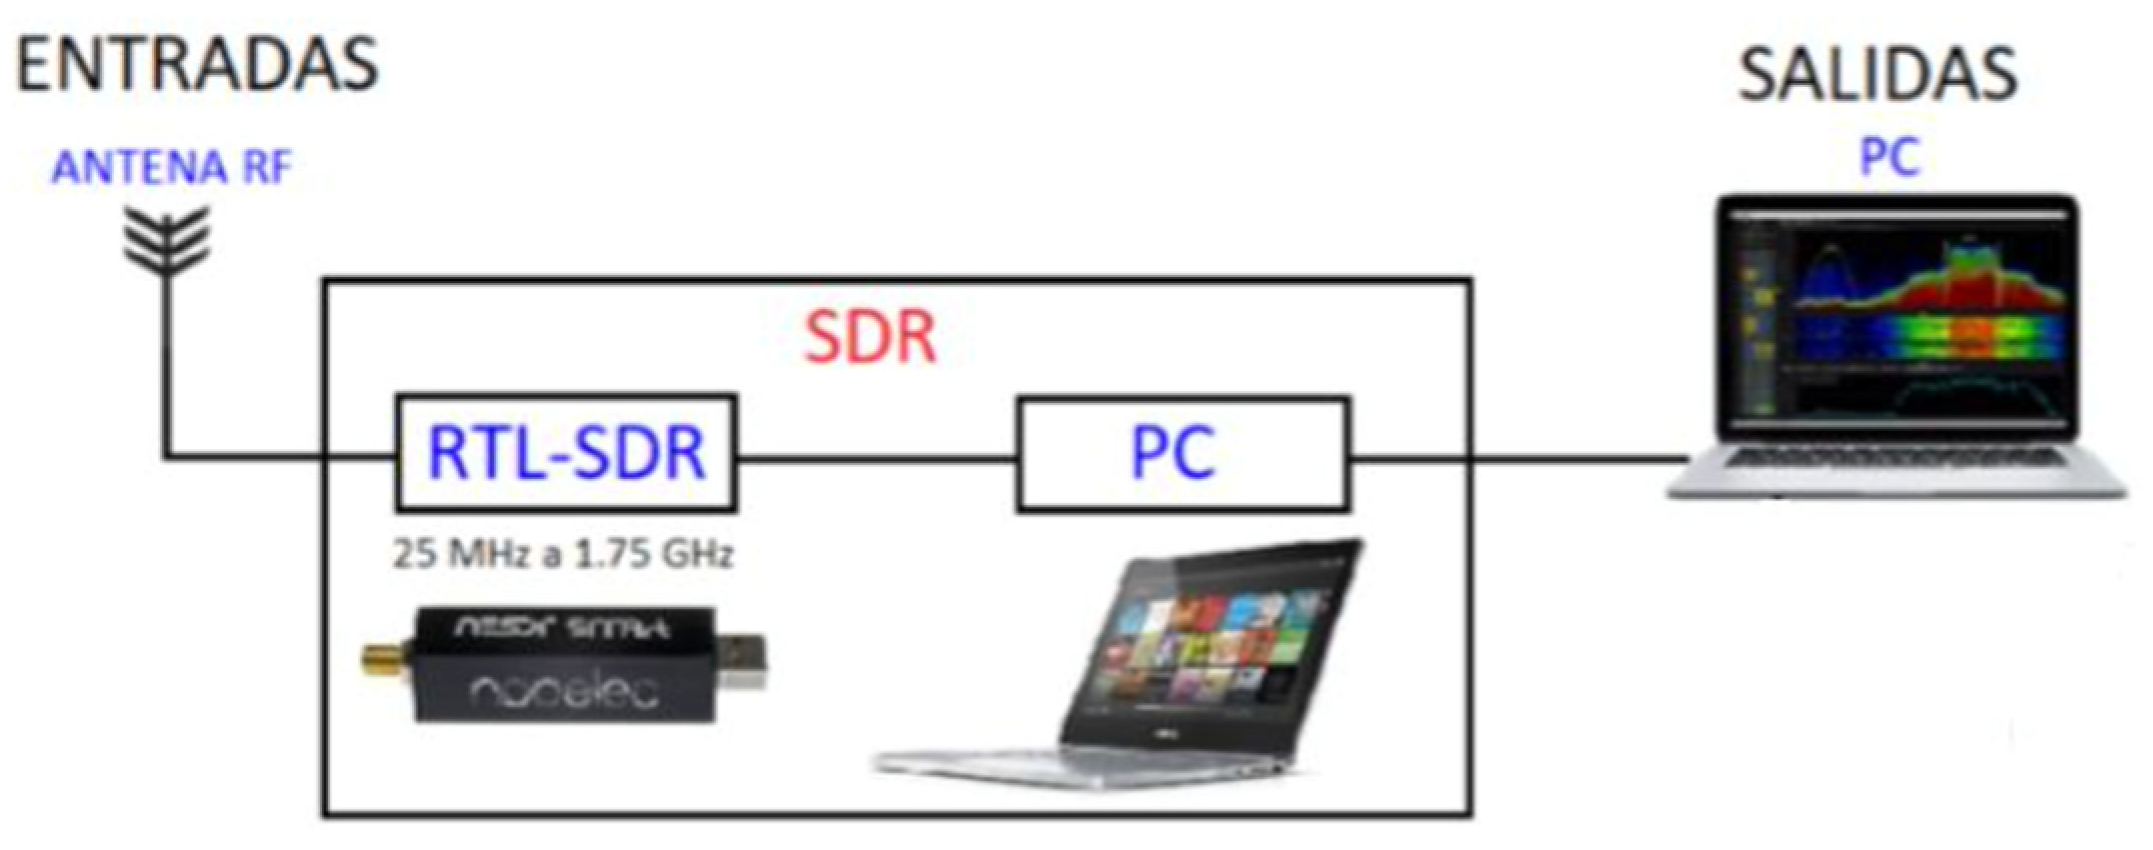
The block diagram in
Figure 1 outlines the necessary steps to implement and program a prototype that fulfills the established objectives. The prototype has the following functions.
4.3. Implementation of an ISDBT-TB Receiver/Decoder in GNU Radio for Terrestrial Digital Television Transmission Analysis Using NESDR SMART
After analyzing some options and due to the nature of the free software under which the GNU Radio software was released, the adaptability, direct compatibility with NESDR or any RTL2832U based device, and the feasibility of modifying its modules for the generation of specific solutions were considered. The GNU Radio and NESDR link were the options with the best expectations and is compatible with both Windows-based operating systems as well as Linux. However, due to the closed-source nature of Windows, the direct modification of modules and dependencies that the solution may require becomes challenging. Given this circumstance, the version for GNU-Linux was selected over an intuitive and user-friendly operating system like UBUNTU 18. This decision was made because, starting from version 20, there are changes in the operating system kernel, including Python. Taking as a reference the implementation by the IIE (Institute of Electrical Engineering), Faculty of Engineering, University of the Republic, Montevideo, Uruguay [
9], it was necessary to create a development environment compatible with ISDB-Tb with the aim of achieving a software-level tool to reach the objective. Consequently, GNU Radio version 3.7 and the necessary dependencies were compiled to achieve the desired compatibility [
9].
The implementation process, shown in
Figure 2, involves the acquisition and processing of radiofrequency (RF) signals for the reception and decoding of terrestrial digital television (TDT) transmissions in the 1-seg standard. Several GNU Radio blocks are used to carry out the different stages of the process.
Blocks That Make up the Receiver.
RTL-SDR SOURCE: This allows for the reception of radiofrequency signals using an SDR device based on the RTL2832U chip. Parameters such as tuning frequency and sampling rate are configured. It provides a complex sample stream output for further processing.
Rational Resampler: This performs the resampling of the obtained RF signal to obtain segments of the primary signal without overloading the reception system. It uses a polyphase interpolation and decimation algorithm to change the signal’s sampling rate.
Low Pass Filter: This filters the sampled signal to eliminate unwanted frequencies and improve signal quality. It enables the implementation of digital low-pass filters, and parameters such as cutoff frequency and gain are configured.
Sync Dem OFDM 1seg: This performs the synchronization of the OFDM symbols from the captured signal. It extracts the OFDM symbols, synchronizes the frequency and timing of the input signal, and decodes the transmitted data.
OFDM Demod 1seg: This decodes the OFDM data transmitted in the received signal. It uses signal processing techniques for time and frequency synchronization, channel error removal, and data recovery.
TMCC Decoder 1seg: This decodes the Transmission and Multiplexing Configuration Channel (TMCC) in the 1-seg TDT standard. It allows for the extraction and decoding of TMCC information for transmission management and control.
Frequency Deinterleaver: This corrects the effects of dispersion in the received signal. It rearranges the received data into a sequence that minimizes decoding errors using the Fourier transform.
Time Deinterleaver: This corrects the effects of selective fading in the received signal. It rearranges the received data into a sequence that minimizes decoding errors in the time domain.
MER One-seg: This calculates the Modulation Error Ratio (MER) of the digital television signal in the 1-seg standard. It provides a metric to evaluate the signal quality.
Decoder 1seg: This decodes and recovers the audio and video signal from the transmission channel. It performs the reverse process of signal compression, corrects errors, and synchronizes the signal for data playback.
Vector to Stream: This converts an input signal in vector format to an output signal in stream format. It allows for the real-time transmission and processing of vector signals.
File Sink: This writes signal data to a file on the hard drive. It enables the storing data for further processing or analysis.
QT GUI Frequency Sink, QT GUI Number Sink, QT GUI Time Sink, and QT GUI Constellation Sink: These output blocks for the real-time visualization of the signal in different domains, such as frequency spectrum, numerical values, time domain, and constellation diagram.
These blocks are used in a processing chain that spans from the acquisition of the RF signal to the decoding and playback of the audio and video signal. Graphical tools such as QT GUI Chooser, Entry, or Range are used to allow the user to adjust settings in real-time.
The gray-colored blocks are currently disabled with minor modifications for signal power measurements. Meanwhile, the purple-colored blocks are enabled and operational. You can toggle these blocks on and off using the E (Enable) and D (Disable) keys as needed.
5. Results
Initial tests were conducted to assess the quality of digital television signals on different channels. The obtained results indicate the feasibility of recovering audio and video from signals of good and medium quality. However, channels with poor-quality signals were found where it was not possible to recover the audio and video signal.
5.1. ISDB-TB Spectrum, Channel with Good-Quality Signal
Through the implemented spectrum analyzer, the signal transmitted by the national television channel Teleamazonas was collected. The power intensity was measured using the spectrogram available in the GNU Radio library, and a measurement of −55.16 dB was observed at a frequency of 580.897 MHz, which falls within the regulatory ranges, indicating a signal of good quality suitable for recovering and analyzing its audio and video content. The amplitude vs. time peaks in the OFDM synchronization diagram showed clear definition, suggesting good audio and video quality.
The measurements taken, including the MER (Modulation Error Ratio) of 24.61 dB and the SNR (Signal-to-Noise Ratio) of 20.62 dB, indicate low dispersion and a high-quality signal (
Figure 3), even after error correction, which is highly favorable.
5.2. ISDB-TB Spectrum Channel with Medium Quality Signal
A measurement of −74.49 dB was observed at a frequency of 670.985 MHz, within the regulatory ranges, indicating an acceptable but medium-quality signal (
Figure 4). The bandwidth used falls within the One-seg parameters. The constellation diagram showed an asymmetrical and scattered constellation pattern, indicating a reception of signal, but of low quality. Despite this, acceptable results were achieved, enabling synchronization. The OFDM synchronization displayed well-defined peaks in the amplitude vs. time diagram, indicating good audio and video quality.
In the measurement diagram, the obtained MER was 4.6 dB, signifying significant dispersion and a low-quality signal. The measured SNR was 4.97 dB, confirming the low image quality. Even after error correction, these measurements still showed low values, indicating poor signal quality.
5.3. ISDB-TB Spectrum, Channel with Bad Quality Signal
A measurement of −81.29 dB was observed at a frequency of 580.905 MHz, which is outside the regulatory ranges. No signal was obtained for recovery (
Figure 5), indicating that audio and video cannot be retrieved. The constellation diagram showed a non-symmetric and scattered constellation pattern, indicating a lack of signal reception. The results for this TV channel are unacceptable, meaning that audio and video cannot be obtained. The OFDM synchronization displayed poorly defined peaks in the amplitude vs. time diagram, indicating poor audio and video quality.
In the measurement diagram, the obtained MER was −2.0 dB, indicating significant dispersion and a low-quality signal. The measured SNR was 7.24 dB, confirming the poor image quality. These measurements, even after error correction, also showed low values, implying that the signal cannot be recovered.
Audio and video reception was successfully achieved for the Ecuavisa channel once the frequency was detected and the spectrum was analyzed. The audiovisual material was obtained using the appropriate bandwidth and meeting the power, MER, and SNR parameters. However, for channels such as TVC or Canal Uno that are not transmitting information, no audio and video signal could be obtained.
6. Conclusions
This study established the different stages of the spectral analysis process using an SDR system involving a fixed antenna, SDR, and a computer to obtain audio and video as the output. Each phase of the process, from signal acquisition to data conversion into audio and video, was identified and deemed crucial to ensure signal quality and system efficiency. The knowledge gained from this study can be applied in various fields, from amateur radio to the telecommunications industry, and can serve as a foundation for future research in the field of spectral analysis using SDR systems.
Signal power analysis, MER, SNR, spectrum, and constellation diagrams are essential elements for evaluating the performance and quality of a communication system. Signal power measurement allows us to determine the amount of energy transmitted and received, which is crucial for ensuring system robustness and coverage. On the other hand, MER and SNR serve as indicators of signal quality, and their measurements are fundamental to ensure reliable and error-free communication.
Author Contributions
Conceptualization, K.A. and F.P.; methodology, K.A. and F.P.; software, K.A. and F.P.; validation, T.S.-A.; formal analysis, K.A. and F.P.; investigation, K.A. and F.P.; resources, K.A. and F.P. and T.S.-A.; data curation, K.A. and F.P.; writing—original draft preparation, K.A. and F.P. and T.S.-A.; writing—review and editing, K.A. and F.P. and T.S.-A.; visualization, K.A. and F.P. and T.S.-A.; supervision, T.S.-A.; project administration, T.S.-A.; funding acquisition, K.A. and F.P. and T.S.-A. All authors have read and agreed to the published version of the manuscript.
Funding
Escuela Politécnica Nacional.
Institutional Review Board Statement
Not applicable.
Informed Consent Statement
Not applicable.
Data Availability Statement
The datasets generated for this study are available on request to the corresponding author.
Acknowledgments
The authors thank the Escuela Politécnica Nacional for their support in the use of DTT testing laboratories.
Conflicts of Interest
The authors declare that the research was conducted in the absence of any commercial or financial relationships that could be construed as potential conflicts of interest.
References
- Universidad Técnica Particular de Loja (UTPL). Virtual Laboratory Practices Ensure a Successful Career. UTPL. 10 March 2021. Available online: https://noticias.utpl.edu.ec/las-practicas-en-laboratorios-virtuales-aseguran-una-carrera-exitosa (accessed on 20 July 2022).
- Muñoz, C. Software Defined Radio, a New Option in Space Communications. Gobierno de México. 2017. Available online: https://haciaelespacio.aem.gob.mx/revistadigital/articul.php?interior=498 (accessed on 19 September 2023).
- Ministry of Telecommunications and Information Society. Master Plan of Transition to Digital Terrestrial Television. Quito. 2018. Available online: https://www.telecomunicaciones.gob.ec/wp-content/uploads/2018/10/PLANMAESTRO-DE-TRANSICI%C3%93N-A-LA-TELEVISI%C3%93N-DIGITAL-TERRESTRE-2018-2021.pdf (accessed on 20 July 2022).
- Enríquez Chicaiza, P.E.; Rivadeneira Obregón, E.D. Comparative Analysis for Digital Terrestrial Television Service in Quito; Salesian Polytechnic University: Quito, Ecuador, 2018; Available online: http://dspace.ups.edu.ec/handle/123456789/15508 (accessed on 8 March 2023).
- Balseca, V. Communications System Using SDR for Practical Multidisciplinary Courses in the Electronics Engineering and Communications of Technical University of Ambato; Technical University of Ambato: Ambato, Ecuador, 2021; Available online: https://repositorio.uta.edu.ec/bitstream/123456789/32718/1/t1807ec.pdf (accessed on 19 September 2023).
- Martínez, M. Design and Implementation of an Algorithm for Satellite Signal Processing Using the Software-Defined Radio Plataform USRP; University of the Americas UDLA: Quito, Ecuador, 2017; Available online: http://dspace.udla.edu.ec/handle/33000/7934 (accessed on 19 September 2023).
- Terán, M. DVB-T Signal Reception with Software Defined Radio; University of Cantabria: Santander, Spain, 2016; Available online: http://hdl.handle.net/10902/9045 (accessed on 19 September 2023).
- Rivera, S.; Beltrán, V.; Pérez, G. Spectrum Analyzer Using Software Defined Radio. Higher School of Mechanical and Electrical Engineering Zacateco Unit. 2019. Available online: http://tesis.ipn.mx/handle/123456789/30136 (accessed on 19 September 2023).
- Belzarena, P.; Flores Guridi, P.; Gómez Sena, G.; Gonzalez Barbone, V. Implementation of an Open ISDB-T Transceiver for Metrology under the Software Defined Radio Paradigm. ANII. Available online: https://iie.fing.edu.uy/investigacion/grupos/artes/en/projects/gr-isdbt/ (accessed on 28 March 2023).
| Disclaimer/Publisher’s Note: The statements, opinions and data contained in all publications are solely those of the individual author(s) and contributor(s) and not of MDPI and/or the editor(s). MDPI and/or the editor(s) disclaim responsibility for any injury to people or property resulting from any ideas, methods, instructions or products referred to in the content. |
© 2023 by the authors. Licensee MDPI, Basel, Switzerland. This article is an open access article distributed under the terms and conditions of the Creative Commons Attribution (CC BY) license (https://creativecommons.org/licenses/by/4.0/).


