
Methodology for Identifying Representative Rates of Change of Frequency (ROCOFs) in an Electric Power System against N-1 Contingencies †

 and
and
Abstract
:1. Introduction
2. Mathematical Modeling
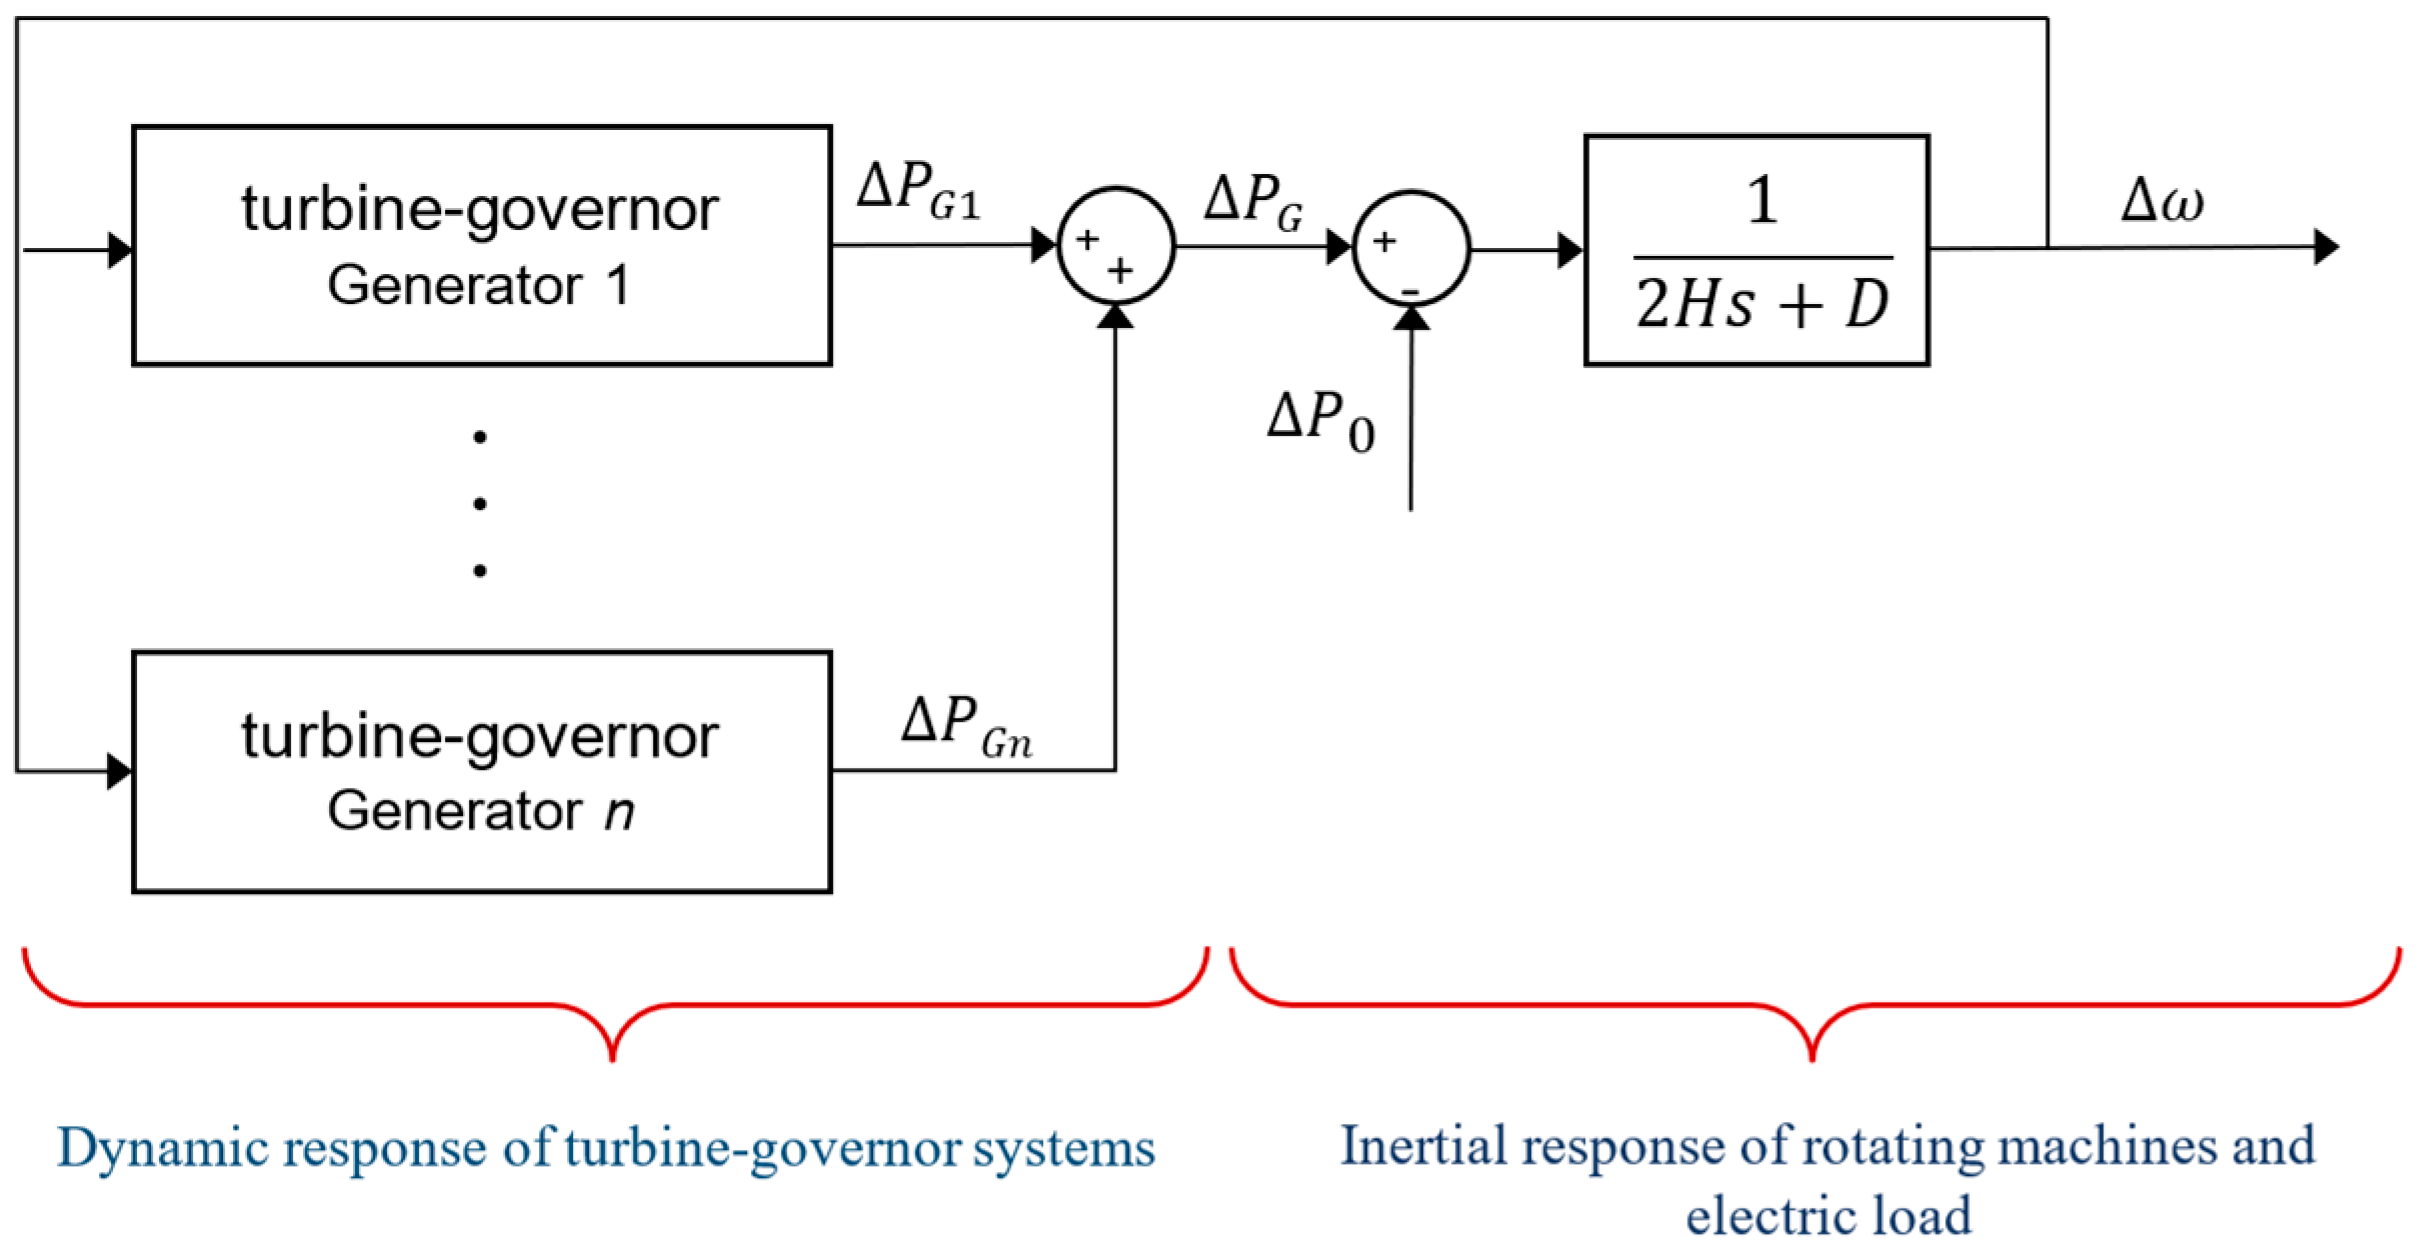
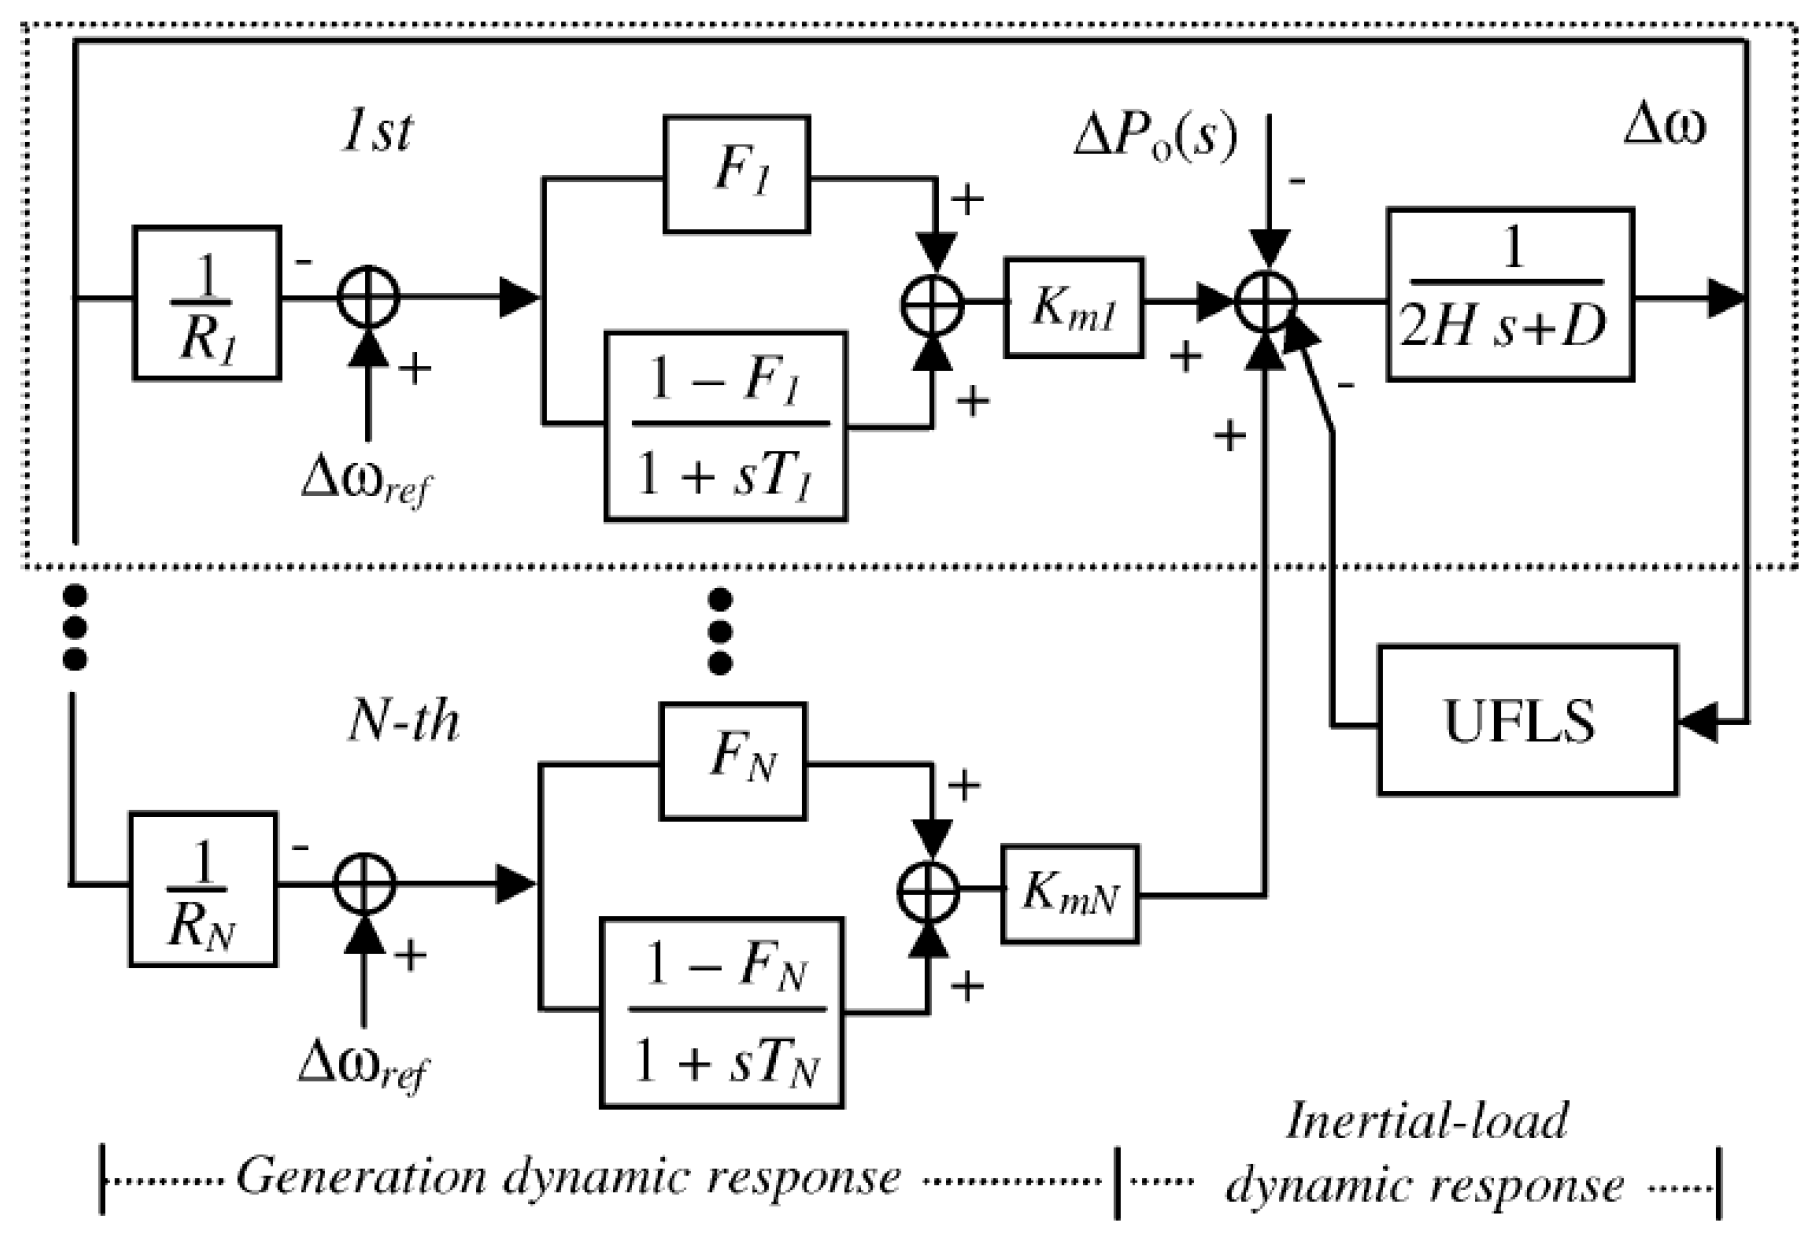
2.1. System Frequency Response (SFR) Models
2.2. Rate of Change of Frequency
3. Methodology
3.1. Parameter Identification
3.2. Monte Carlo Simulation
3.3. Database
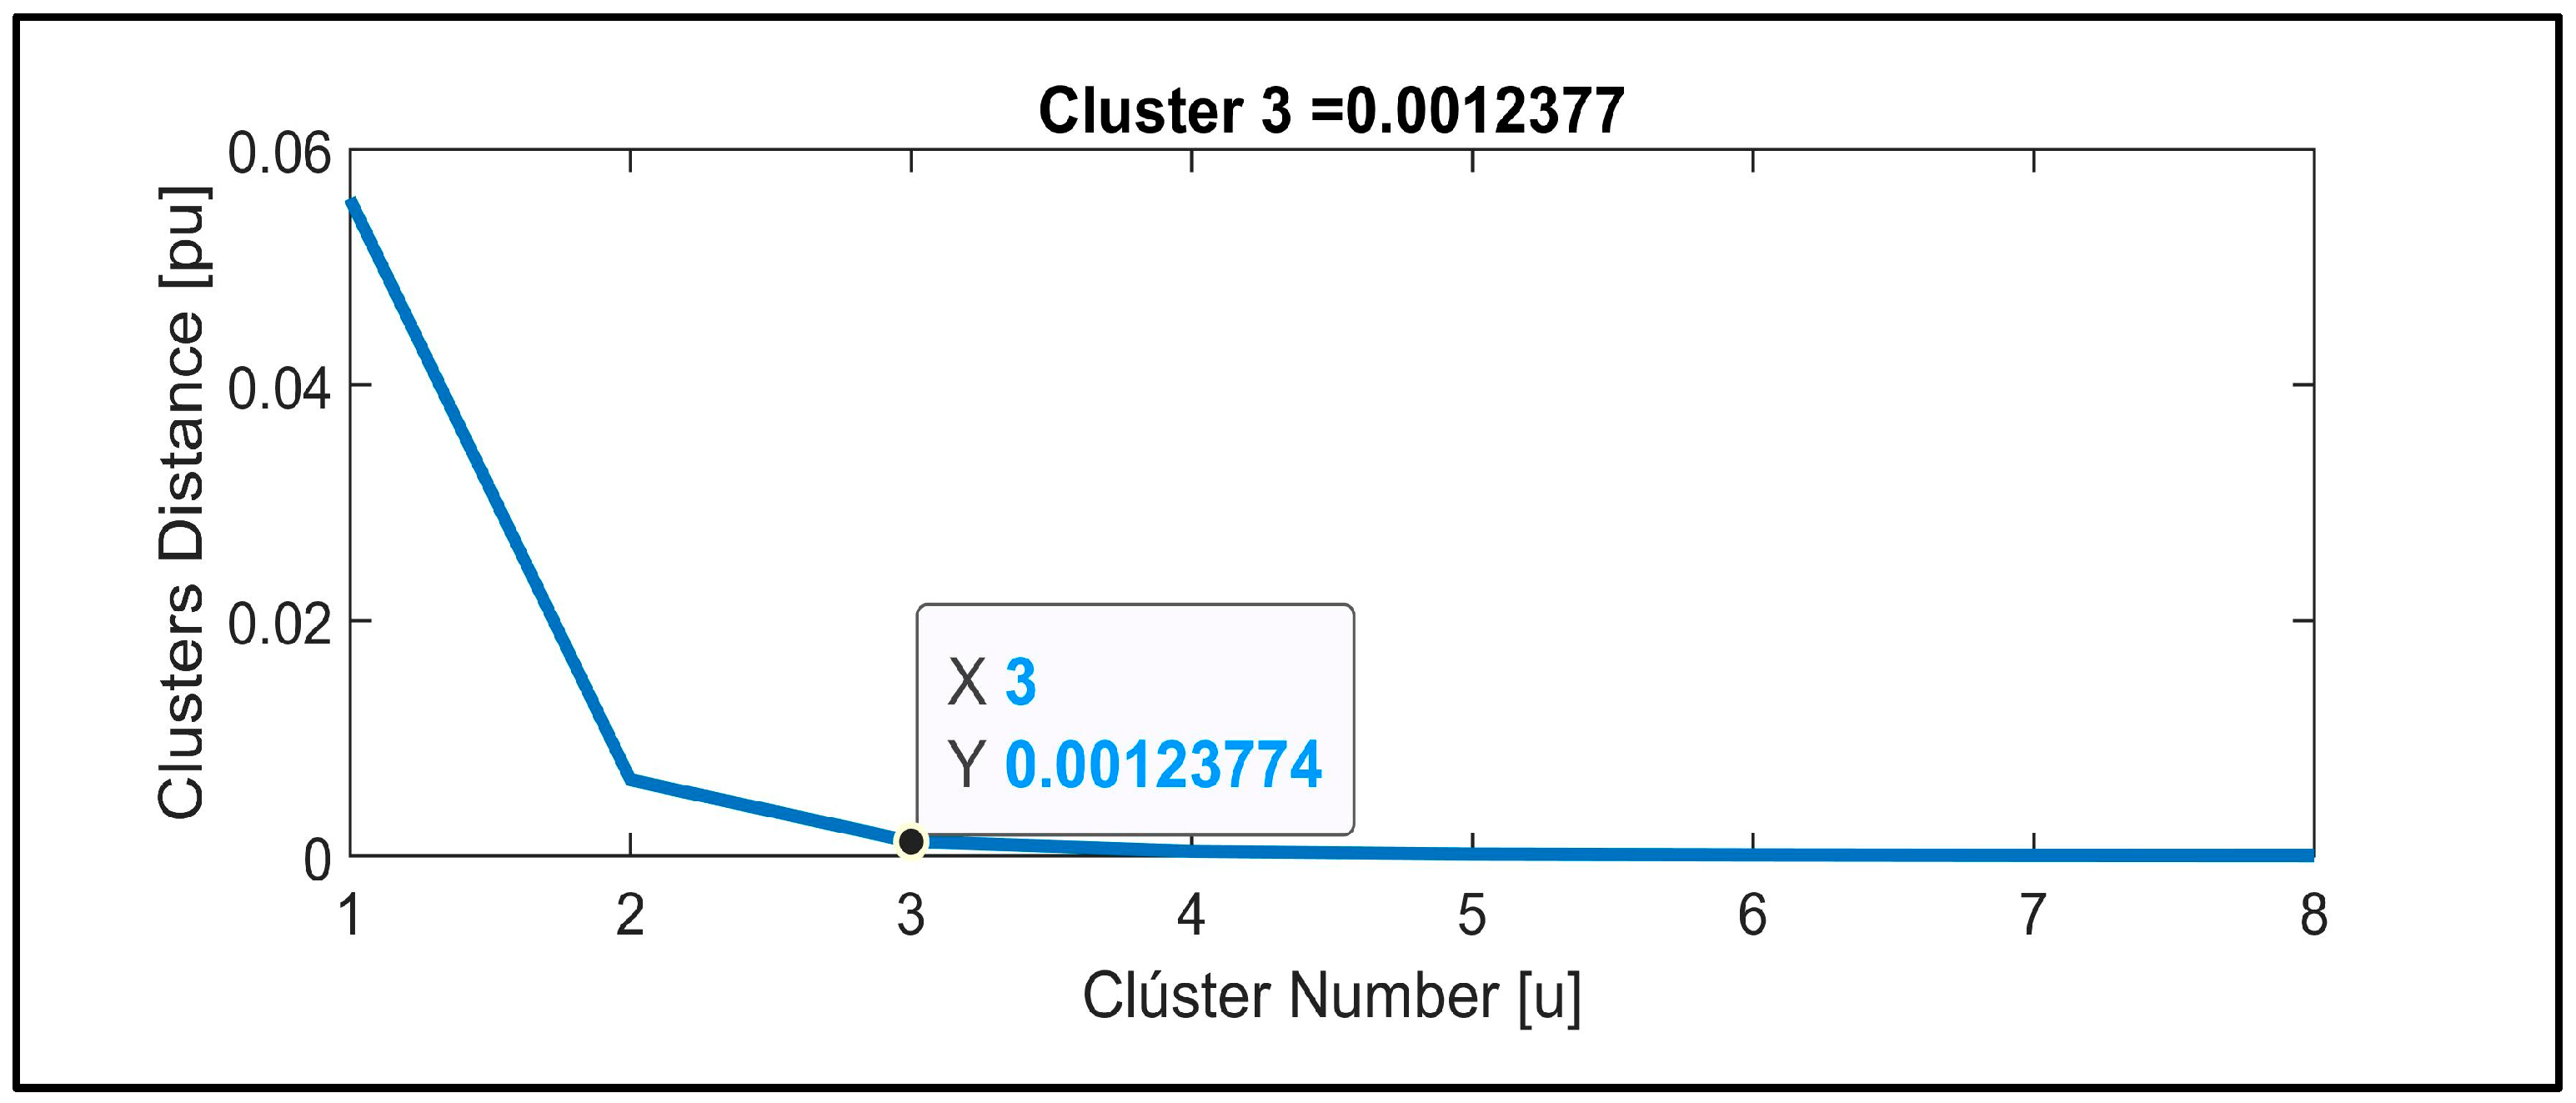
3.4. Data Mining
4. Application of the Methodology and Analysis of Results
5. Discussion of Results
6. Conclusions and Recommendations
Author Contributions
Funding
Institutional Review Board Statement
Informed Consent Statement
Data Availability Statement
Acknowledgments
Conflicts of Interest
Abbreviations
| ROCOF | Rate of Change of Frequency |
| EPS | Electric Power System |
| UFLS | Under-Frequency Load Shedding |
| Governors | Speed Regulators |
| BESS | Battery Energy Storage System |
| NADIR | Lowest Point of the Frequency |
| AGC | Automatic Generation Control |
| MCS | Monte Carlo Simulation |
| SFR | System Frequency Response |
| FDP | Probability Distribution Function |
| Hpre | Equivalent Inertia before the Contingency |
| Hpos | Equivalent Inertia after the Contingency |
| Pout | Lost Generation Power |
| KDD | Knowledge Discovery in Databases |
| Electrical Power Variation | |
| Load Power Variation | |
| Speed Variation | |
| Meters of the First-Order Reduced Model | |
| Equivalent System Inertia | |
| Load Damping | |
| Nominal Power of Each Generator | |
| System Base Power |
References
- Kundur, P. Power System Stability and Control; McGraw-Hill Education: New York, NY, USA, 1994. [Google Scholar]
- Vargas, W.; Chamba, M.S.; Torre, A.D.L.; Echeverría, D. Testing Framework and Validation for Speed Governing Systems—Practical Application at Delsitanisagua Hydropower Plant. Rev. Técnica Energía 2022, 19, 22–33. [Google Scholar] [CrossRef]
- Chamba, M.S.; Vargas, W.; Riofrio, J.; Echeverría, D. Primary Frequency Regulation with Battery Energy Storage Systems in the Ecuadorian Power System. Rev. Técnica Energía 2022, 19, 13–21. [Google Scholar] [CrossRef]
- Rudez, U.; Mihalic, R. Analysis of Underfrequency Load Shedding Using a Frequency Gradient. IEEE Trans. Power Deliv. 2011, 26, 565–575. [Google Scholar] [CrossRef]
- Laghari, J.A.; Mokhlis, H.; Bakar, A.H.A.; Mohamad, H. Application of computational intelligence techniques for load shedding in power systems: A review. Energy Convers. Manag. 2013, 75, 130–140. [Google Scholar] [CrossRef]
- Sun, M.; Liu, G.; Popov, M.; Terzija, V.; Azizi, S. Underfrequency Load Shedding Using Locally Estimated RoCoF of the Center of Inertia|IEEE Journals & Magazine|IEEE Xplore. Available online: https://ieeexplore.ieee.org/document/9362316 (accessed on 15 October 2023).
- Jacome, V.N.; Granda, N.V. Automatic Load Shedding Scheme for Electrical Systems Serving Oil Extraction Facilities. Rev. Técnica Energía 2023, 19, 58–68. [Google Scholar] [CrossRef]
- Sørensen, D.A.; Pombo, D.V.; Iglesias, E.T. Energy storage sizing for virtual inertia contribution based on ROCOF and local frequency dynamics. Energy Strategy Rev. 2023, 47, 101094. [Google Scholar] [CrossRef]
- Anderson, P.M.; Mirheydar, M. A low-order system frequency response model. IEEE Trans. Power Syst. 1990, 5, 720–729. [Google Scholar] [CrossRef]
- Aik, D.L.H. A general-order system frequency response model incorporating load shedding: Analytic modeling and applications. IEEE Trans. Power Syst. 2006, 21, 709–717. [Google Scholar] [CrossRef]
- Terzija, V.V. Adaptive underfrequency load shedding based on the magnitude of the disturbance estimation. IEEE Trans. Power Syst. 2006, 21, 1260–1266. [Google Scholar] [CrossRef]
- Anderson, P.M.; Mirheydar, M. An adaptive method for setting underfrequency load shedding relays. IEEE Trans. Power Syst. 1992, 7, 647–655. [Google Scholar] [CrossRef]
- Egido, I.; Fernandez-Bernal, F.; Centeno, P.; Rouco, L. Maximum Frequency Deviation Calculation in Small Isolated Power Systems. IEEE Trans. Power Syst. 2009, 24, 1731–1738. [Google Scholar] [CrossRef]
- Dudurych, O.; Conlon, M. Impact of reduced system inertia as a result of higher penetration levels of wind generation. In Proceedings of the 2014 49th International Universities Power Engineering Conference (UPEC), Cluj-Napoca, Romania, 2–5 September 2014; pp. 1–6. [Google Scholar] [CrossRef]
- Wu, L. Power System Frequency Measurement Based Data Analytics and Situational Awareness. Ph.D. Thesis, University of Tennessee, Knoxville, TN, USA, 2018. [Google Scholar]
- Wright, P.S.; Davis, P.N.; Johnstone, K.; Rietveld, G.; Roscoe, A.J. Field Measurement of Frequency and ROCOF in the Presence of Phase Steps. IEEE Trans. Instrum. Meas. 2019, 68, 1688–1695. [Google Scholar] [CrossRef]
- European Network of Transmission System Operators for Electricity. Rate of Change of Frequency (ROCOF) Withstand Capability ENTSO-E Guidance Document for National Implementation for Network Codes on Grid Connection; ENTSOE: Brussels, Belgium, 2017. [Google Scholar]
- Cepeda, J.C.; Rueda, J.L.; Erlich, I. Identification of dynamic equivalents based on heuristic optimization for smart grid applications. In Proceedings of the 2012 IEEE Congress on Evolutionary Computation, Brisbane, QLD, Australia, 10–15 June 2012; pp. 1–8. [Google Scholar] [CrossRef]
- Chamba, M.; Vargas, W.; Cepeda, J. Probabilistic assessment of transient stability considering the uncertainty of the demand and risk management. Energía 2018, 15, 1–10. [Google Scholar]
- Centro Nacional de Control de Energía. Determinación Del Esquema De Alivio De Carga Por Baja Frecuencia Para El Sistema Nacional Interconectado; CENACE: Quito, Ecuador, 2022. [Google Scholar]
- Fayyad, U.; Haussler, D.; Stolorz, P. KDD for Science Data Analysis: Issues and Examples. 2000. Available online: https://cdn.aaai.org/KDD/1996/KDD96-009.pdf (accessed on 15 October 2023).
- Peña, D. Análisis de Datos mu Ltivariantes; Mc Graw Hill Education: Madrid, España, 2010. [Google Scholar]
- Athay, T.; Podmore, R.; Virmani, S. A Practical Method for the Direct Analysis of Transient Stability. IEEE Trans. Power Appar. Syst. 1979, PAS-98, 573–584. [Google Scholar] [CrossRef]


| Component | Variable | Characteristics | |
|---|---|---|---|
| Loads | Active Power | Normal | Mean: [0.5, 0.75, 1] * Variance = 5% |
| Power Factor | Uniform | Equal value to base case |
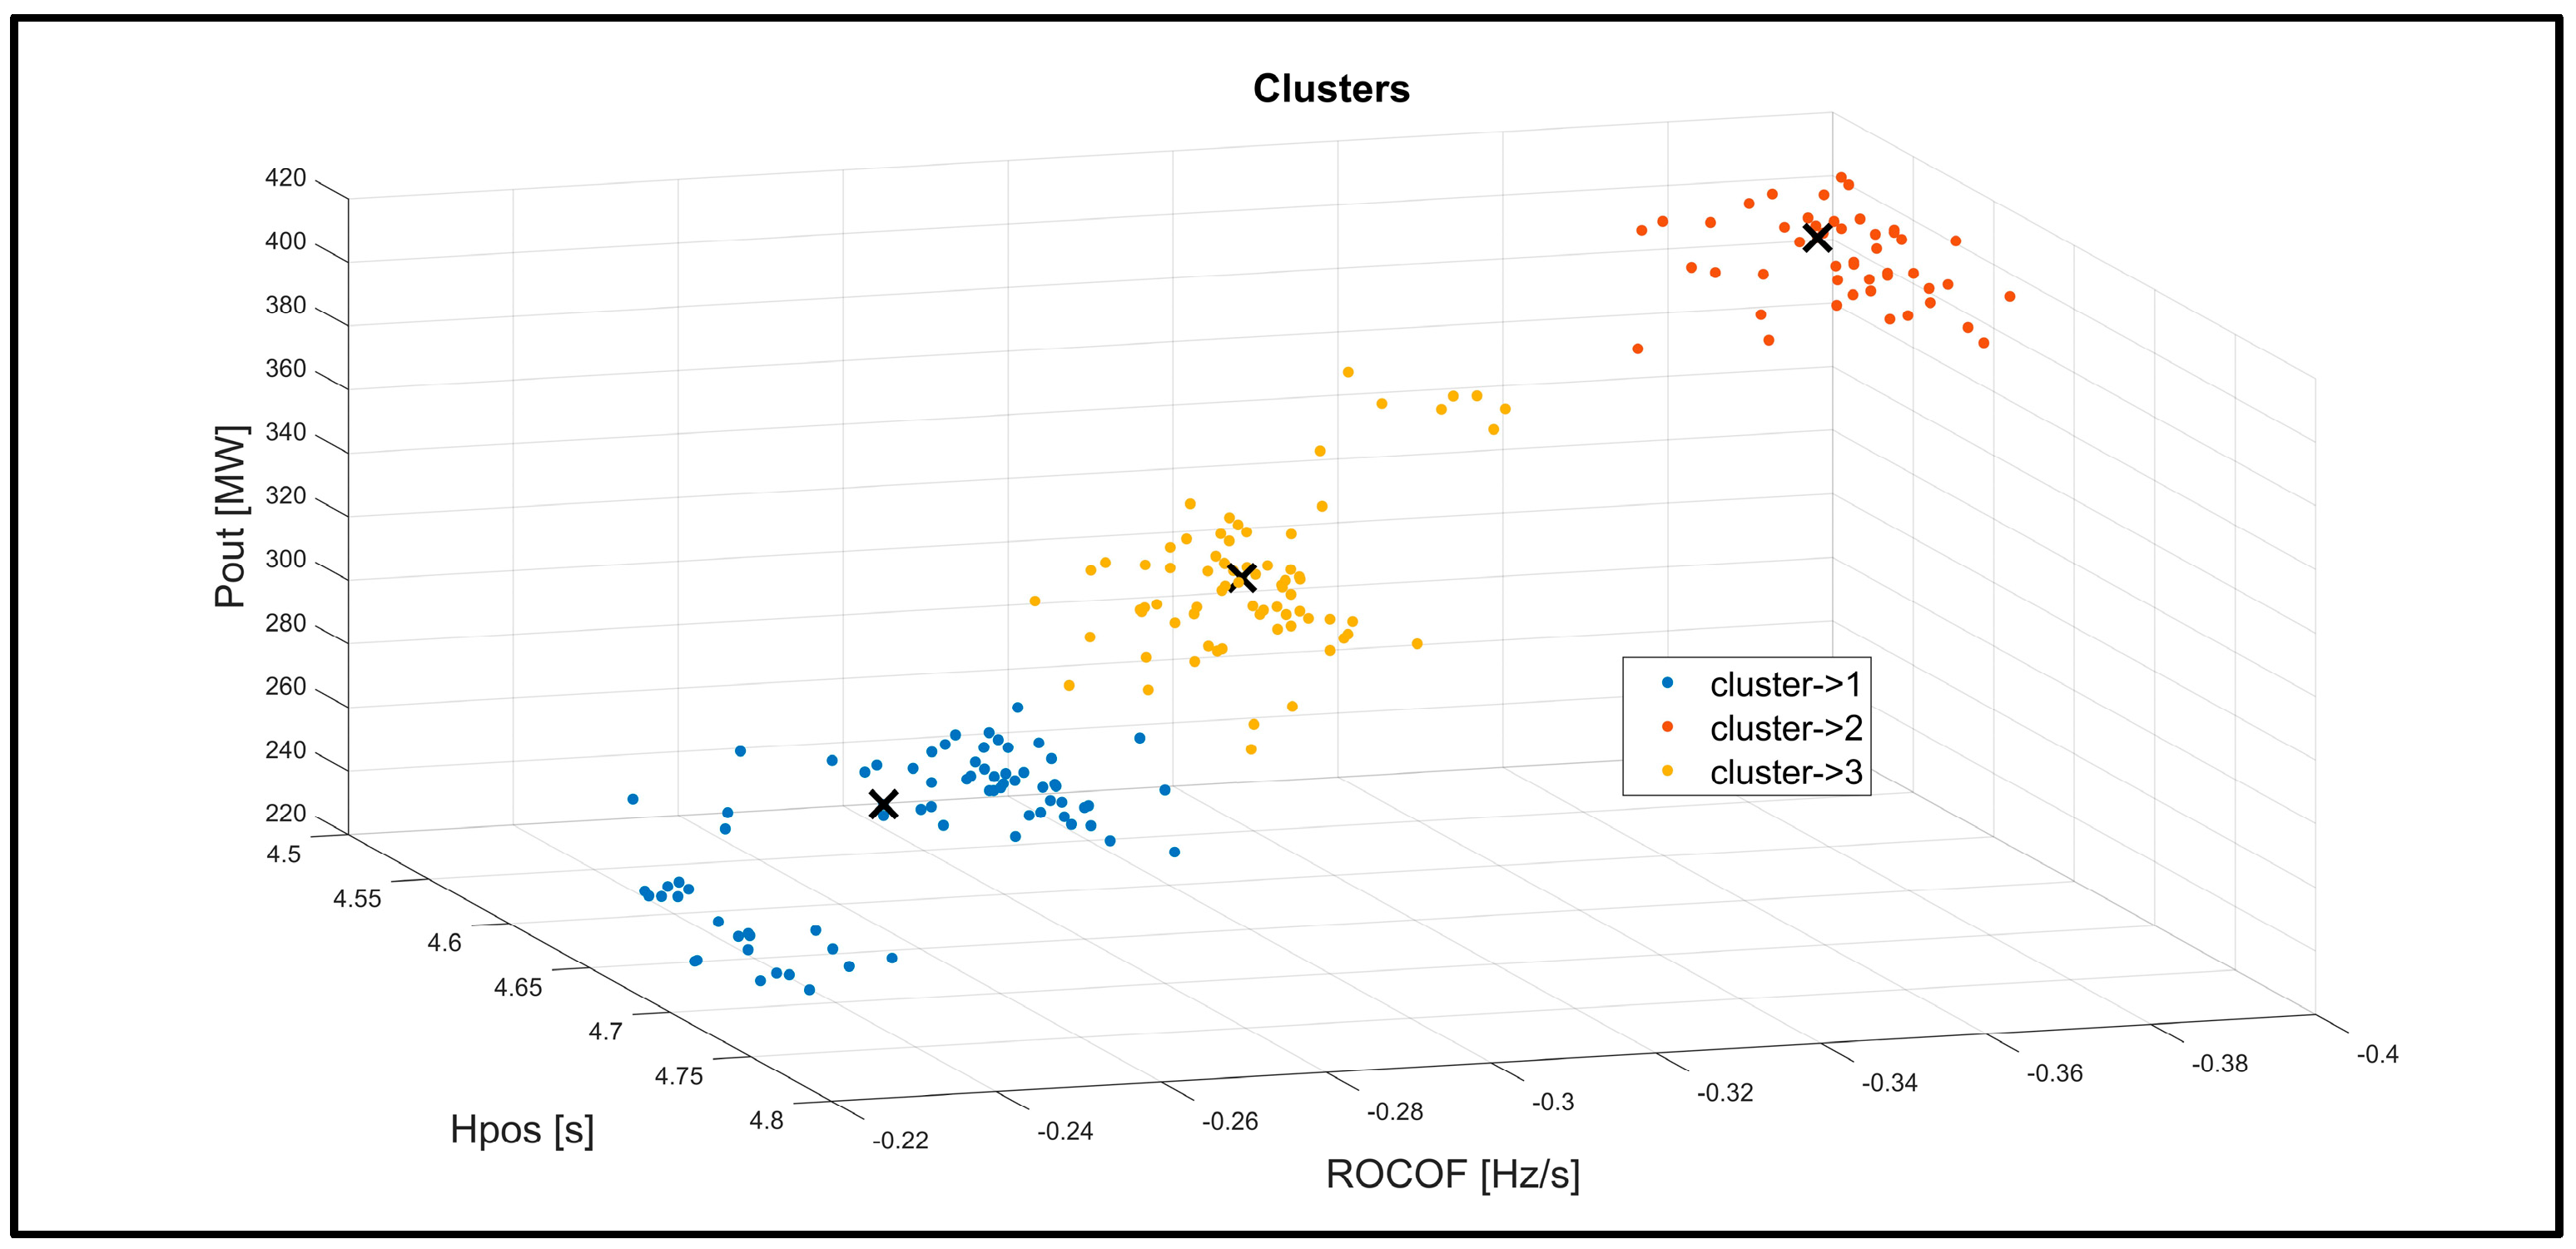
| Groups | ROCOF [Hz/s] | Hpre | Hpos | Pout | NADIR |
|---|---|---|---|---|---|
| Cluster 1 | −0.30394497 | 4.89268039 | 4.62509346 | 322.999994 | 59.0806595 |
| Cluster 2 | −0.38361007 | 4.89527662 | 4.57441948 | 403.749999 | 58.7209959 |
| Cluster 3 | −0.25267691 | 4.88498889 | 4.66507255 | 270.696622 | 59.3051917 |
| Article | Main Strengths | Main Weaknesses |
|---|---|---|
| Underfrequency Load Shedding Using Locally Estimated RoCoF of the Center of Inertia |
| The methodology does not consider the different operational scenarios and contingencies that may occur in the system. |
| Automatic Load Shedding Scheme for Electrical Systems Serving Oil Extraction Facilities |
| There are a limited number of contingencies that depend on the designer’s experience. |
| Energy storage sizing for virtual inertia contribution based on ROCOF and local frequency dynamics |
| A characterization of the system from the ROCOF point of view is not obtained. |
Disclaimer/Publisher’s Note: The statements, opinions and data contained in all publications are solely those of the individual author(s) and contributor(s) and not of MDPI and/or the editor(s). MDPI and/or the editor(s) disclaim responsibility for any injury to people or property resulting from any ideas, methods, instructions or products referred to in the content. |
© 2023 by the authors. Licensee MDPI, Basel, Switzerland. This article is an open access article distributed under the terms and conditions of the Creative Commons Attribution (CC BY) license (https://creativecommons.org/licenses/by/4.0/).
Share and Cite
Lozada, C.X.; Vargas, W.A.; Granda, N.V.; Chamba, M.S. Methodology for Identifying Representative Rates of Change of Frequency (ROCOFs) in an Electric Power System against N-1 Contingencies. Eng. Proc. 2023, 47, 8. https://doi.org/10.3390/engproc2023047008
Lozada CX, Vargas WA, Granda NV, Chamba MS. Methodology for Identifying Representative Rates of Change of Frequency (ROCOFs) in an Electric Power System against N-1 Contingencies. Engineering Proceedings. 2023; 47(1):8. https://doi.org/10.3390/engproc2023047008
Chicago/Turabian StyleLozada, Carlos Xavier, Walter Alberto Vargas, Nelson Victoriano Granda, and Marlon Santiago Chamba. 2023. "Methodology for Identifying Representative Rates of Change of Frequency (ROCOFs) in an Electric Power System against N-1 Contingencies" Engineering Proceedings 47, no. 1: 8. https://doi.org/10.3390/engproc2023047008
APA StyleLozada, C. X., Vargas, W. A., Granda, N. V., & Chamba, M. S. (2023). Methodology for Identifying Representative Rates of Change of Frequency (ROCOFs) in an Electric Power System against N-1 Contingencies. Engineering Proceedings, 47(1), 8. https://doi.org/10.3390/engproc2023047008