1. Introduction
“The evolution of the pandemic caused by COVID-19, its high reproductive number and the associated clinical needs, is overwhelming national health systems.” (Hierro et al. [
1]) Forecasting the outcome of outbreaks as early and as accurately as possible is crucial for decision-making and policy implementations. Much research has tried to predict the development of the pandemic, its spread, and factors that can influence the death rates of COVID-19 or its spatial variations.
For example, Sun et al. [
2] investigated the mortality rate across England and assessed the contributions of socioeconomic and environmental factors to spatial variations of COVID-19. They used spatial regression models to estimate the COVID-19 mortality rate and examined the factors that are related to it. They found out that hospital accessibility and relative humidity are negatively related to the COVID-19 mortality rate, but the percentage of Asians and of Blacks, and unemployment rate are related positively to the COVID-19 mortality rate.
Gerli et al. [
3] estimated mortality trends in the 27 countries of the European Union (EU), plus Switzerland and the UK, where lockdown dates and confinement interventions have been heterogeneous, and explored its determinants. Hierro et al. [
1] employed an OLS and delayed elasticity method to predict mortality for COVID-19 in the US.
Rechtman et al. [
4] used gradient-boosting machine learning to predict COVID-19 related mortality based on factors that were identified by logistic regression, i.e., older age, male sex, higher BMI, higher heart rate, higher respiratory rate, lower oxygen saturation, and chronic kidney disease were associated with COVID-19 mortality.
We already know that due to SARS-Cov-2, the life expectancy of people is lower. However, the age-and-sex specific death rates have not been calculated yet. We have to consider and excess mortality (the number of deaths from all causes during a crisis—pandemic situation—above what we would have expected to see under normal conditions). Especially in higher age categories, the cause of death is often the SARS-Cov-2 virus. For example, in Spain, COVID-19 caused deaths even in 44.24% of males and 35.67% females in the age group from 70 to 79 years from 9 March until 9 July 2020 (for detailed data, see Olabi et al. [
5]).
Dead rates are changing and have different patterns than in previous years. There are many restrictions, with even complete lockdown, that shall prevent the deaths. Besides, in the Czech Republic, the announcement of the restriction is quite chaotic, and their enforcement relatively weak (in many cases) that forecasting based on econometric models can be misleading. Moreover, it is difficult to predict the situation. As with every modeling apparatus, also mortality forecasting is sensitive to the extraordinary events that are unpredictable and seriously bias the estimate accuracy.
We can agree with Soubeyrand et al. [
6] that “discrepancies in population structures, decision making, health systems, and numerous other factors result in various COVID-19-mortality dynamics at the country scale, and make the forecast of deaths in a country under focus challenging.”
Ioannidis et al. [
7] even proclaimed that forecasting for COVID-19 has failed, due to “poor data input, wrong modeling assumptions, high sensitivity of estimates, lack of incorporation of epidemiological features, poor past evidence on effects of available interventions, lack of transparency, errors, lack of determinacy, consideration of only one or a few dimensions of the problem at hand, lack of expertise in crucial disciplines, groupthink, and bandwagon effects, and selective reporting”. Moreover, predicting the future rate of infection is difficult, due to “not knowing the true mechanisms of transmission, infection, and recovery and not having accurate data on who has actually been exposed to the virus and have tested positive to its antibodies.” (Allenby [
8]).
However, we are concerned with the long forecasting horizon and use real mortality data (regardless of whether the death was caused by the COVID-19 or not), so this gives hope that forecasting is accurate and without above-stated shortcomings. Modern forecasting methods are used.
A similar method—the Lee–Carter model—for mortality forecasting was also used by Diaz-Rojo, Debon, and Mosquera [
9]. They found out that changes in mortality patterns might be due to COVID-19. “The mortality changes identified in the control charts pertain to changes in the population’s health conditions or new causes of death such as COVID-19 in the coming years.” (Diaz-Rojo, Debon, and Mosquera [
9]).
The challenges of correct forecasting of COVID-19 spread and mortality of forecasting were also examined by Dayaratna and Michel [
10], who showed how different model assumptions change the results of the forecast.
We would like to go further in our analysis and try to project the mortality rates in the future based on available data knowing that COVID-19 might have changed the current situation and can distort the forecasting. We would like to discuss the results of two forecasts by a Lee–Carter model and their differences and to find in what ages they are the highest.
2. Data and Methodology
We chose two heavily hit countries by COVID-19 for a case study: Spain and the Czech Republic (CR). (Besides also Italy and Belgium were also seriously influenced at some time.) Spain had until the end of February over 3.18 mil. cases of disease with total cumulative deaths over 68 thousand. The worst situation was there in March and April 2020. Contrary to that, Czech Republic currently has over 1.23 mil. cases with cumulative deaths over 20 thousand. There have been three peaks so far—October 2020, and January and February 2021. Given that the population of Spain is almost 46.8 mil., and in the Czech Republic, 10.7 mil., the situation is worse in Czechia. (For actual data see [
11]
https://worldhealthorg.shinyapps.io/covid/ (accessed on 31 May 2021)).
2.1. Data
Data about the Czech Republic and Spain mortality for the period of 1981 to 2018 comes from the Eurostat database. We choose 1981 because since that there are full age-and-sex specific data about population and deaths available. (Spain gathered data only up to 85 years until 1980).
Mortality rates were calculated from two Eurostat tables: Deaths by age and sex [demo_magec]—last update 8 February 2021 (extracted 10 February 2021) and Population on 1 January by age and sex [demo_pjan]—last update 8 February 2021 (extracted 10 February 2021). First, the population on 1 January had to be recalculated to mid-year population state in time
t (
Px,t). We took the population state on 1 January in year
t and
t + 1, summed it, and divided it by 2 (i.e., simple arithmetic mean). The central mortality rate in time
t (
mx,t) was then calculated as (1):
where
Dx,t is the number of deaths in time
t. Data about mortality rates for 2019 in the Czech Republic comes from the
Czech Statistical Office (Prague, Czech Republic) database, and for Spain for 2019 are taken from
Instituto Nacional de Estadística (Madrid, Spain). Data for 2020 are available in The
Human Mortality Database, but they are not age-specific (there are only age categories 0–14, 15–64, 65–74, 75–84, 85+), so the projection cannot include this year directly.
We had to recalculate the number of deaths according to the proportion of dead people in each category. The proportion was calculated as five-year simple arithmetic means of 2015–2019. Particularly the number of deaths in category 0–14 was summed, and the number of deaths in particular age was divided by this sum. This was done for each age category and each year. Then the number of deaths in 2020 was taken from the Human Mortality Database (University of California, Berkeley & Max Planck Institute for Demographic Research, Rostock) and recalculated according to the average proportion for each age. The number of inhabitants on 1 January 2020 was taken from Eurostat as the previous data about the number of inhabitants. We could not calculate the mid-term number of inhabitants, because the data for 1 January 2021 are unknown. Finally, death rates were calculated according to (1).
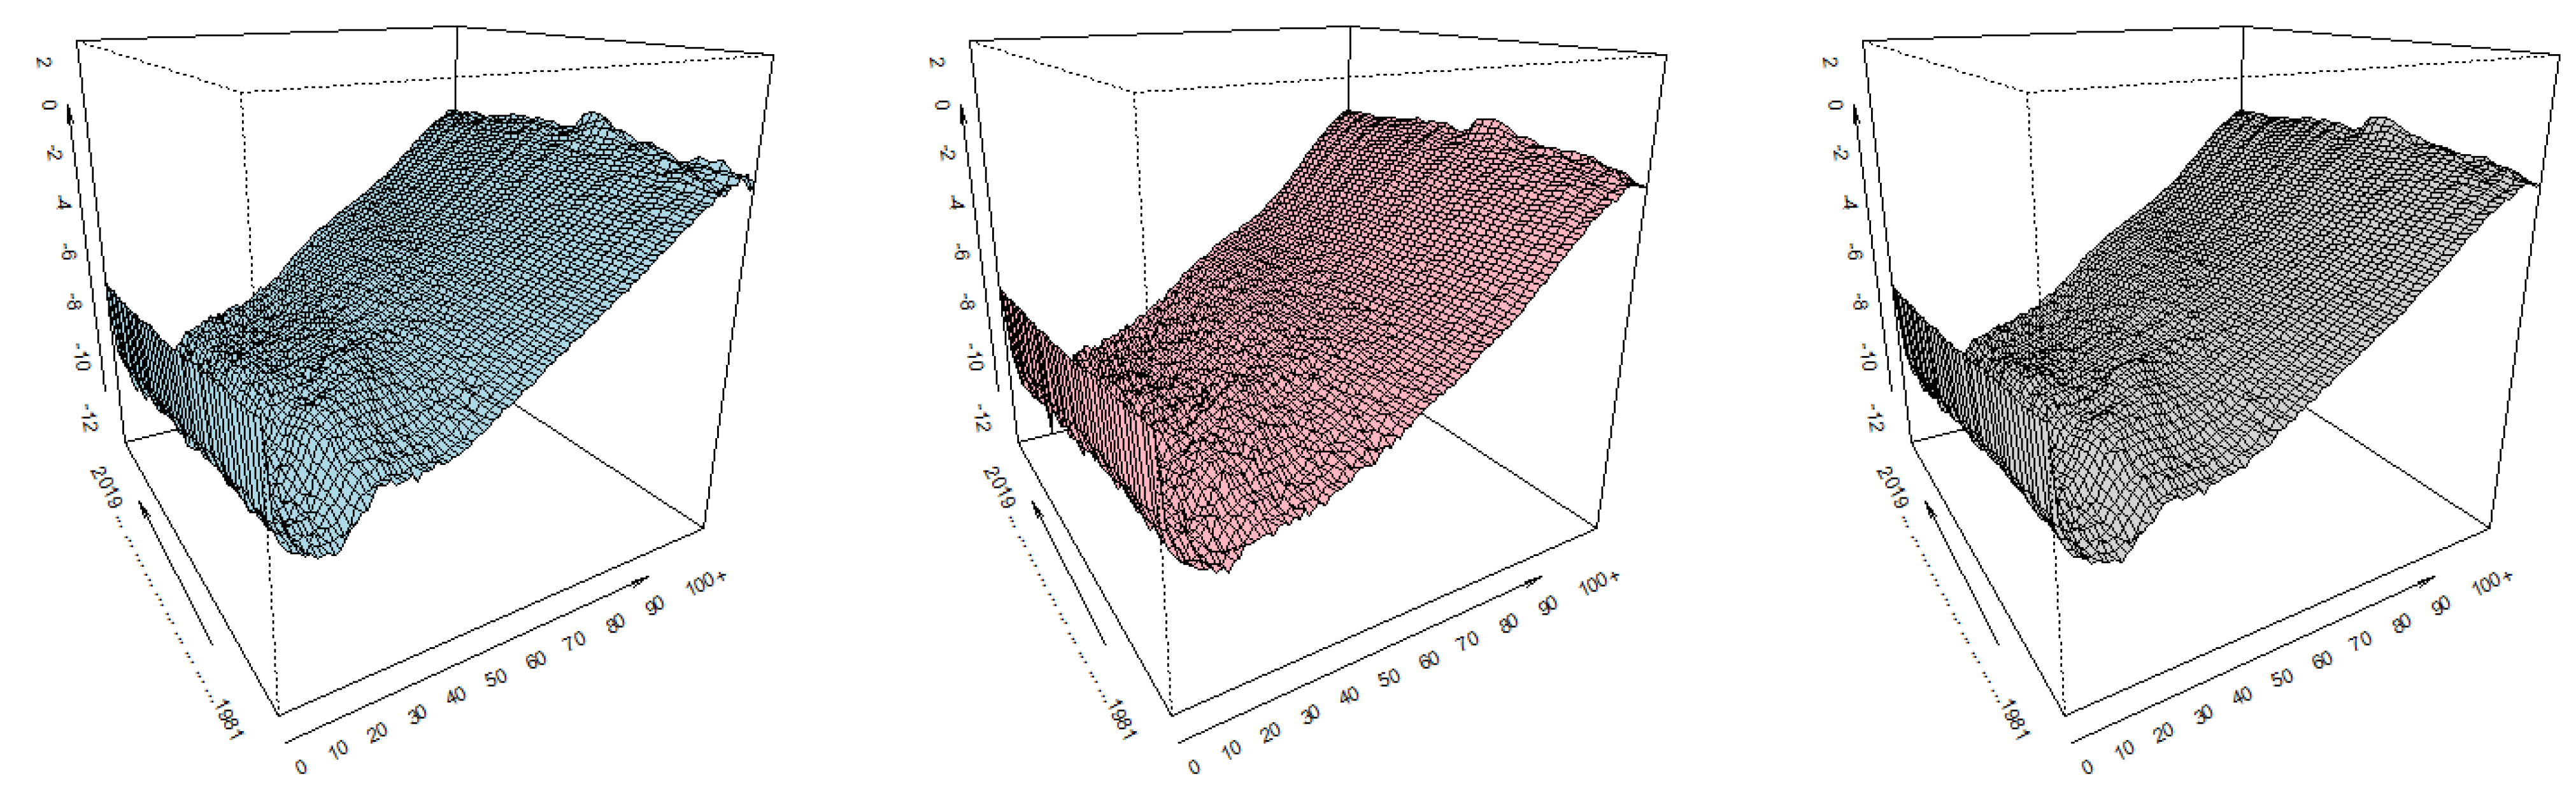
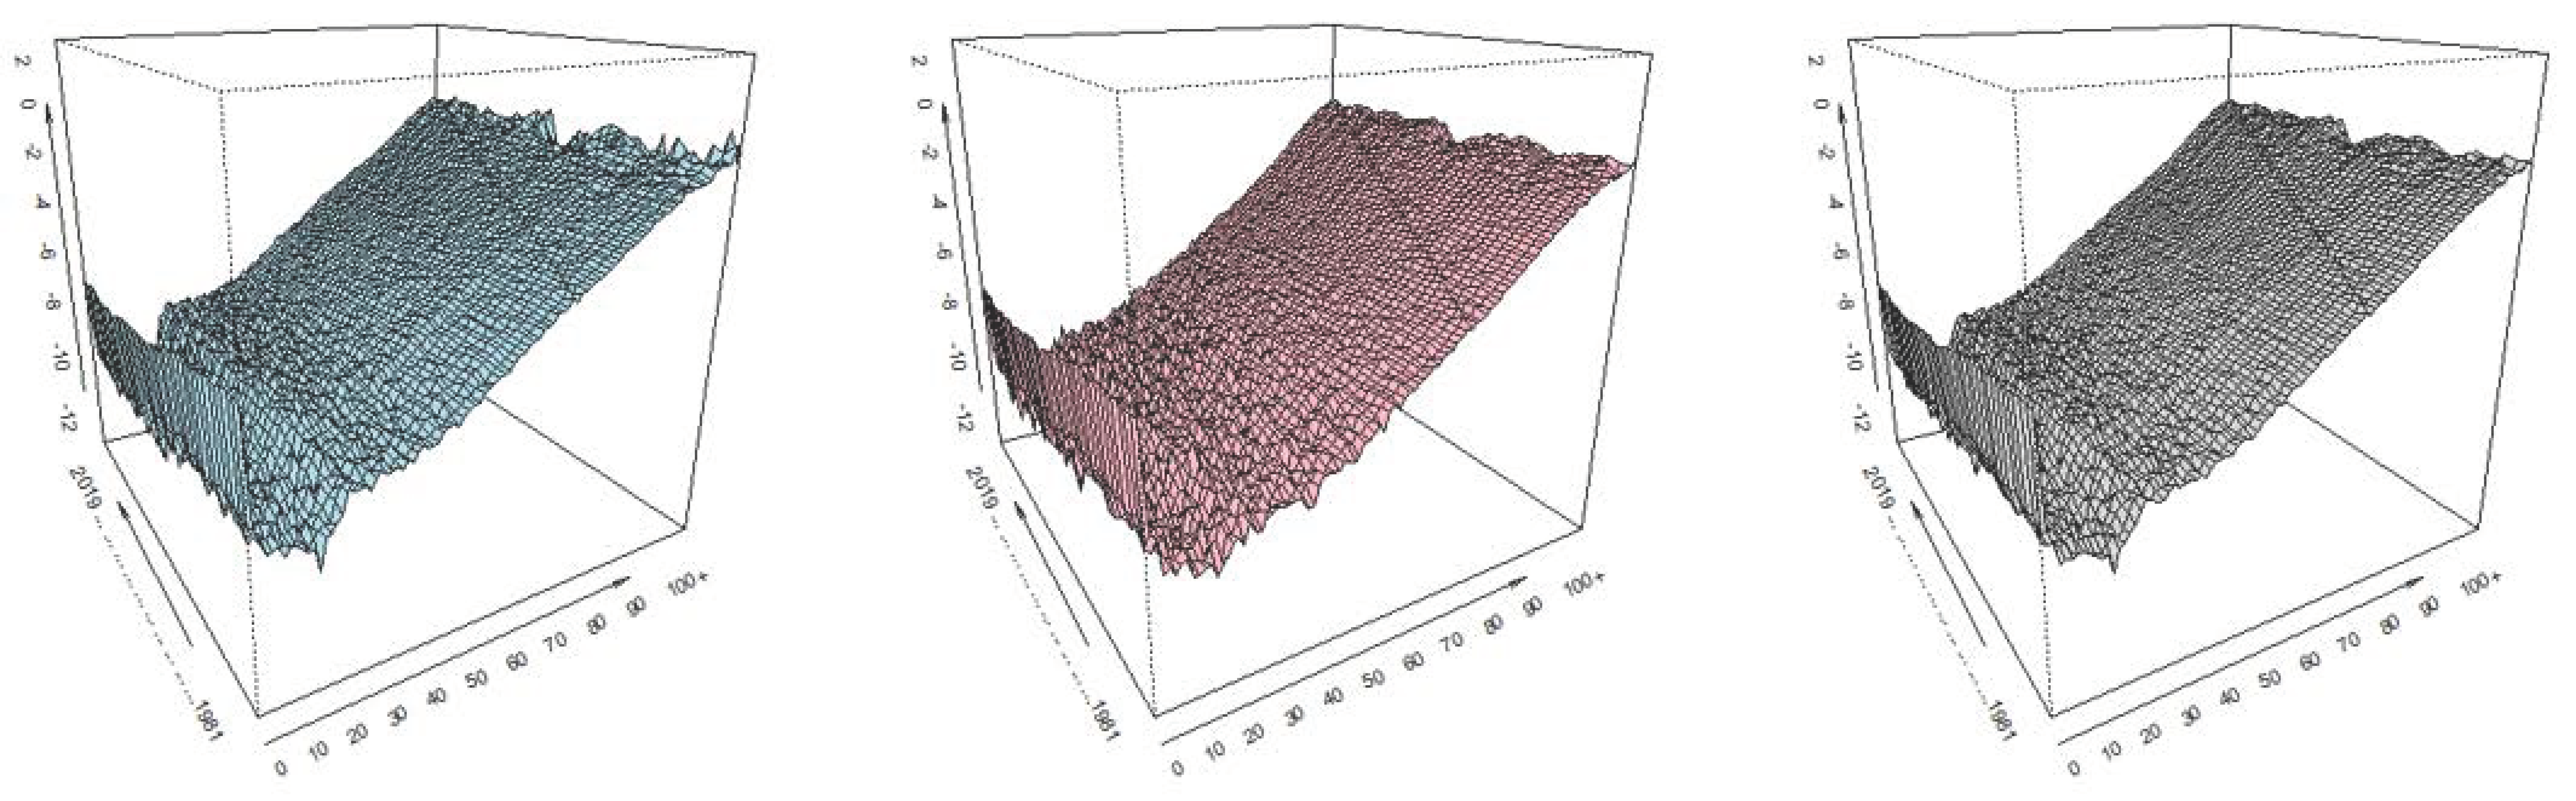
Empirical (and calculated) values of death rates (in logarithms) are displayed in
Figure 1 for the Czech Republic and
Figure 2 for Spain.
We can identify moments in time and age intervals at which the observed probability of death is substantially different from the pattern of mortality in other periods. Sometimes the patterns are random, e.g., in higher ages, the differences are high, so the mortality rates are modeled in logarithms; sometimes they reflect historical events, for example World War II.
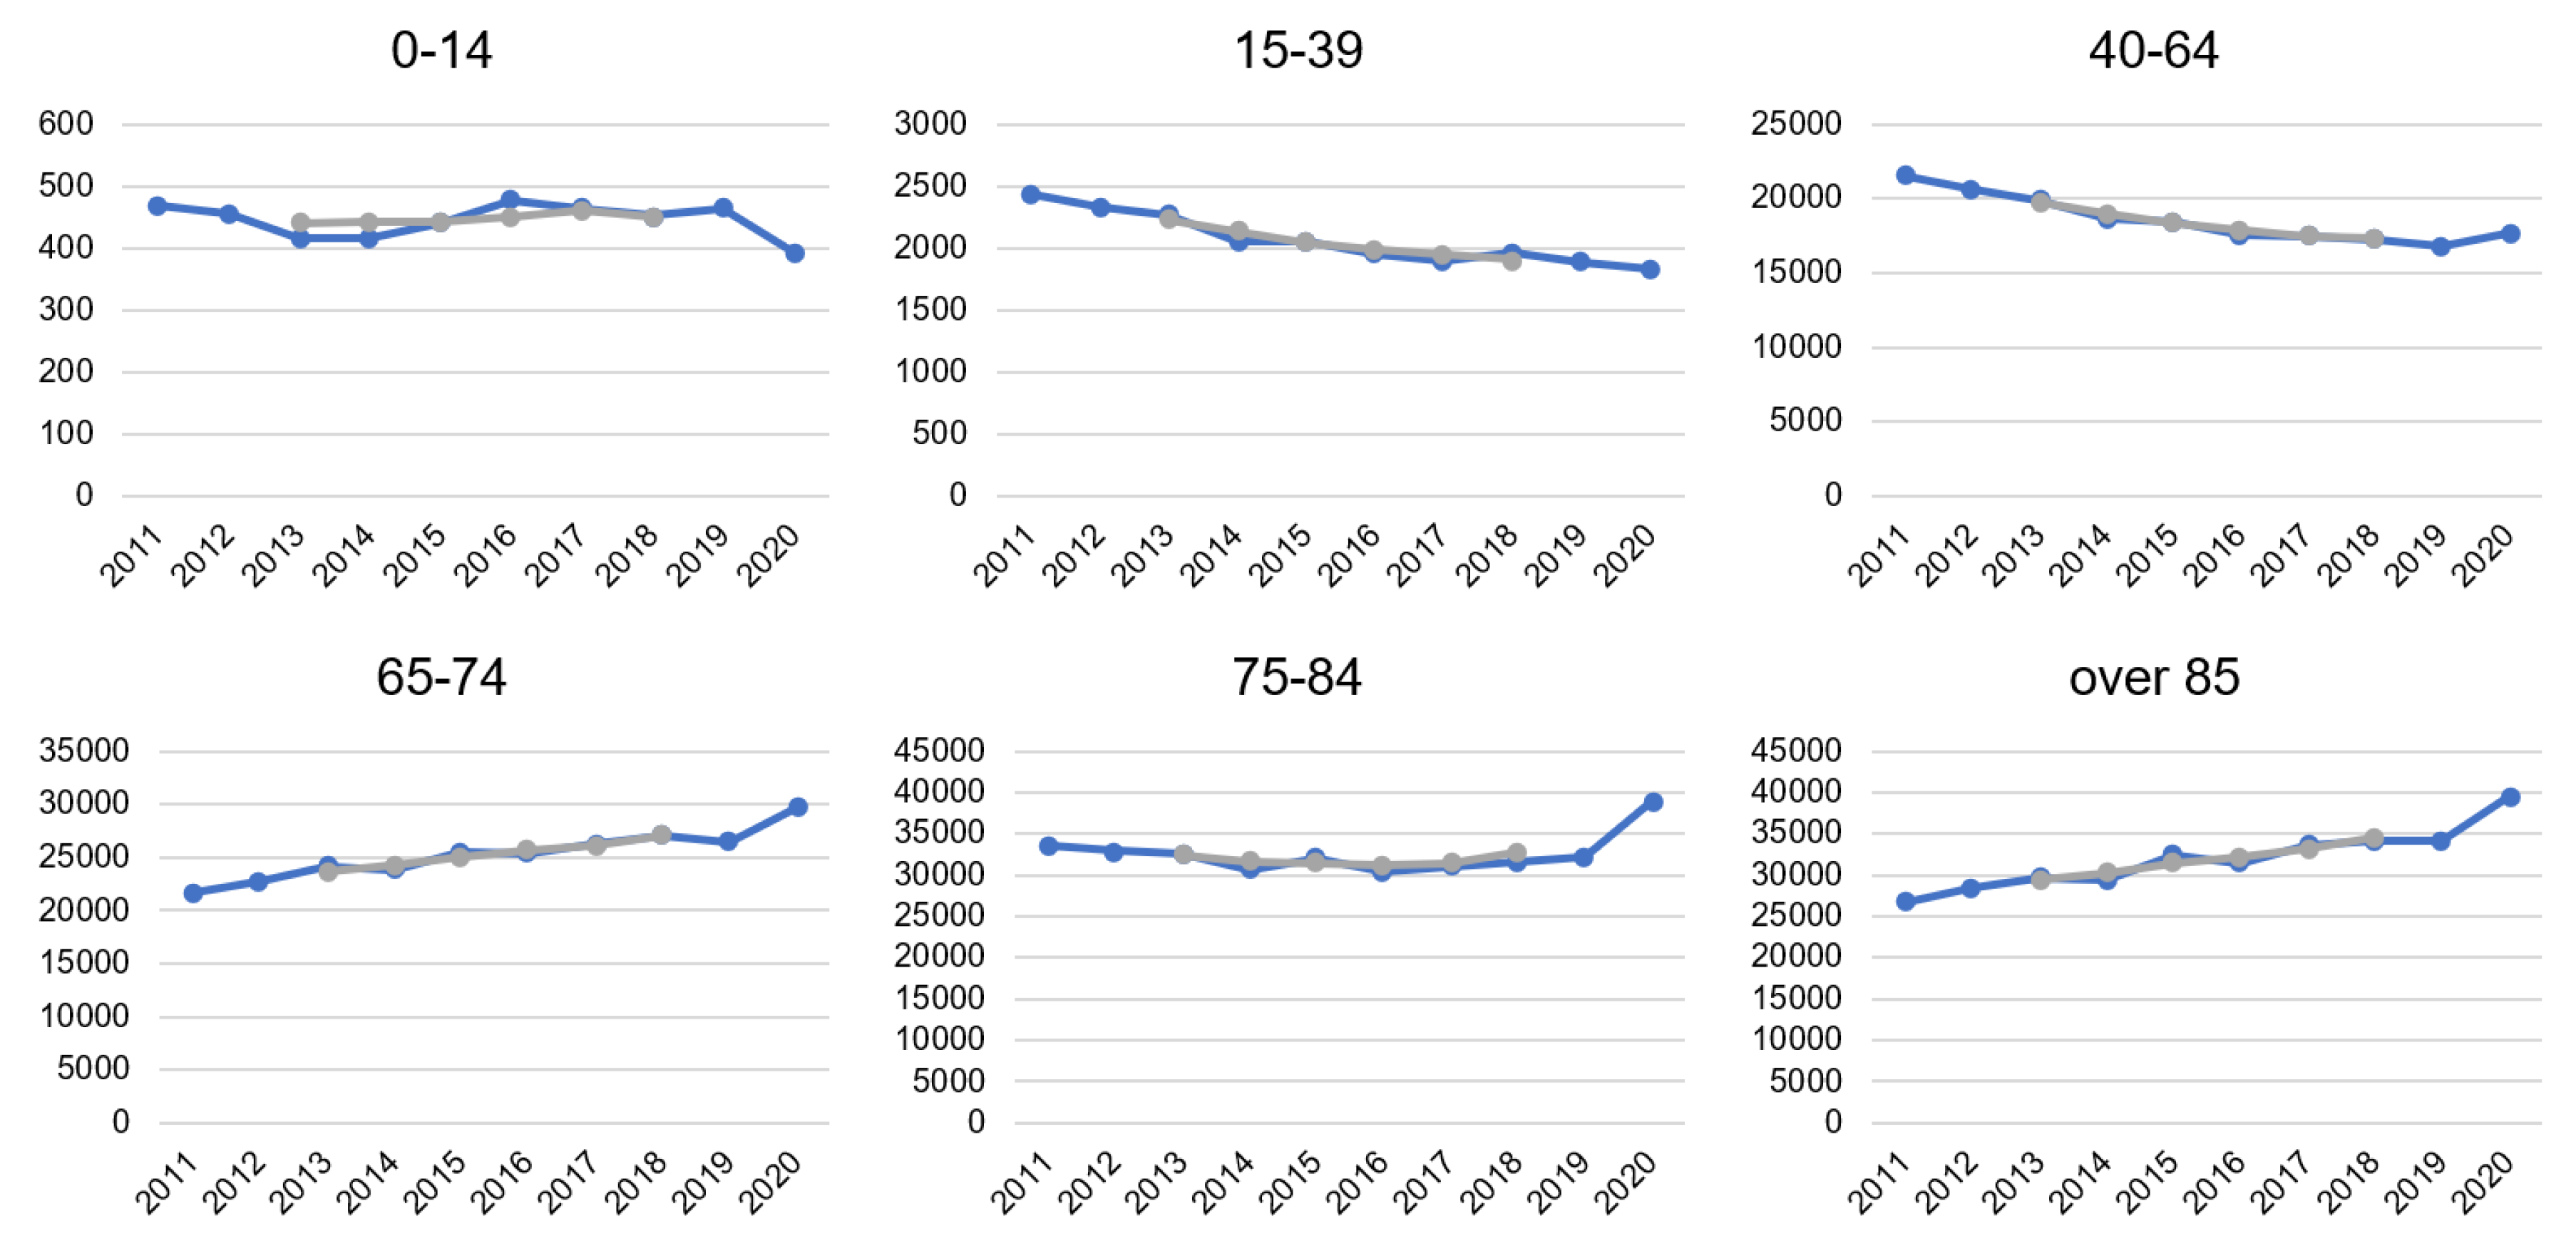
In data from 1981 to 2019, there is nothing significantly different from other periods. Interesting differences are only between 2019 and 2020. Therefore, we take real data from the last 10 years for age categories and display the mortality trend by calculating 5 years moving averages. From
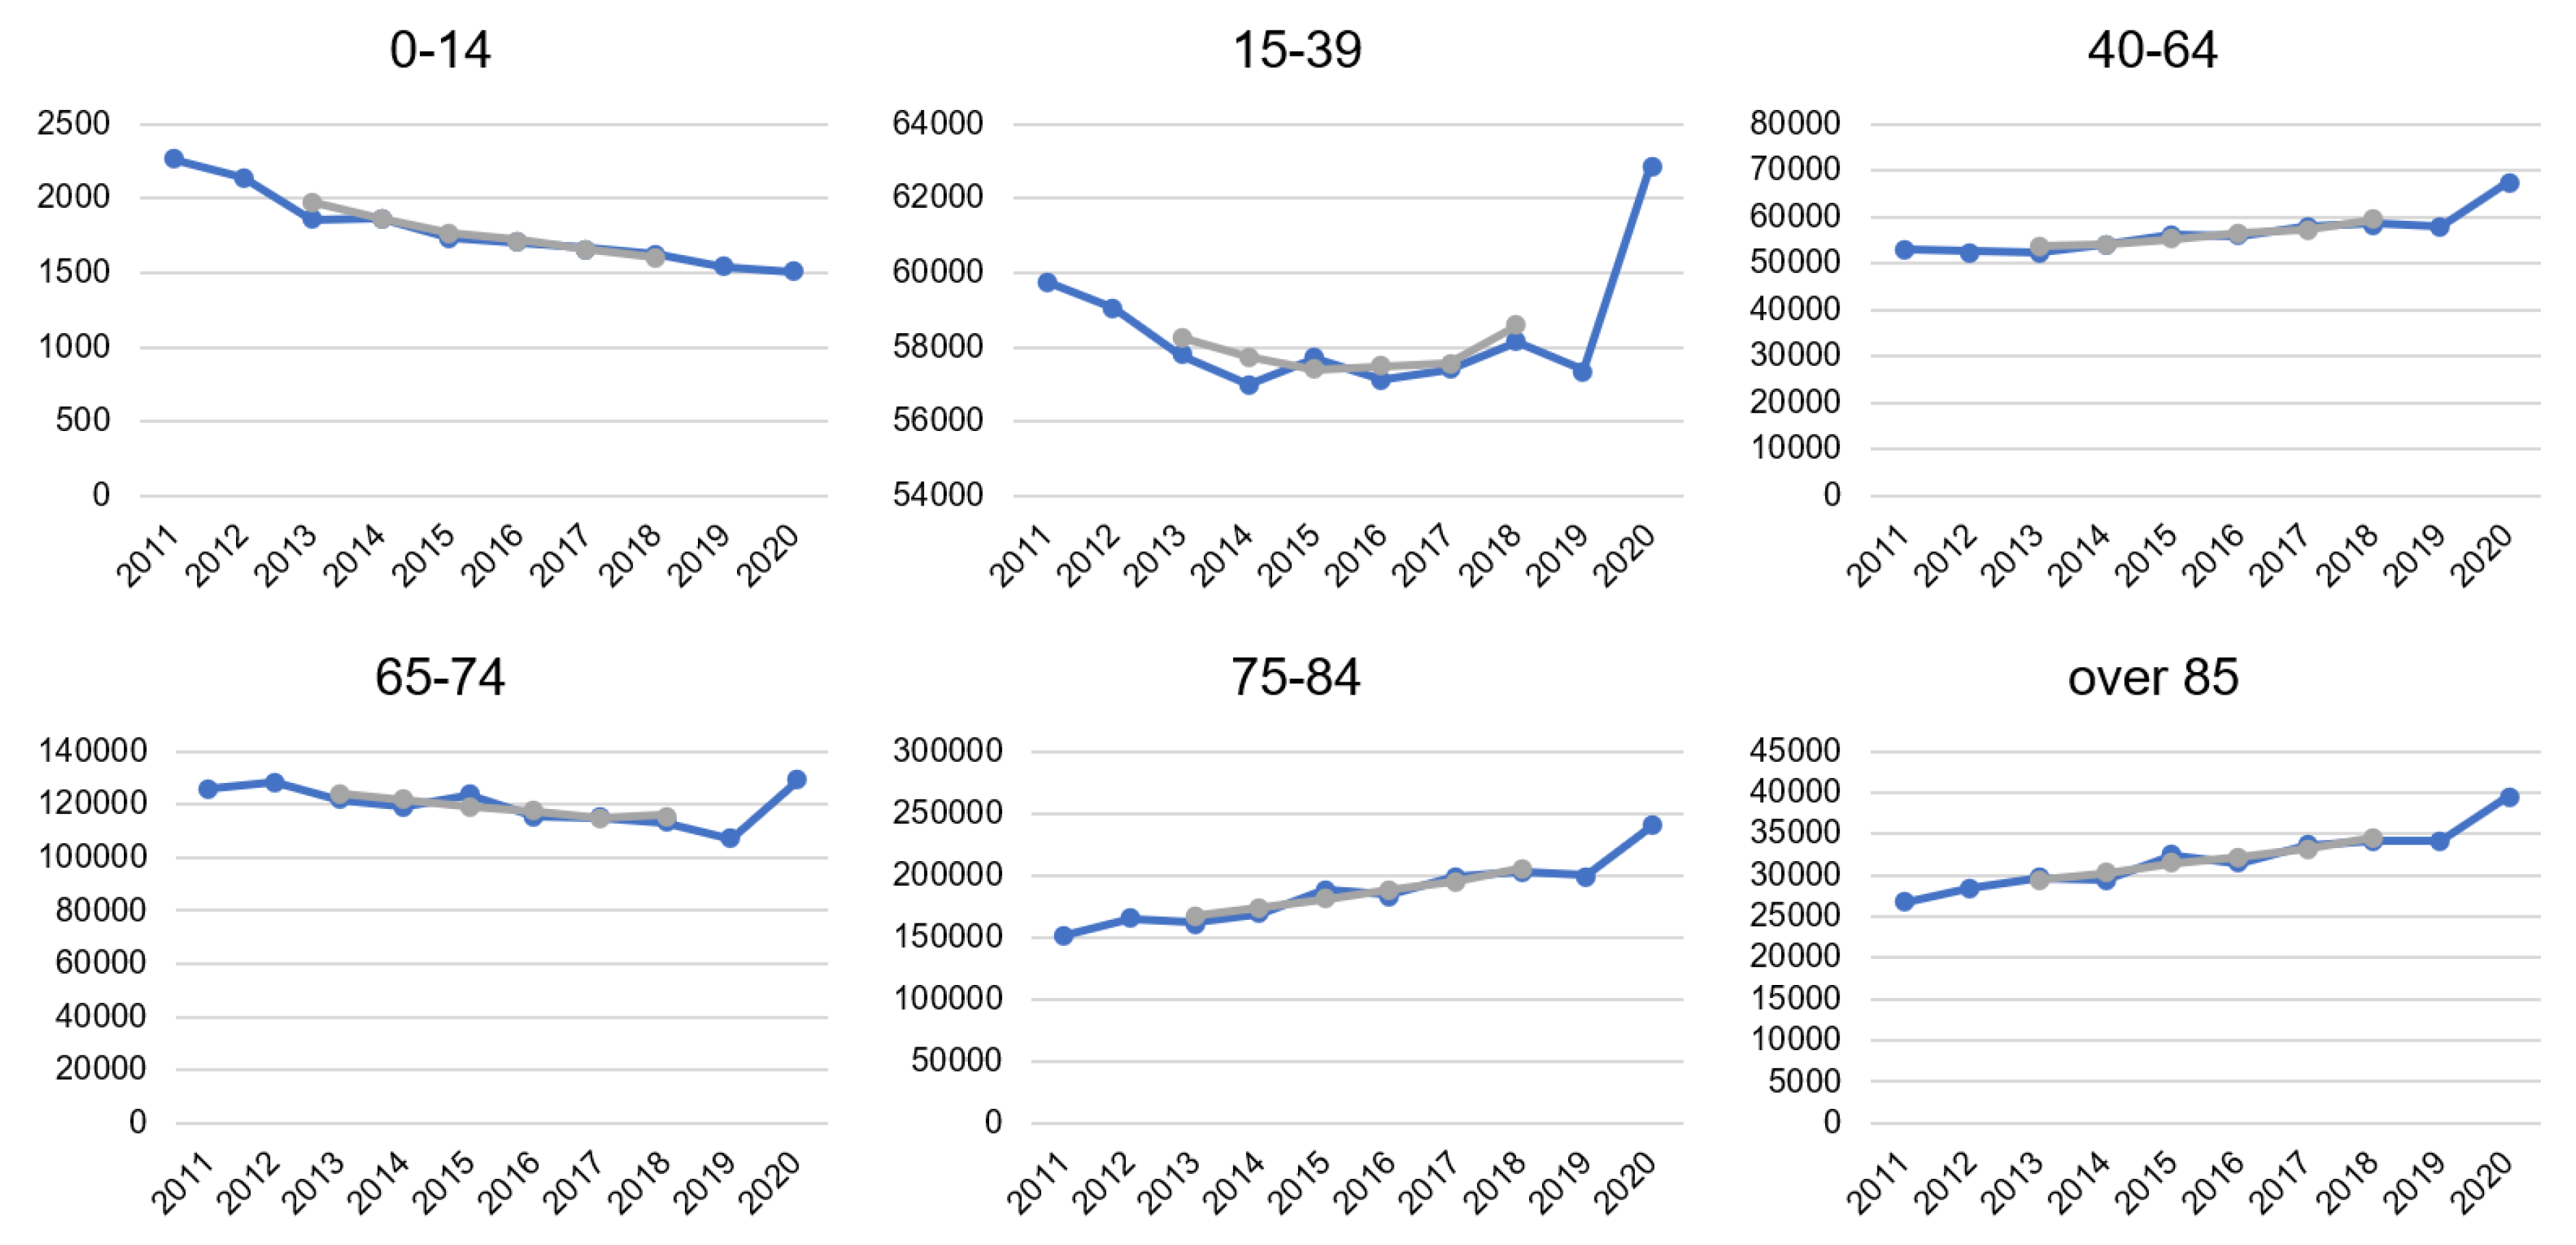
Figure 3 (CR) and
Figure 4 (Spain), we can clearly see that the COVID-19 pandemic impacted mortality rates. Especially in higher age groups, the increase in the number of deaths is visible. It goes against the trend of decreasing or stagnating mortality. In certain cases, the trend even rapidly changed, due to COVID-19. This was a striking change in Spain in the age category 15 to 39 years. For example, while there were decreasing on average 1,103 of people every week in 2019, it was on average 1187 per week in 2020. Only in age between 0 to 14 years, the number of deaths decreased in line with the long-term trend. So far, the youngest people have stayed reasonably safe from COVID-19, but the situation is changing, and mutation of coronavirus also younger categories can be endangered.
In the Czech Republic, there had been an increasing trend of mortality in age categories over 85 and 65–74 already, but in 2020, the increase is more pronounced. While in the age category 75–84 years, there was rather a stagnation in mortality during the observed period, 2020 meant a significant change in the direction to higher mortality. In 2020 a decreasing trend of death in the group 40–64 was broken. In age categories up to 39 years, the number of deaths decreased recently, and even 2020 was not an exception.
Because of the clear difference in mortality patter between 2019 and 2020 we use two basic periods of different length and estimate two predictions of different length. For every population there is: (1) Forecast A used data from 1981 to 2019 (
t = 1, …, 39) and is elaborated for 2020 to 2030 (
h = 1, …, 11), and (2) forecast B used data from 1981 to 2020 (
t = 1, …, 40) and is elaborated for 2021 to 2030 (
h = 1, …, 10). Both projections are compared by mean squared differences (MSD)—differences between values of two projections that are squared and divided by the length of the projection period (
H).
where
is the value of mortality rate in time
t projected by forecast
A and
by forecast B. The higher is the difference between forecasts, the more COVID-19 pandemic is pronounced and distorts the forecasts. We expect that this will happen, especially for higher ages.
2.2. Methods
This paper aims to model the mortality in the Czech Republic and Spain and assess the possible impact of the COVID-19 on the forecasts. The research brings the discussion about the impact of SARS-Cov-2 on demographic forecasting. Mortality, as one of the demographic processes, is an important part of demographic projections that have a wide impact on policy formulation in every developed country.
Mortality modeling can be based on deterministic or stochastic models. However, currently, more precious stochastic models are rather used than deterministic. We apply the Lee–Carter method that uses the trends and main components of previous development of demographic events.
The level of mortality of younger persons is different in comparison with the oldest, and therefore, it is necessary to correct estimates of mortality at the highest ages, e.g., by Coale–Kisker model, Thatcher model, Kanistö model, or Gompertz–Makeham function (see Boleslawski and Tabeau [
12]). Dotlačilová and Šimpach [
13] used polynomial functions of the 2nd and 3rd order on the data of Czech and Slovak mortality and concluded that it provided good smoothing in the age from 60 to 80, but have ambivalent results at the ages over 80 years. We expect that due to the SARS-Cov-2 pandemic, the mortality in the highest ages will be affected, and the possible forecast could be distorted, especially in those ages. Thus, there might be a need for correction.
Lee and Carter [
14] proposed a “method for modeling and forecasting mortality: A model of age-specific death rates with a time component and a fixed relative age component, and a time series model (an autoregressive integrated moving average—ARIMA) of the time component.” (Booth, Maindonald, and Smith [
15]) (Diaz-Rojo, Debon, and Mosquera [
9]). They defined their model to fit the matrix of mortality rates as (3):
where
is the central mortality rate in age
x and year
t;
and
are the age-specific constants;
is the age specific term which represents the general mortality shape across age;
is time-varying index of the level of mortality for all ages. “The
profile tells us which rates decline rapidly and which rates decline slowly in response to changes in
k ” (Lee and Carter [
14]). The coefficient can be negative for some ages, which indicates that mortality at those ages tends to rise when mortality in other ages is falling. Error term
ex,t ≈ N(0,
σ2) captures age-specific historical influences not captured by the model and is supposed to be homoscedastic. “As the model written in this way is over parametrized, the two additional constraints are introduced in order to identify the model.” (Danesi, Haberman, Millossovich [
16]):
and
. Using these constrains, the least squares estimator for
can be obtained by (4):
Under this normalization, is the proportion of the change in overall log mortality attributable to age x.
Several advantages of the Lee–Carter model are claimed: “[A] parsimonious demographic model is combined with standard statistical time-series methods; no subjective judgements are involved; forecasting is based on persistent long-term trends; and probabilistic confidence intervals are provided for the forecasts” (Lee and Carter [
14]). ARIMA models are used to forecast
and the order of lags is determined based on recommendation by Akaike information criterion. Because the base model estimates the logarithms of rates, thus giving equal weight to ratios of rates, each
was adjusted to reproduce annual total deaths (
Dt), while
ax and
bx stayed unchanged. This adjustment gives greater weight to the ages at which the numbers of deaths are large. Booth, Maindonald, and Smith [
15] modified the method to adjust the time component to reproduce the age distribution of deaths, rather than total deaths, and to determine the optimal fitting period to address non-linearity in the time component.
We used the original Lee–Carter model to elaborate the forecast for the period of 2020 to 2030 (forecast A) and 2021 to 2030 (forecast B). The results were compared according to (2). The model was programmed and fitted in software R, and other calculations were done in MS Excel.
3. Results
We present results only for the total population as the data for males and females did not bring meaningful results when they were used for forecasting in model B. It was probably because recalculated data was used. We suppose that 1-year group-specific data are needed to get robust results.
For the Czech Republic, in model A, parameter k was estimated by ARIMA(1,1,0) and model B by ARIMA(0,1,0) to predict the level of mortality. In Spain, model A estimated k by ARIMA(1,1,0) and model B by ARIMA(1,1,1). The models were selected based on common model selection criteria.
We looked at the average squared differences between forecasts A and B at each age. The differences were relatively low in ages from 1 to 50 in total population in both observed countries. This means that in those ages, adding 2020 to the projection did not bring significant distortion in projections.
No significant distortion is also present in the data for 0-year children in the CR, but in the case of Spain, there is a higher difference. Between years 50 to 90, the mean square difference is still low in the CR, while in raises rapidly in Spain. The results for Spain support our assumption that in higher ages, the forecasts A and B would report higher differences, due to the COVID-19 pandemic.
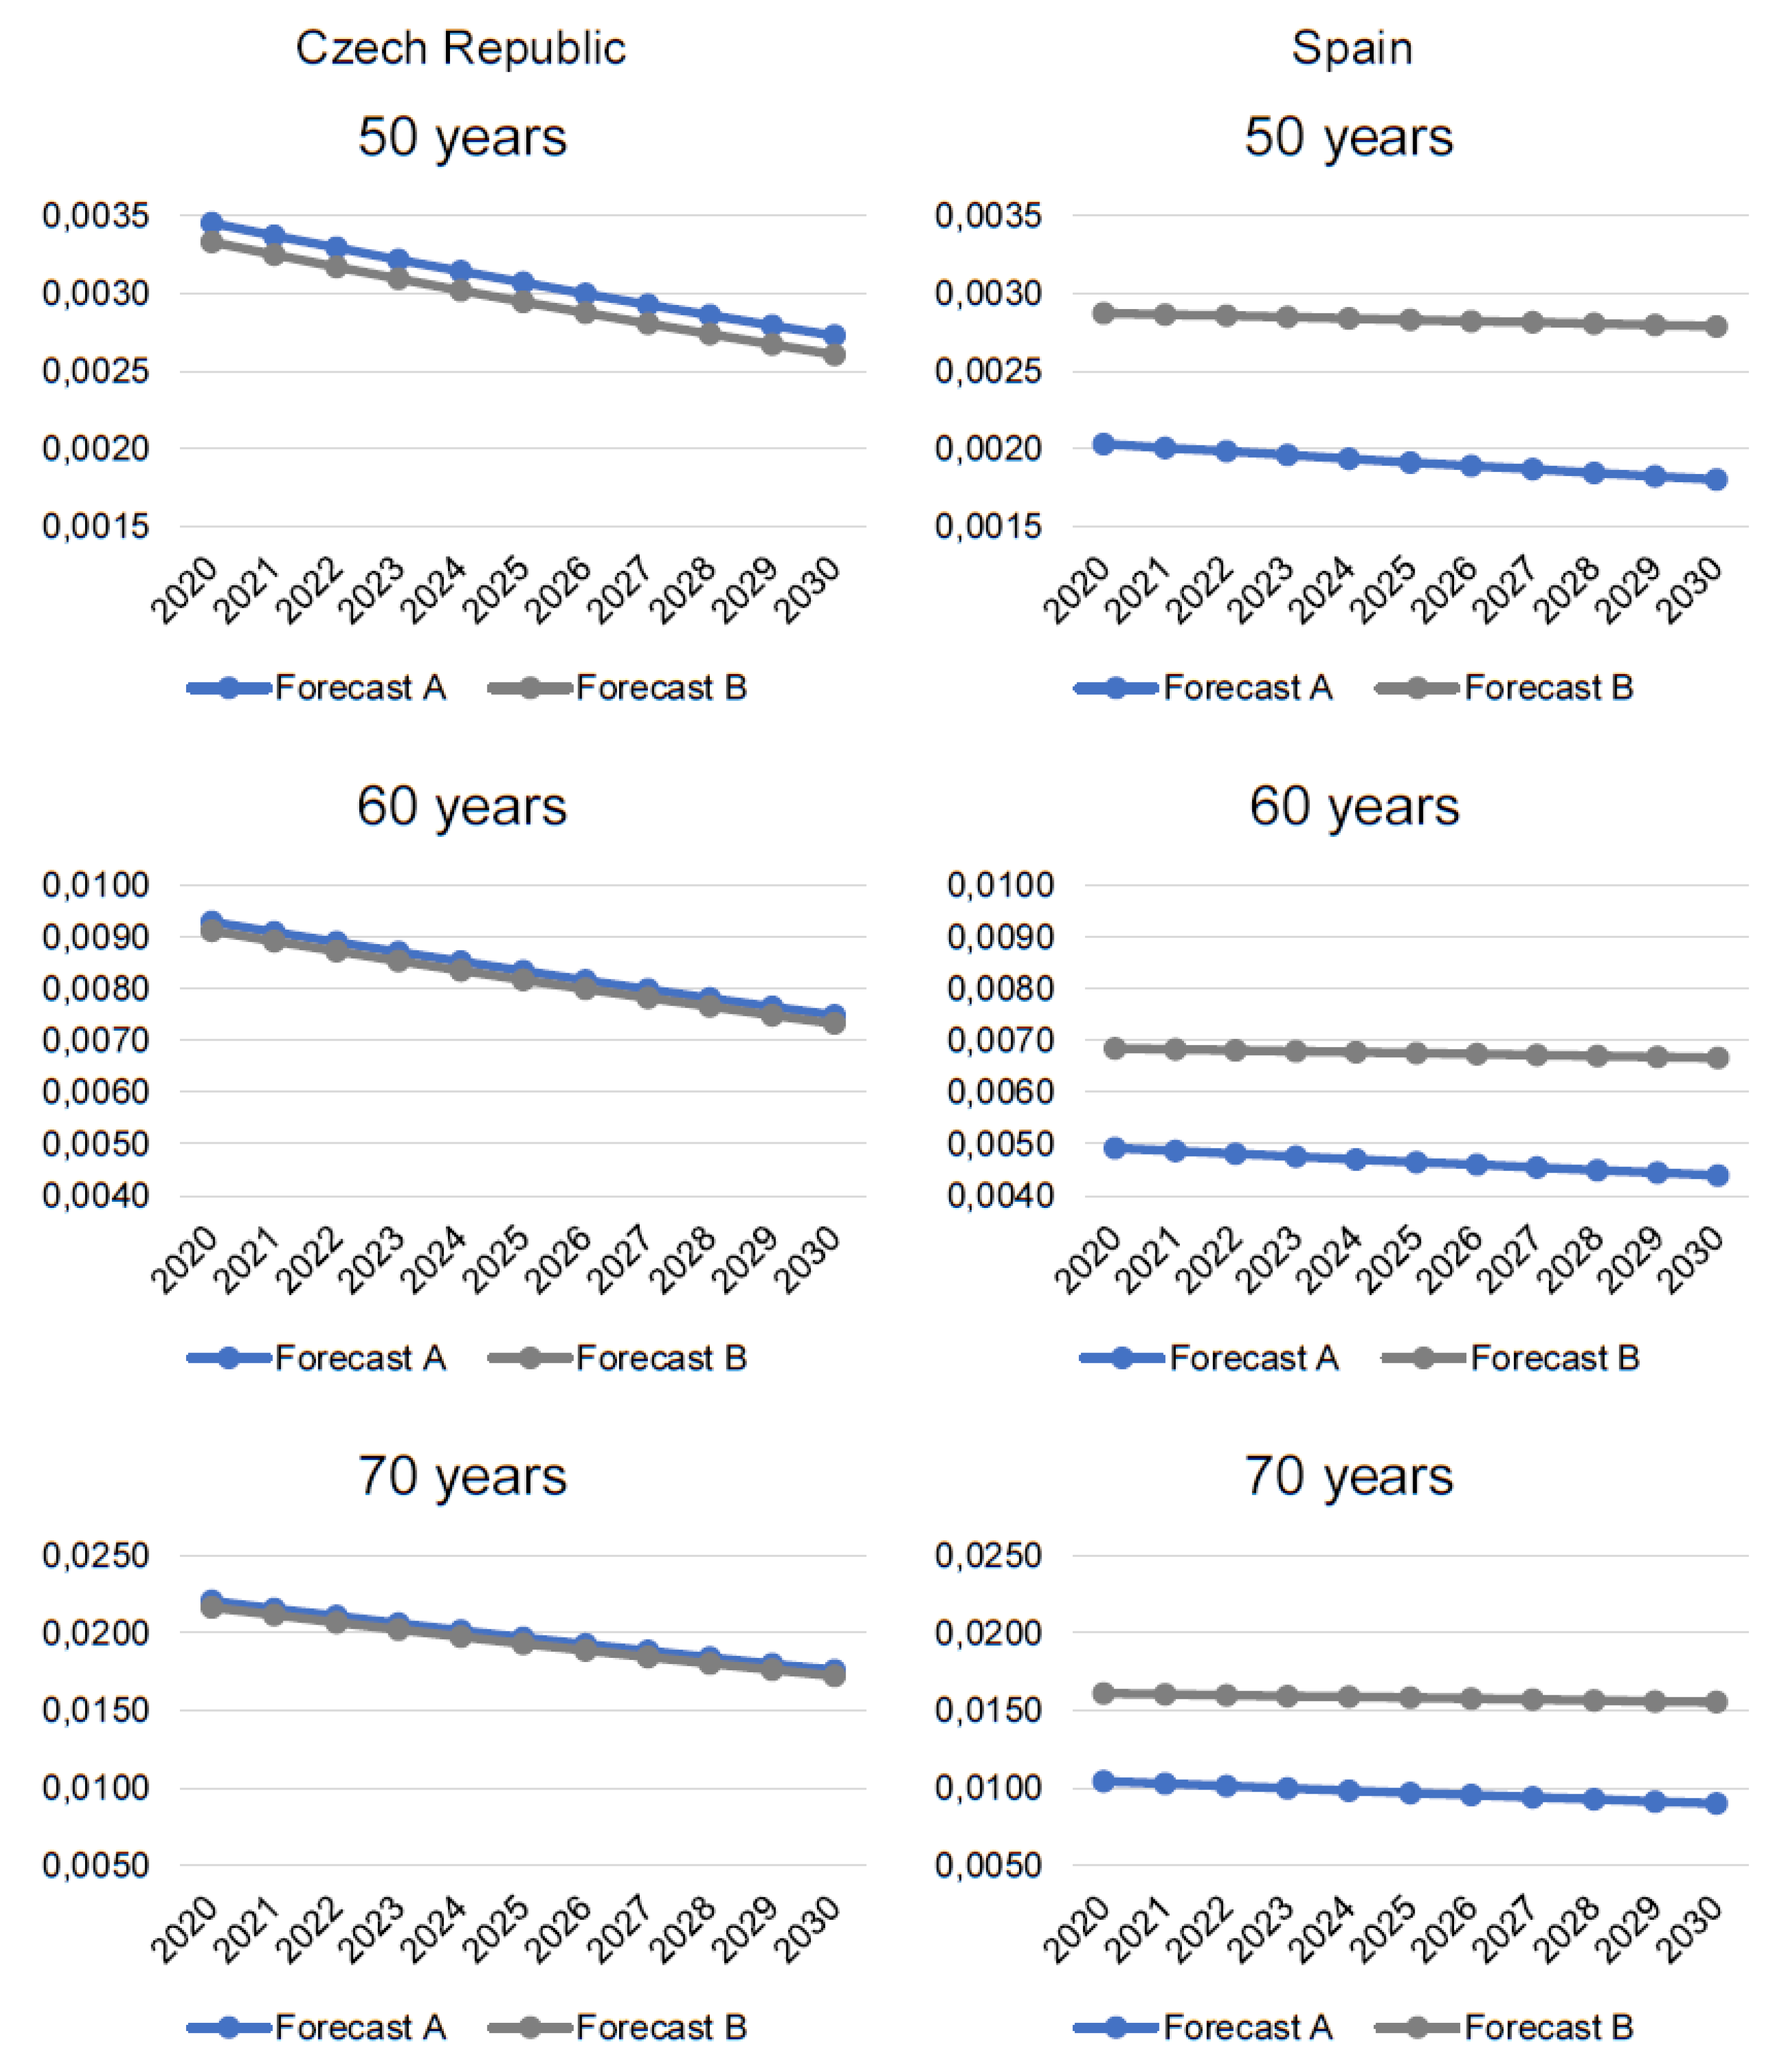
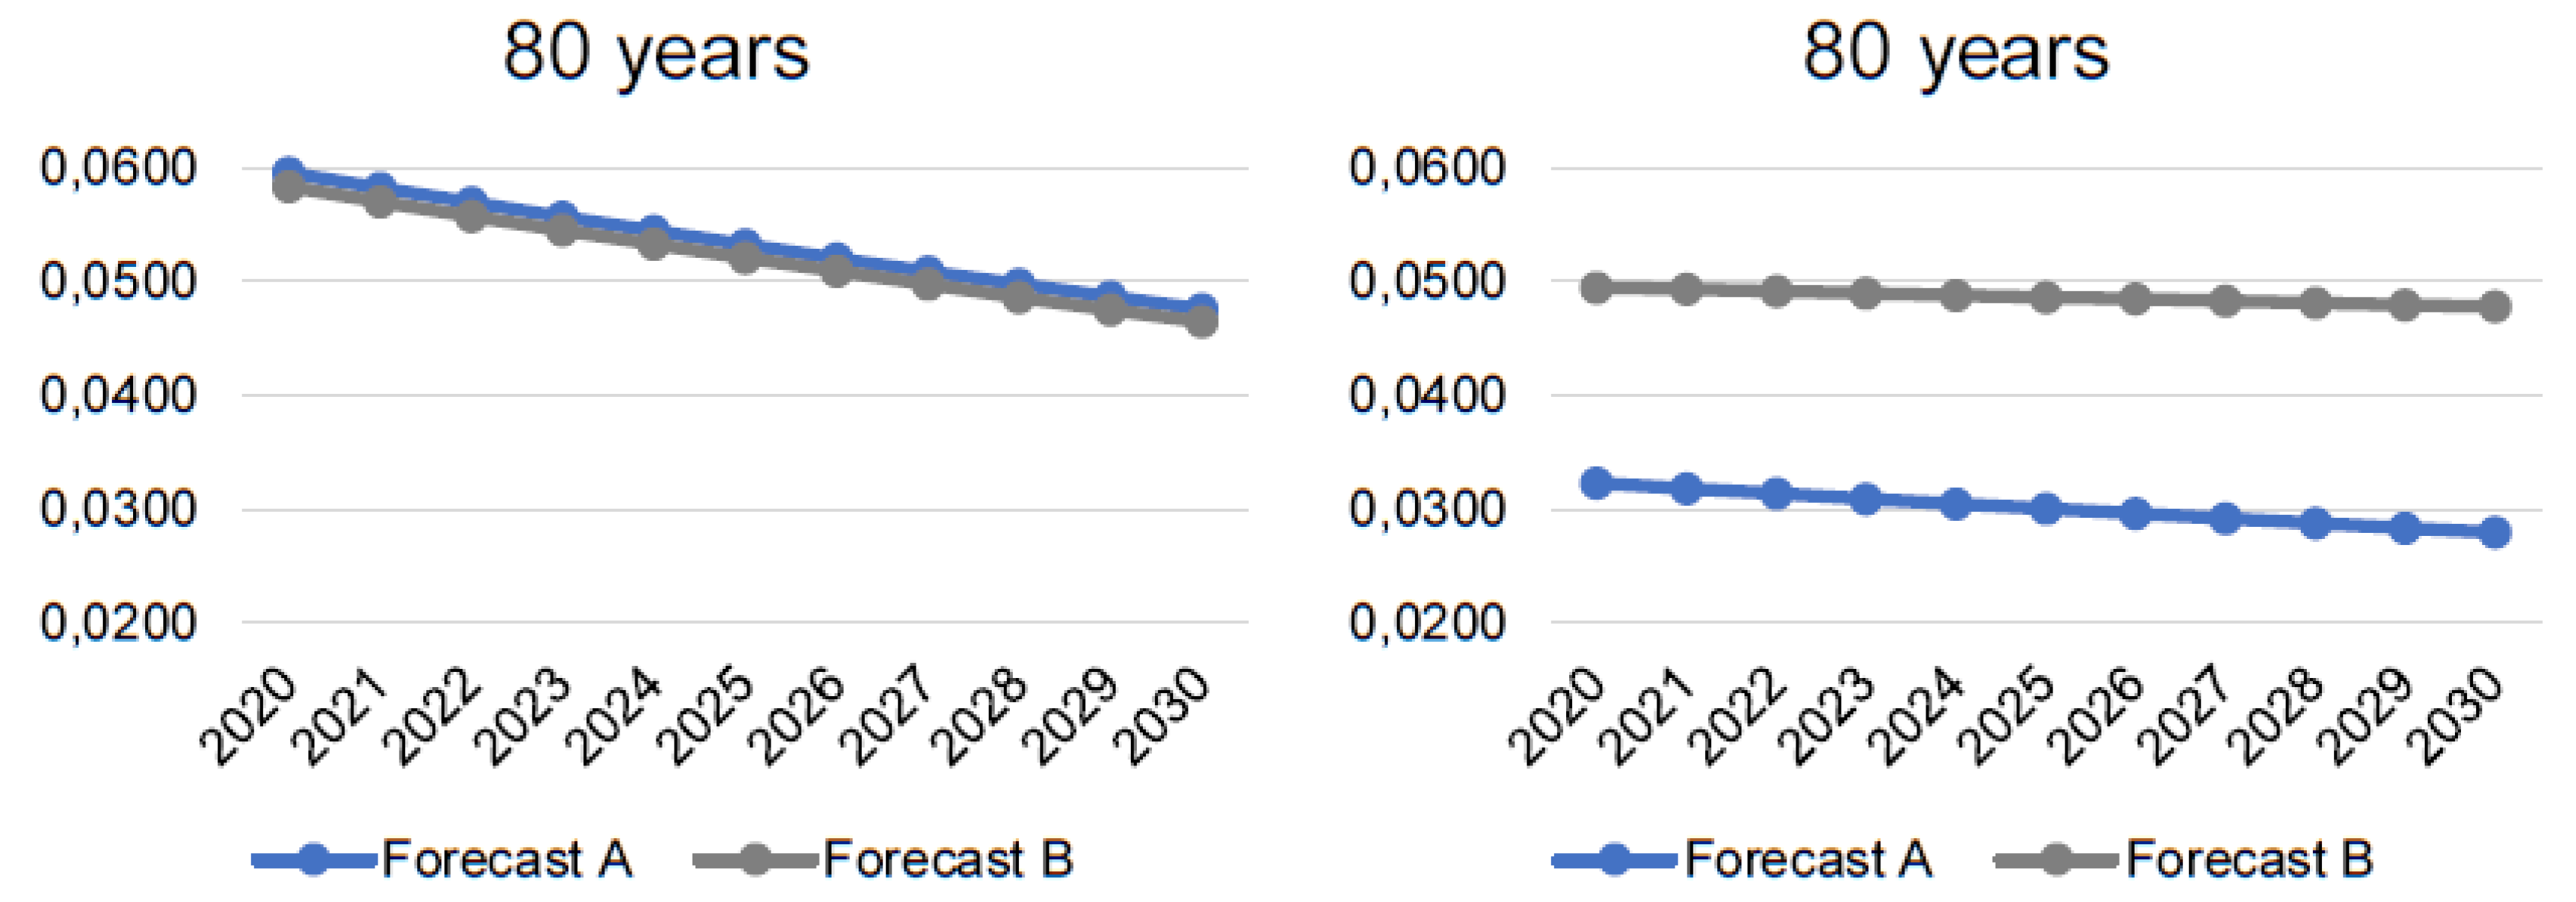
As an example of the results, we reported the forecasted mortality data for 50, 60, 70, and 80-years-old people because higher ages are more affected, and the differences in forecasts A and B increase after the age of 50. The results are displayed in
Figure 5.
Results for the CR are surprising as mortality rates in forecast B are lower than in forecast A. However, the differences are not that significant, and the lines look like parallels. We suppose that it is due to the nature of the data. The population of the CR is relatively small, and the time series is relatively short for forecasting. Besides, the history and living conditions also can play a role. In the CR, since the 1990s, after the end of the communist era, the increase of living standards caused that the mortality rates started to decrease.
This trend is still very strong and rooted in the data. Therefore, despite the COVID-19 pandemic, the mortality rates are still decreasing, and adding 2020 does not change much. Hence, forecast B—i.e., after adding 2020 predicts still lower death rates, than forecast A.
Results for Spain support our assumption. It can be clearly seen that forecast B predicts higher death rates than forecast A. Despite that both projections suggest a decrease, it is milder when 2020 is considered. Hence, the COVID-19 pandemic could influence the decreasing trend of mortality rates negatively. Not only that the death rates are higher, but they are also decreasing at a slower pace.
We also must consider that Spain was hit by COVID-19 already in April 2020, while the CR is suffering heavily only since the end of 2020. Thus, the way the epidemic increasingly influenced how the predictions were affected. Mortality increased rapidly in 2020 in Spain, while in the CR, the differences were not that significant yet. We suppose that in 2021 mortality rates in the CR would be significantly higher, and the mortality forecasts would be affected more.
4. Discussion and Conclusions
Mortality forecasting in the current situation can be disturbed, due to the worldwide SARS-Cov-2pandemic. Because the COVID-19 virus is relatively new, and there are still not available data about age-and-sex specific mortality rates, it is difficult to forecast the consequences and impact of the pandemic on mortality forecasting.
Besides, mortality related to COVID-19 is not caused only by the illness itself, but also due to other psychological issues. Research by Yusuf and Tisler [
17] forecasted 388 additional deaths a week in the Netherlands in five years, due to the direct and indirect effects of the lockdown measures. Therefore, they urge that “the additional mortality and increased mental health problem should be considered in evaluating the necessity of lock down and quarantine policy” Yusuf and Tisler [
17].
The main problem is that the age-and-sex specific data are not available for 1-year age groups. Only data that are currently obtainable are a weekly number of deaths for large (and not equally length) age groups. The data are divided between males and females, but using them for forecast B created a large bias from forecast A and from expectations. Only forecasts for the total population (especially in CR) were meaningful.
Another problem is that we do not have any information about the mid-year population of 2020, and it can be calculated only from the projection of population in 2021 as the arithmetic mean of those two years. However, any population projection for 2021 without taking the pandemic into account is biased. No institution expected that the mortality rates would increase and developed “higher mortality” scenario, e.g., lower fertility, lower mortality, lower/higher migration. Therefore, the recalculation to one-year mortality rates in 2020 can be inaccurate, so we used data as of 1 January 2020.
Besides, the mortality rates are also influenced by state policy and politicians who try to slow down the pandemic and reduce the number of deaths. Gerli et al. [
3] identified a homogeneous distribution of deaths and found a median of 24 days after lockdown adoption to reach the maximum daily deaths. No correlation between lockdown rigidity and population density was observed.
We are aware of the limitations of our results, but consider this topic that important to discuss and draw the path of our future research. We think that it was useful to present at least preliminary results to further elaborate on the topic. We plan to recalculate the model with real data as soon as possible. We believe that using real age-and-sex specific data in 1-year age groups (number of deaths, number of inhabitants, or direct mortality rates) can bring interesting results that will confirm our preliminary results presented in this paper.
Thus far, we can proclaim that the COVID-19 pandemic can affect the mortality rates so that they would be higher and would decrease at a slower pace in higher ages. This can already be the situation in some countries, but in some other countries, this can happen later when the number of deaths (not only due to COVID-19, but altogether) increases significantly. Nevertheless, we must verify our preliminary results on real data when they are available.


