Abstract
The contact sponge method is applied on a piece of clay brick. According to the standard,
the sponge is moistened with water, applied on the surface of the material by means of a cup, and
weighted before and after the application. It allows us to determine the amount of water absorbed
by the porous material by unit area and unit time. After the application, the moistened area begins
to evaporate and cool down. The IR camera is used to monitor the temperature variation of the
imprint of the sponge. Meanwhile, moisture diffuses on the material as well. The IR camera is used
to monitor the in-plane diffusion of moisture by following the imprint of the sponge that enlarges
with time. A suitable model is used to evaluate the shape of the imprint that varies with time.
1. Introduction
InfraRed Thermography (IRT) is one of the preferred instruments for the qualitative monitoring of humidity in buildings. The use of IRT for such tasks has been reported since the 1980s [1,2]. Because of the high latent heat that characterizes the phase change from liquid to vapor (>2 MJ·kg), the evaporation of water from the surface of a porous materials (bricks, stones, plasters, etc.) takes a considerable amount of heat, with a consequent decreasing of the surface temperature. IRT can easily identity such a decreasing phenomenon thanks to its imaging capability, and without any contact. Despite such apparently easy monitoring, attempts to make IRT a quantitative instrument for humidity evaluation have not succeeded up to now. On the other hand, a reliable instrument for this task is yet to come [3,4]. The solution of the coupled problem of heat and mass transfer, connected with the simultaneous diffusion of water and heat (the latter being the consequence of the perturbation generated by the evaporation), is of the highest difficulty. Some partial, simplified approaches have been proposed in the past. One of them considers the effect of water that penetrates into the pores of the material by the increasing of its effective thermal inertia. To test this change in the thermophysical properties, an active thermography approach is used [5,6]. Other techniques have been proposed to enhance the evaporation effect in such a way as to make the presence of water more evident. This is performed, e.g., by a controlled forced ventilation [7]. Another procedure considers a reference area, representing extreme evaporative conditions. The first is prepared by moistening at the saturation level, while the second is covered with a plastic film to inhibit any evaporation. Any other zone is referred to by those limit conditions [8]. Finally, considering the band of TeraHertz, new techniques to identify and quantify humidity content in porous materials are gaining interest [9]. Recently, the contact sponge method [10,11] was proposed. Its easy applicability in situ is attracting the attention of restorers more and more [12,13]. It consists of applying a humid sponge to the surface of a material in a controlled way. Ludwig et al. [14,15] proposed to apply IRT to monitor the localized decrease in temperature, due to the evaporation of water released by the contact sponge. In the present work, a model is applied to interpret the sequence of IR images collected during the experiment. The outcomes can be connected and related to the permeability and porosity of the material under test.
2. Modeling
The contact sponge method is based on very simple and cheap instrumentation: one plastic cup, one sponge, a balance, and demineralized water. First, the sponge is weighted after being placed deeply in the water. Then, it is introduced into the cup and pressed manually on the material under test. The thickness of the sponge is slightly greater that the cup. Typically, the cup is a cylinder, closed on top, with diameter of around 6 cm and height 1 cm. The sponge has same diameter and a slightly higher height (let us say a couple of millimeters more). The cup, with the humid sponge inside, is pressed on the material. This action, which is reproducible, squeezes the sponge, releasing water on the surface. After a predefined amount of time (e.g., one minute), the sponge is removed. The amount of water absorbed by the surface of the material is given by weighting the sponge again, after the application. The following equation gives the amount of water absorbed by the porous material per unit surface and unit time:
where is the water absorbed per unit area and unit time, and are initial and final weights of the sponge, respectively, A is the area of the sponge, and is the time of contact between the sponge and the material.
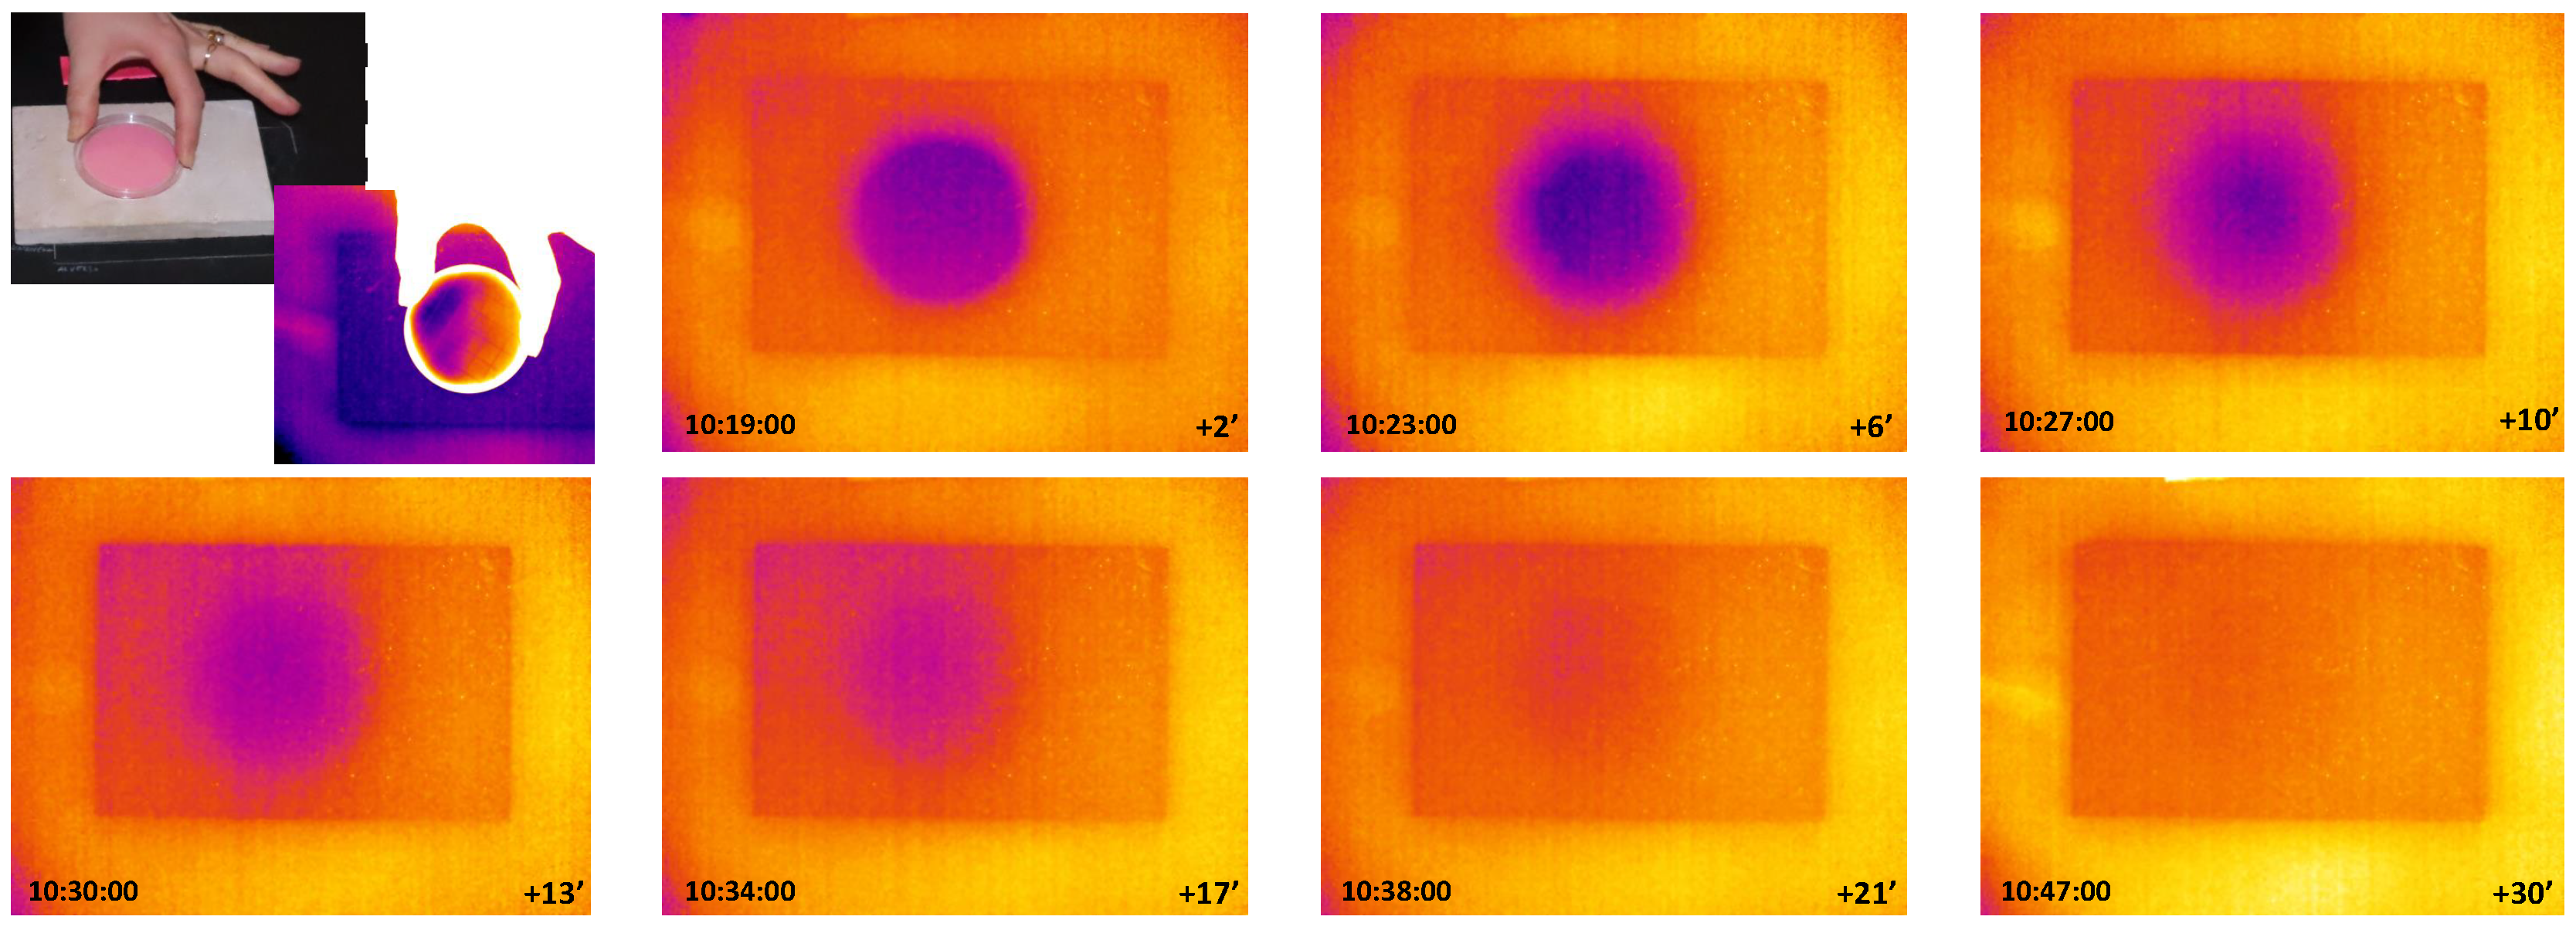
After the sponge removal, IRT can monitor the surface of the specimen. In correspondence of the area where the sponge was applied, a decrease in temperature is clearly visible due to the strong evaporation effect. Moreover, the diffusion of water through the pores of the material (eventually coupled with the heat conduction as a consequence of the heat sink due to the evaporation) can be monitored by collecting a sequence of IR images (see Figure 1).

Figure 1.
The application of the contact sponge (top-left) and some IR images at successive time intervals.
The differential equation that describes the diffusion process is similar for heat conduction and water diffusion, from the mathematical point of view. Temperature or heat flux distribution, in space and time, are the solutions of the heat conduction equation, while mass flow is the solution of the water diffusion equation. Therefore, we propose to apply solutions available for the heat conduction to solve the water diffusion problem. For example, to estimate thermal diffusivity one can use the method introduced by Philippi et al. [16]. Here, the method proposed by Cernuschi [17] is followed: an increase in the radius of the humid zone imprint, which appears in the IR image as a lower temperature, is measured in time. Water diffusivity is supposed to be the slope of the square of the radius of the circular zone, which is a linear function of time, as in the following equation:
where is the amplitude of the Gaussian function depending on time t, x and y are spatial coordinates, is the radius of the imprint (radius of the sponge) at time , and is the diffusivity of water to be estimated. Figure 2 shows, on the left, the fitting of Equation (2) with the data, and on the right, the fitting of the square of the radius as a function of time, with the slope representing .
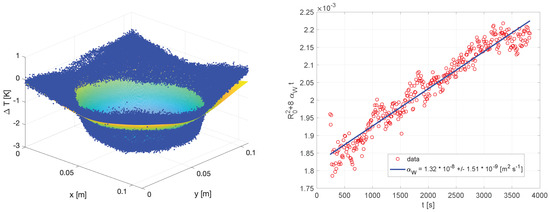
Figure 2.
On the left, the fitting of Equation (2) with the temperature data; on the right, the fitting of the square of the radius of the humid zone imprint, increasing with time. The slope is .
3. Results
Two tests were performed, at an interval of one month, on two different clay bricks extracted from an old building. Other two tests were performed (at the same time interval of one month) on three different new bricks that are currently used in buildings to imitate the characteristics of the old ones and conceived to replace the old in cases of refurbishment. Table 1 reports the results obtained from the different tests.

Table 1.
Water diffusivity results. Test runs #1 and #2 were carried out at a time interval of one month.
It is worth mentioning the thermophysical parameters typical of the materials used. They are reported in Table 2. Thermal conductivity was measured by Hot Disk TPS2500 apparatus, the specific heat by SETARAM MICROCALVET DSC, and the density by weight and volume ratio. It is noticeable that the thermal diffusivity is more than one order of magnitude greater than the water diffusivity. This allows us to state that the two phenomena work at different time scales and, therefore, they can be estimated separately. The values obtained in Table 1 for water diffusivity are compatible with those obtained by Pel and coauthors [18].
Table 2.
Thermal properties of the fired clay brick used in the experiment.
4. Conclusions
The adopted model seems to be able to follow the water diffusion in space. The results are consistent with the literature. The permeability of the material and information on its porosity will be connected to water diffusivity in future works. New experiments are planned on different porous materials.
Author Contributions
Conceptualization and methodology, M.V. and F.P.; software, P.B.; experiments, E.G., G.F. and G.C.; data curation, E.G. and M.G.; writing, review and editing, P.B. All authors have read and agreed to the published version of the manuscript.
Funding
This research received no external funding.
Institutional Review Board Statement
Not applicable.
Informed Consent Statement
Not applicable.
Data Availability Statement
Data are available on request from the corresponding author.
Conflicts of Interest
The authors declare no conflict of interest.
References
- Marshall, S.J. Detecting moisture in buildings using infrared thermography. In Thermal Infrared Sensing Applied to Energy Conservation in Building Envelopes: Thermosense III; Proc. SPIE 0254; SPIE: Bellingham, WA, USA, 1980. [Google Scholar] [CrossRef]
- Lyberg, M.D.; Mattsson, M.; Sundberg, J. Detection of moisture damage in buildings using thermography. In Thermosense XII: An International Conference on Thermal Sensing and Imaging Diagnostic Applications; Proc. SPIE 1313; SPIE: Bellingham, WA, USA, 1990. [Google Scholar] [CrossRef]
- Grinzato, E.; Ludwig, N.; Cadelano, G.; Bertucci, M.; Gargano, M.; Bison, P. Infrared thermography for moisture detection: A laboratory study and in-situ test. Mater. Eval. 2011, 69, 97–104. [Google Scholar]
- Bison, P.; Cadelano, G.; Capineri, L.; Capitani, D.; Casellato, U.; Faroldi, P.; Grinzato, E.; Ludwig, N.; Olmi, R.; Priori, S.; et al. Limits and advantages of different techniques for testing moisture content in masonry. Mater. Eval. 2011, 69, 111–116. [Google Scholar]
- Baggio, P.; Bison, P.G.; Bonacina, C.; Bressan, C.; Grinzato, E. Thermal inertia evaluation in porous material by multispectral optical analysis. In Proceedings of the XVIII I.I.R. International Congress, Montreal, QC, Canada, 10–17 August 1991; pp. 694–698. [Google Scholar]
- Bison, P.G.; Bressan, C.; Grinzato, E. Automatic equipment for water content measurement on porous materials by means of multispectral analysis. In Proceedings of the Workshop on Advanced Infrared Technology and Applications, CNR-IROE, Florence, Italy, 13–14 April 1992; pp. 375–386. [Google Scholar]
- Bison, P.; Cadelano, G.; Grinzato, E. Thermographic Signal Reconstruction with periodic temperature variation applied to moisture classification. Quant. Infrared Thermogr. J. 2011, 8, 221–238. [Google Scholar] [CrossRef]
- Tavukçuoğlu, A.; Grinzato, E. Determination of critical moisture content in porous materials by IR thermography. Quant. Infrared Thermogr. J. 2006, 3, 231–245. [Google Scholar] [CrossRef]
- Zhu, P.; Zhang, H.; Pivarčiová, E.; Sfarra, S.; Maldague, X. Characterization of water content and inspection of delamination in spruce, oak and meranti woods after pyrolysis processing using a new terahertz time-domain spectroscopy method. NDT E Int. 2023, 139, 102938. [Google Scholar] [CrossRef]
- UNI 11432:2011; Beni Culturali—Materiali Lapidei Naturali ed Artificiali—Misura della Capacità di Assorbimento di Acqua Mediante Spugna di Contatto. UNI: Milano, Italy, 2011.
- Pardini, C.; Tiano, P. Valutazione in situ dei trattamenti protettivi per il materiale lapideo, proposta di una nuova semplice metodologia. ARKOS 2004, 5, 30–36. [Google Scholar]
- Vandevoorde, D.; Pamplona, M.; Schalm, O.; Vanhellemont, Y.; Cnudde, V.; Verhaeven, E. Contact sponge method: Performance of a promising tool for measuring the initial water absorption. J. Cult. Herit. 2009, 10, 41–47. [Google Scholar] [CrossRef]
- Ribeiro, T.; Oliveira, D.V.; Bracci, S. The Use of Contact Sponge Method to Measure Water Absorption in Earthen Heritage Treated with Water Repellents. Int. J. Archit. Herit. 2020, 16, 85–96. [Google Scholar] [CrossRef]
- Ludwig, N.; Rosina, E.; Sansonetti, A. Evaluation and monitoring of water diffusion into stone porous materials bymeans of innovative IR thermography techniques. Measurement 2018, 118, 348–353. [Google Scholar] [CrossRef]
- Melada, J.; Arosio, P.; Gargano, M.; Ludwig, N. Automatic thermograms segmentation, preliminary insight into spilling drop test. Quant. Infrared Thermogr. J. 2023. [Google Scholar] [CrossRef]
- Philippi, I.; Batsale, J.C.; Maillet, D.; Degiovanni, A. Measurement of thermal diffusivities through processing of infrared images. Rev. Sci. Instruments 1995, 66, 182–192. [Google Scholar] [CrossRef]
- Cernuschi, F.; Russo, A.; Lorenzoni, L.; Figari, A. In plane thermal diffusivity evaluation by infrared thermography. Rev. Sci. Instruments 2001, 72, 3988–3995. [Google Scholar] [CrossRef]
- Pel, L.; Brocken, H.; Kopinga, K. Determination of moisture diffusivity in porous media using moisture concentration profiles. Int. J. Heat Mass Transf. 1996, 39, 1273–1280. [Google Scholar] [CrossRef]

Disclaimer/Publisher’s Note: The statements, opinions and data contained in all publications are solely those of the individual author(s) and contributor(s) and not of MDPI and/or the editor(s). MDPI and/or the editor(s) disclaim responsibility for any injury to people or property resulting from any ideas, methods, instructions or products referred to in the content. |
© 2023 by the authors. Licensee MDPI, Basel, Switzerland. This article is an open access article distributed under the terms and conditions of the Creative Commons Attribution (CC BY) license (https://creativecommons.org/licenses/by/4.0/).