Abstract
One of the main sources of damage to historical buildings is the presence of humidity. It is fundamental to develop a diagnosis protocol to identify the presence of water, evaluate the damage in a building (the whole structure, part of it or individual materials), assess its vulnerability and, finally, carry out a restoration plan. IR thermography is a sustainable method to guarantee structure analysis and preservation. Here, an application is presented, permitting us to identify the wet and dry areas and transition zone related to evaporation on the surface of the investigated materials. Thanks to temperature maps, it is possible to observe saturated regions, qualitatively at first and then quantitatively, processing the images by plotting reference lines/points and correlating surface temperatures with moisture.
1. Introduction
Infrared thermography (IRT) can investigate moisture content and identify related damage in buildings’ structures. When water soaks the masonry structure through the capillary networks of porous materials, the moisture content increases [1], bringing mechanical, physical and aesthetic problems [2]. IRT monitoring consists of assessing temperature gradients in thermal images at the time of analysis, summarizing the time sequence in a single graph or database that includes the most important information. Here, the considered method consists of a qualitative thermographic analysis (permitting wet and dry area identification) that follows a rising process until an equilibrium state is reached. Later on, it could evolve into a quantitative analysis that determines the real moisture content in the building [3,4,5,6,7,8]. This diagnosis involves testing directly in situ without damaging the masonry structure, preserving walls intact, which is especially advisable when the surfaces are decorated with stucco or frescoes. This work aims to analyze the strength of the IRT method for quantitatively estimating the moisture content and rising damp process in cultural heritage, beginning with a basic laboratory test.
2. Method
An IRT non-invasive method was used to investigate the rising damp phenomenon in masonry mock-ups (length 100 cm, height 120 cm, thickness 25 cm), consisting of traditional construction materials used in Venetian practice (Table 1). They were dipped in a tank containing water up to several centimeters at their bases, simulating ascent by imbibition, such as in a real environment. The ambient conditions were temperature 20 ± 3 °C and relative humidity 60 ± 15%.

Table 1.
Structure composition of laboratory mock-up.
IR images were collected every minute in the first hour of imbibition, every 10 min in the first 24 h and finally monthly, using an FLIR T1020 camera. Furthermore, to improve the thermal analysis, three types of thermal cameras were used to observe the differences between them, concerning the FOV, resolution and object temperature, at the same operating conditions and same moment of recording data: 0.95 emissivity, 18.5 °C reflected temperature, 18.5 °C indoor temperature, 66% relative humidity (at the time of analysis) and a 3.00 m distance. The IR cameras used are presented in Table 2 [9].
Table 2.
IRT camera technical specifications.
3. Results and Discussion
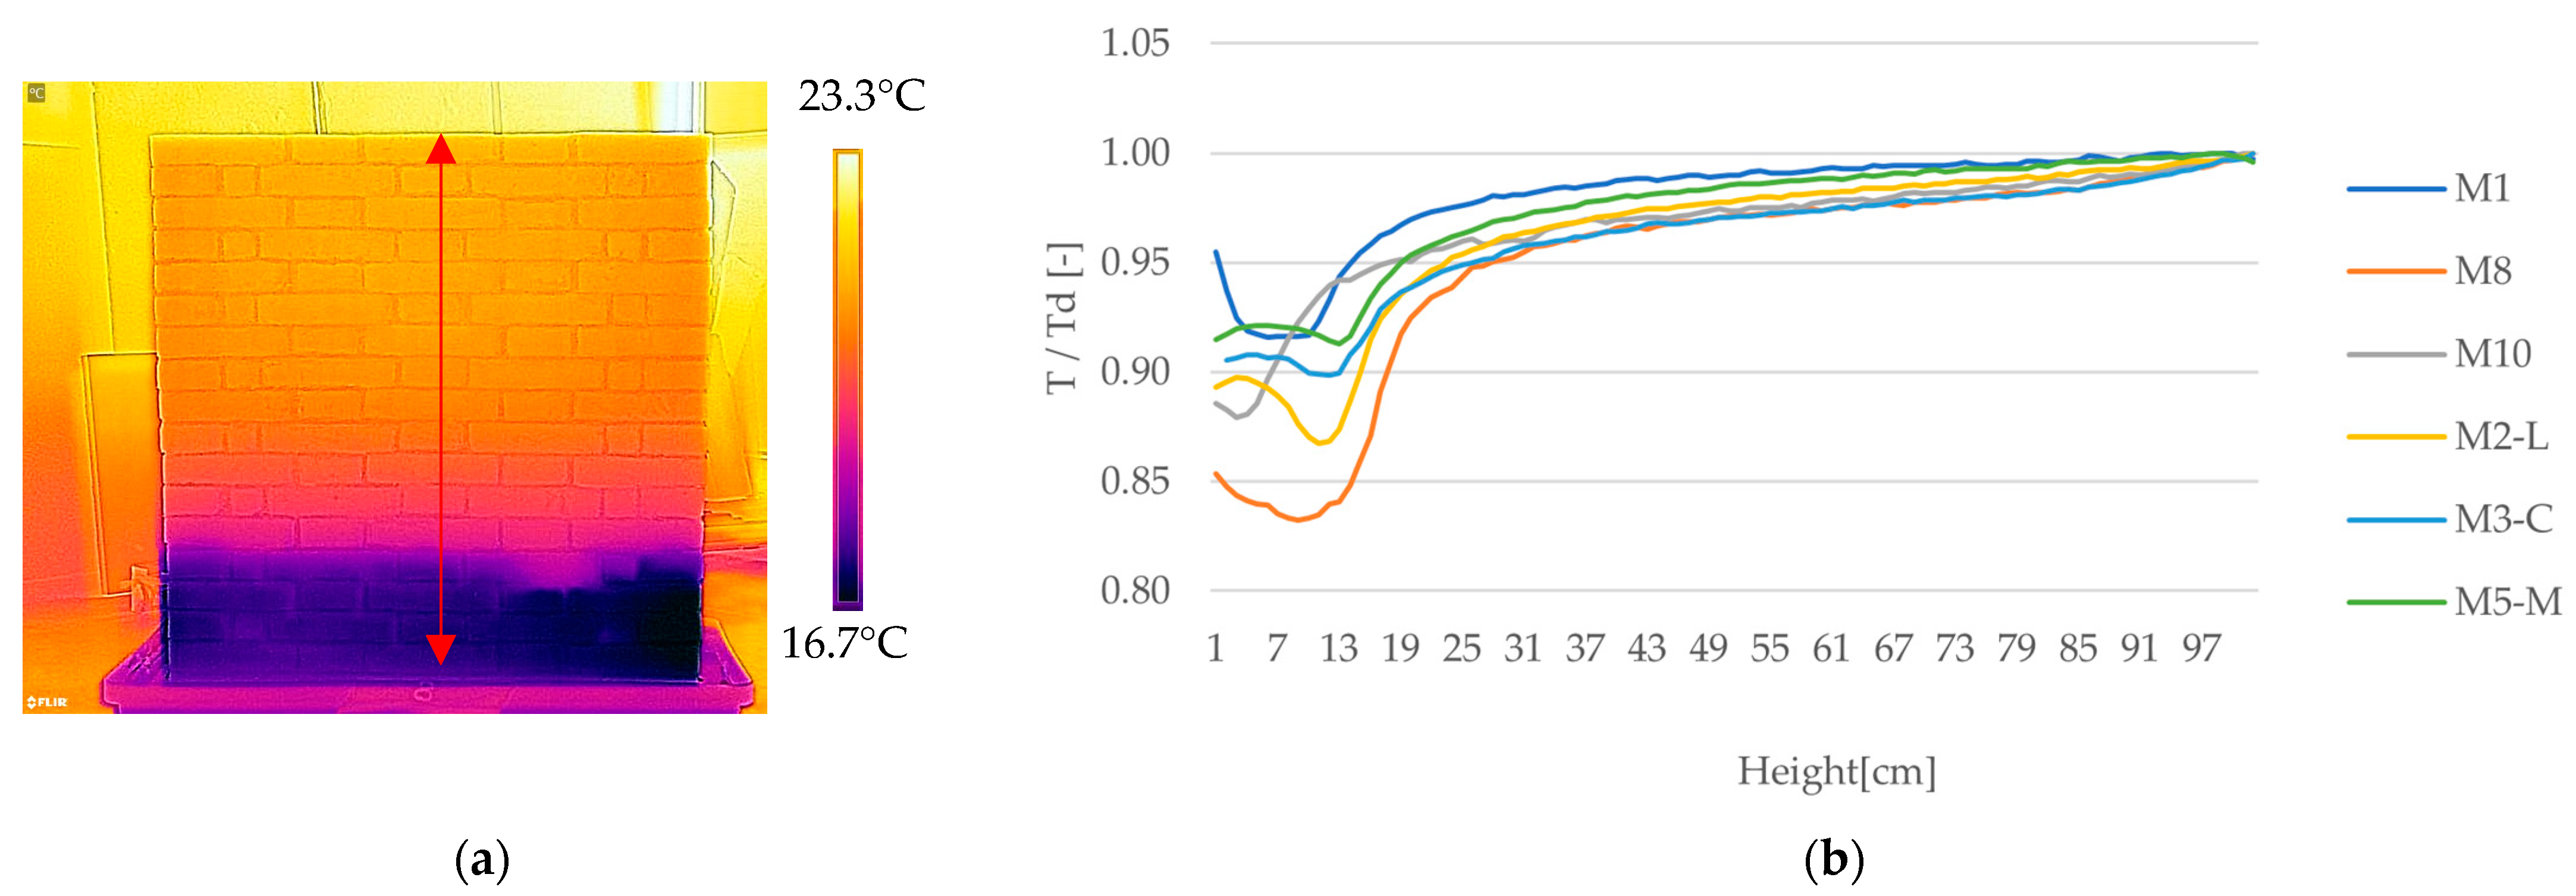
Thermal image processing consists in of a vertical temperature profile in the middle of the mock-up. The data show a rapid water level increase during the first 24 h of imbibition; then, the velocity decreases and the level reaches a steady condition, which depends on the material used in the structure. Figure 1 shows the rising damp level, considering the surface temperature (T) normalized by the dry temperature of the sample (Td). It can be seen that the trend of the curve is very similar to the RE (evaporation rate) and evaporative thermal index (ETI) curves identified by Tavukçuoğlu and Grinzato [3] in their studies on critical moisture content in porous materials. That work focuses on red brick, the same brick used in the mock-up analyzed here (M1/M8). All the mock-ups have a similar trend of rising damp, with small differences recorded: M1 shows a low level of rising damp up to ~10 cm; M8 a wet region up to ~13 cm; M10 a wet region up to ~4 cm and finally, M2-L, M3-C and M5-M (plastered masonry) show a higher wetting level of ~11–13 cm. The transition region between the wet and dry area extension depends on the building materials used and their hygroscopicity parameters, but over the 24 h imbibition period, it is almost the same within the mock-ups, of about 13 cm. M8 with traditional lime mortar shows a significantly higher level of rising damp than the mock-ups made with premixed mortar. Thus, it can be said that traditional mortar and plaster have superior hygroscopic properties, which facilitate the ascent of humidity. The mock-up with traditional recycled bricks (M10) shows a jagged waterfront with not-so-visible flexure points, but with a more linear upward trend resulting from the non-uniform nature of the bricks (components and firing process). It is also important to consider the boundary conditions: in this case, the laboratory experiment has limited fluctuation in temperature and relative humidity. Moreover, there are no influences of rain or solar radiation.

Figure 1.
Thermal image processing of mock-ups in laboratory to assess the rising damp level: (a) indication of vertical profile considered and (b) level of rising damp on mock-up, values after 24 h of imbibition.
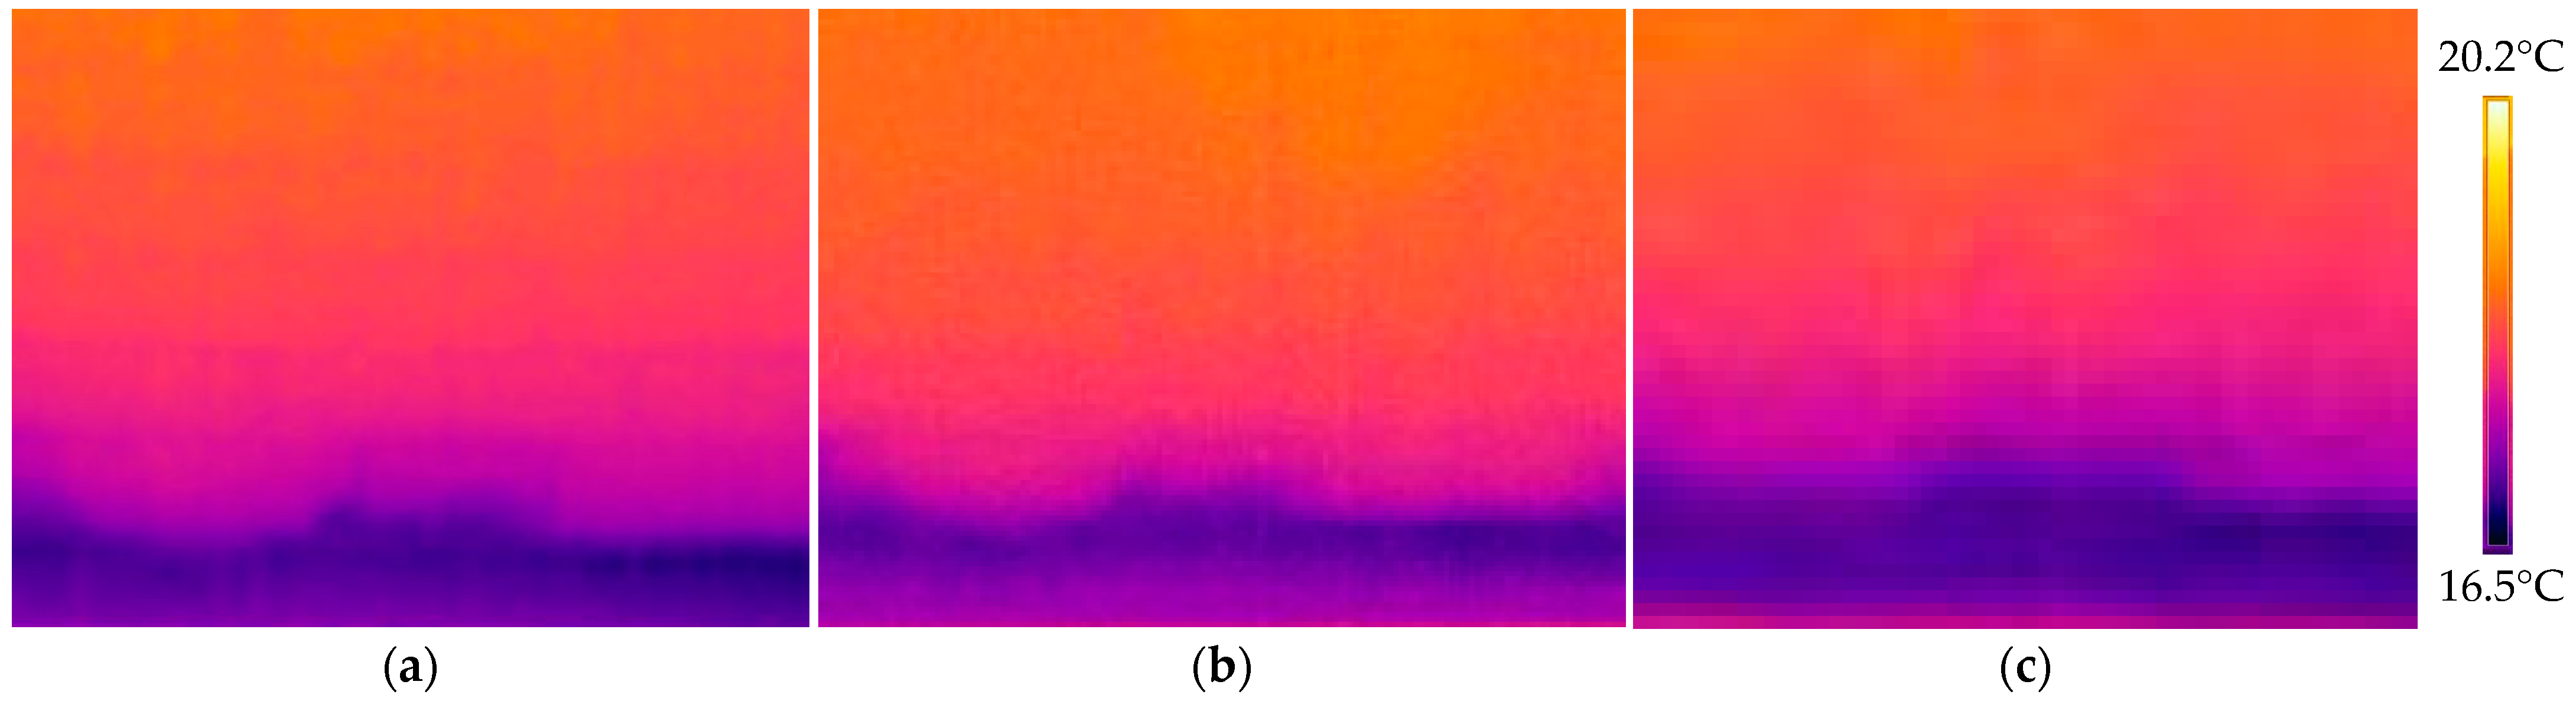
In the frame of the experimentation, three thermographic systems with different characteristics were utilized. The comparison of thermal images between various thermal imaging cameras (Figure 2) highlights how the technical specification could affect the quality of images and the results.

Figure 2.
Area of the M1 mock-up viewed using different cameras: (a) FLIR T1020, (b) FLIR SC660 Western, (c) FLIR B400 Western.
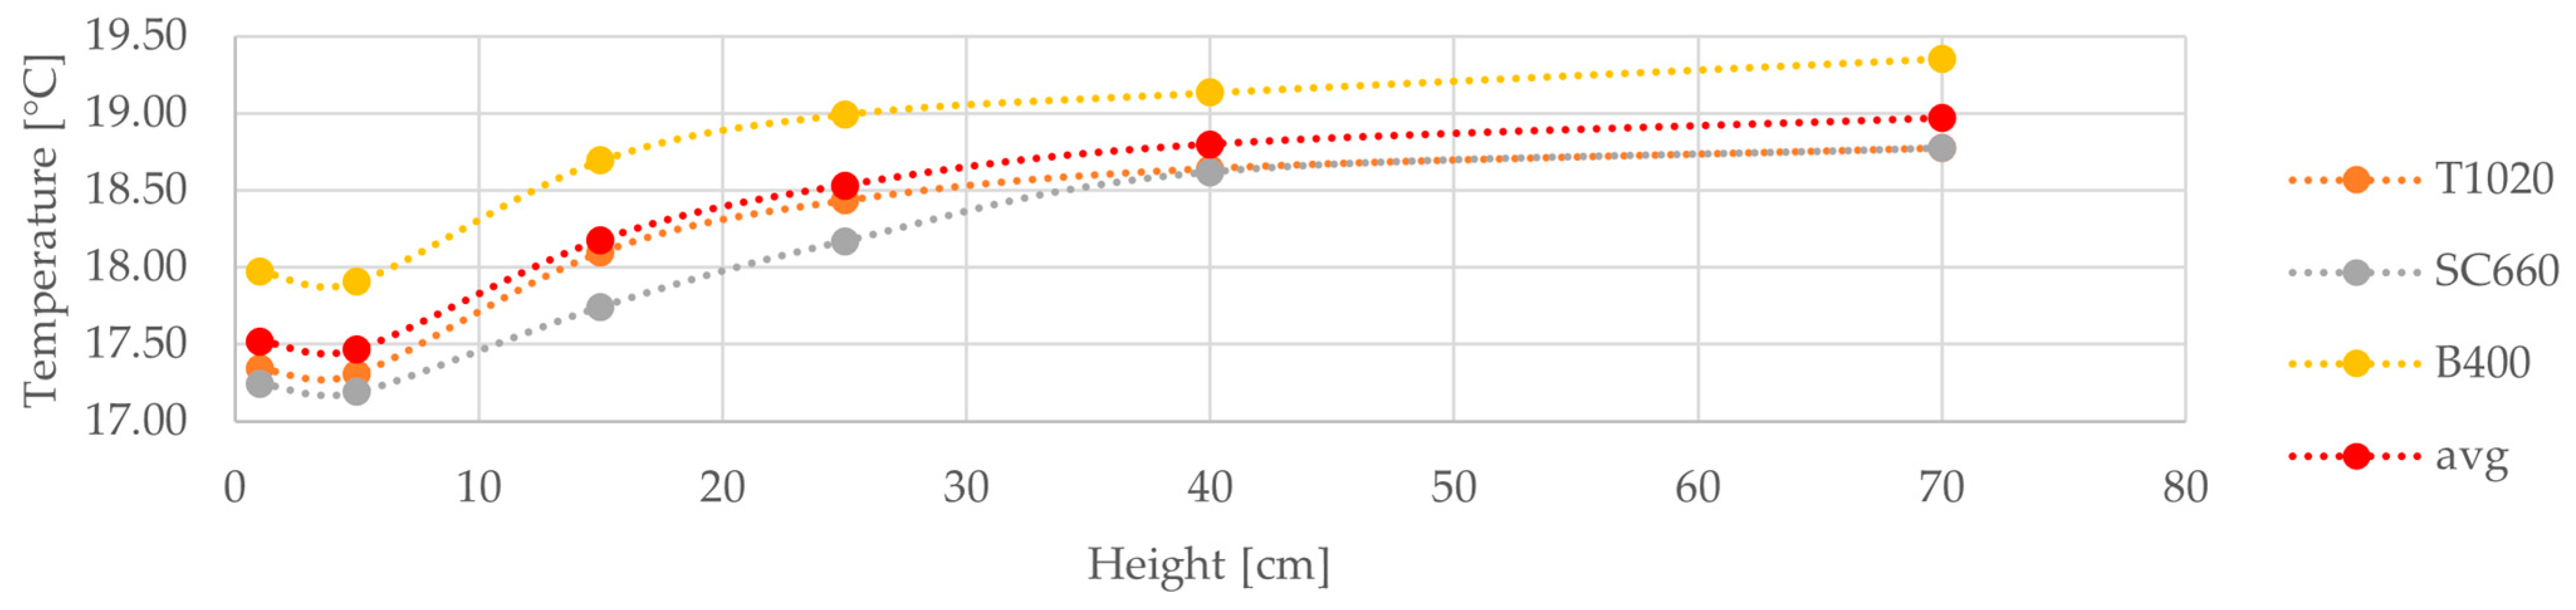
As in Figure 1, the same trend of rising damp can be observed in Figure 3 by comparing six measurement points (at 1, 6, 15, 25, 40, 70 cm, in the middle of the sample) using different cameras and evaluating the noise of the data. The trend is the same, with an alignment of the T1020 and SC660 Western on the right side of the graph, meaning that the cameras recorded the same surface temperature in the dry sample. The mean standard deviation for the points is 0.39, particularly influenced by the third camera B400 Western, because it recorded a higher temperature due to its lower resolution and lower thermal sensitivity.

Figure 3.
Output data of thermal images captured by three different IRT camera.
4. Conclusions
This work briefly investigated the IRT method to study buildings being affected by moisture. The analysis protocol set up gave good results. The technique can be automated using an analysis process to speed up the time taken and standardize the diagnosis on buildings in situ. A careful prior adjustment of some variables is needed.
The future perspective is to correlate the surface temperature data using thermal maps with the quantitative surface moisture content, begin to gather knowledge on the suction and evaporation processes in building materials, compare data in terms of spatial information (as in this case in the profile of mock-up) and conduct temporal analysis. The development of guidelines setting up a protocol of analysis of IRT for moisture evaluation is needed, useful for drafting a standard on the subject, which is currently absent.
The three IRT cameras utilized in the experimentation appear adequate to furnish IR images with the sufficient temperature and spatial resolution. This permits the transformation of data from qualitative into quantitative. In addition, it is also important to consider appropriate operator training for proper data interpretation.
Author Contributions
Conceptualization, F.P. and P.B.; methodology, F.P., P.B., E.G. and P.R.; software, E.G. and P.R.; validation, F.P., P.B., E.G. and P.R.; formal analysis, E.G. and P.R.; investigation, E.G.; resources, F.P., E.G. and P.R.; data curation, E.G. and P.R.; writing—original draft preparation, E.G.; writing—review and editing, F.P. and P.B.; visualization, E.G.; supervision, F.P. and P.B.; project administration, F.P.; funding acquisition, F.P. All authors have read and agreed to the published version of the manuscript.
Funding
This research was funded by the Consortium for Coordination of Research activities Concerning the Venice Lagoon System, grant number 1642/2018.
Institutional Review Board Statement
Not applicable.
Informed Consent Statement
Not applicable.
Data Availability Statement
Data available on request due to restrictions e.g., privacy or ethical. The data presented in this study are available on request from the corresponding author. The data are not publicly available due to under future processing and implementation.
Acknowledgments
Scientific activity was performed in the Research Program Venezia 2021, with the contribution of the Provveditorato Interregionale per le Opere Pubbliche per il Veneto, Trentino Alto Adige and Friuli Venezia Giulia, provided through the concessionary of Consorzio Venezia Nuova and coordinated by CORILA.
Conflicts of Interest
The authors declare no conflict of interest.
References
- Hoff, C.H.; William, D. Water Transport in Brick, Stone and Concrete, 3rd ed.; CRC Press: London, UK, 2021; ISBN 978-0-429-35274-4. [Google Scholar]
- Guolo, E.; Romagnoni, P.; Peron, F. Capillary rising damp in Venetian context: State of the art and numerical simulation. J. Phys. Conf. Ser. 2021, 2069, 012046. [Google Scholar] [CrossRef]
- Tavukçuoğlu, A.; Grinzato, E. Determination of critical moisture content in porous materials by IR thermography. Quant. InfraRed Thermogr. J. 2006, 3, 231–245. [Google Scholar] [CrossRef]
- Barreira, E.; Almeida, R.M.S.F.; L. Simões, M.; Rebelo, D. Quantitative Infrared Thermography to Evaluate the Humidification of Lightweight Concrete. Sensors 2020, 20, 1664. [Google Scholar] [CrossRef] [PubMed]
- Melada, J.; Gargano, M.; Veronese, I.; Ludwig, N. Does electro-osmosis work in moisture damage prevention? Applicability of infrared-based methods to verify water distribution under electric fields. J. Cult. Herit. 2018, 31, S38–S45. [Google Scholar] [CrossRef]
- Melada, J.; Arosio, P.; Gargano, M.; Ludwig, N. Automatic thermograms segmentation, preliminary insight into spilling drop test. Quant. InfraRed Thermogr. J. 2023, 1–15. [Google Scholar] [CrossRef]
- Lerma, C.; Mas, Á.; Gil Benso, E.; Vercher, J.; Martínez, M.J. Pathology of building materials in historic buildings. Relationship between laboratory testing and infrared thermography. Mater. Constr. 2013, 64, e009. [Google Scholar] [CrossRef]
- Avdelidis, N.P.; Moropoulou, A. Emissivity considerations in building thermography. Energy Build. 2003, 35, 663–667. [Google Scholar] [CrossRef]
- Guolo, E.; Romagnoni, P.; Dalla Mora, T.; Peron, F. The Rising Damp in Venetian Masonry: Preliminary Results Comparing Laboratory Tests and Dynamic Simulations. Sustainability 2023, 15, 76. [Google Scholar] [CrossRef]
Disclaimer/Publisher’s Note: The statements, opinions and data contained in all publications are solely those of the individual author(s) and contributor(s) and not of MDPI and/or the editor(s). MDPI and/or the editor(s) disclaim responsibility for any injury to people or property resulting from any ideas, methods, instructions or products referred to in the content. |
© 2023 by the authors. Licensee MDPI, Basel, Switzerland. This article is an open access article distributed under the terms and conditions of the Creative Commons Attribution (CC BY) license (https://creativecommons.org/licenses/by/4.0/).