
Prediction and Property Characterization of Injection Machining Parts Using Analysis for Relationship between Melt-Filling Pressure Measurement and Calculation Viscosity Index †


Abstract
:1. Introduction
2. Experimental Works
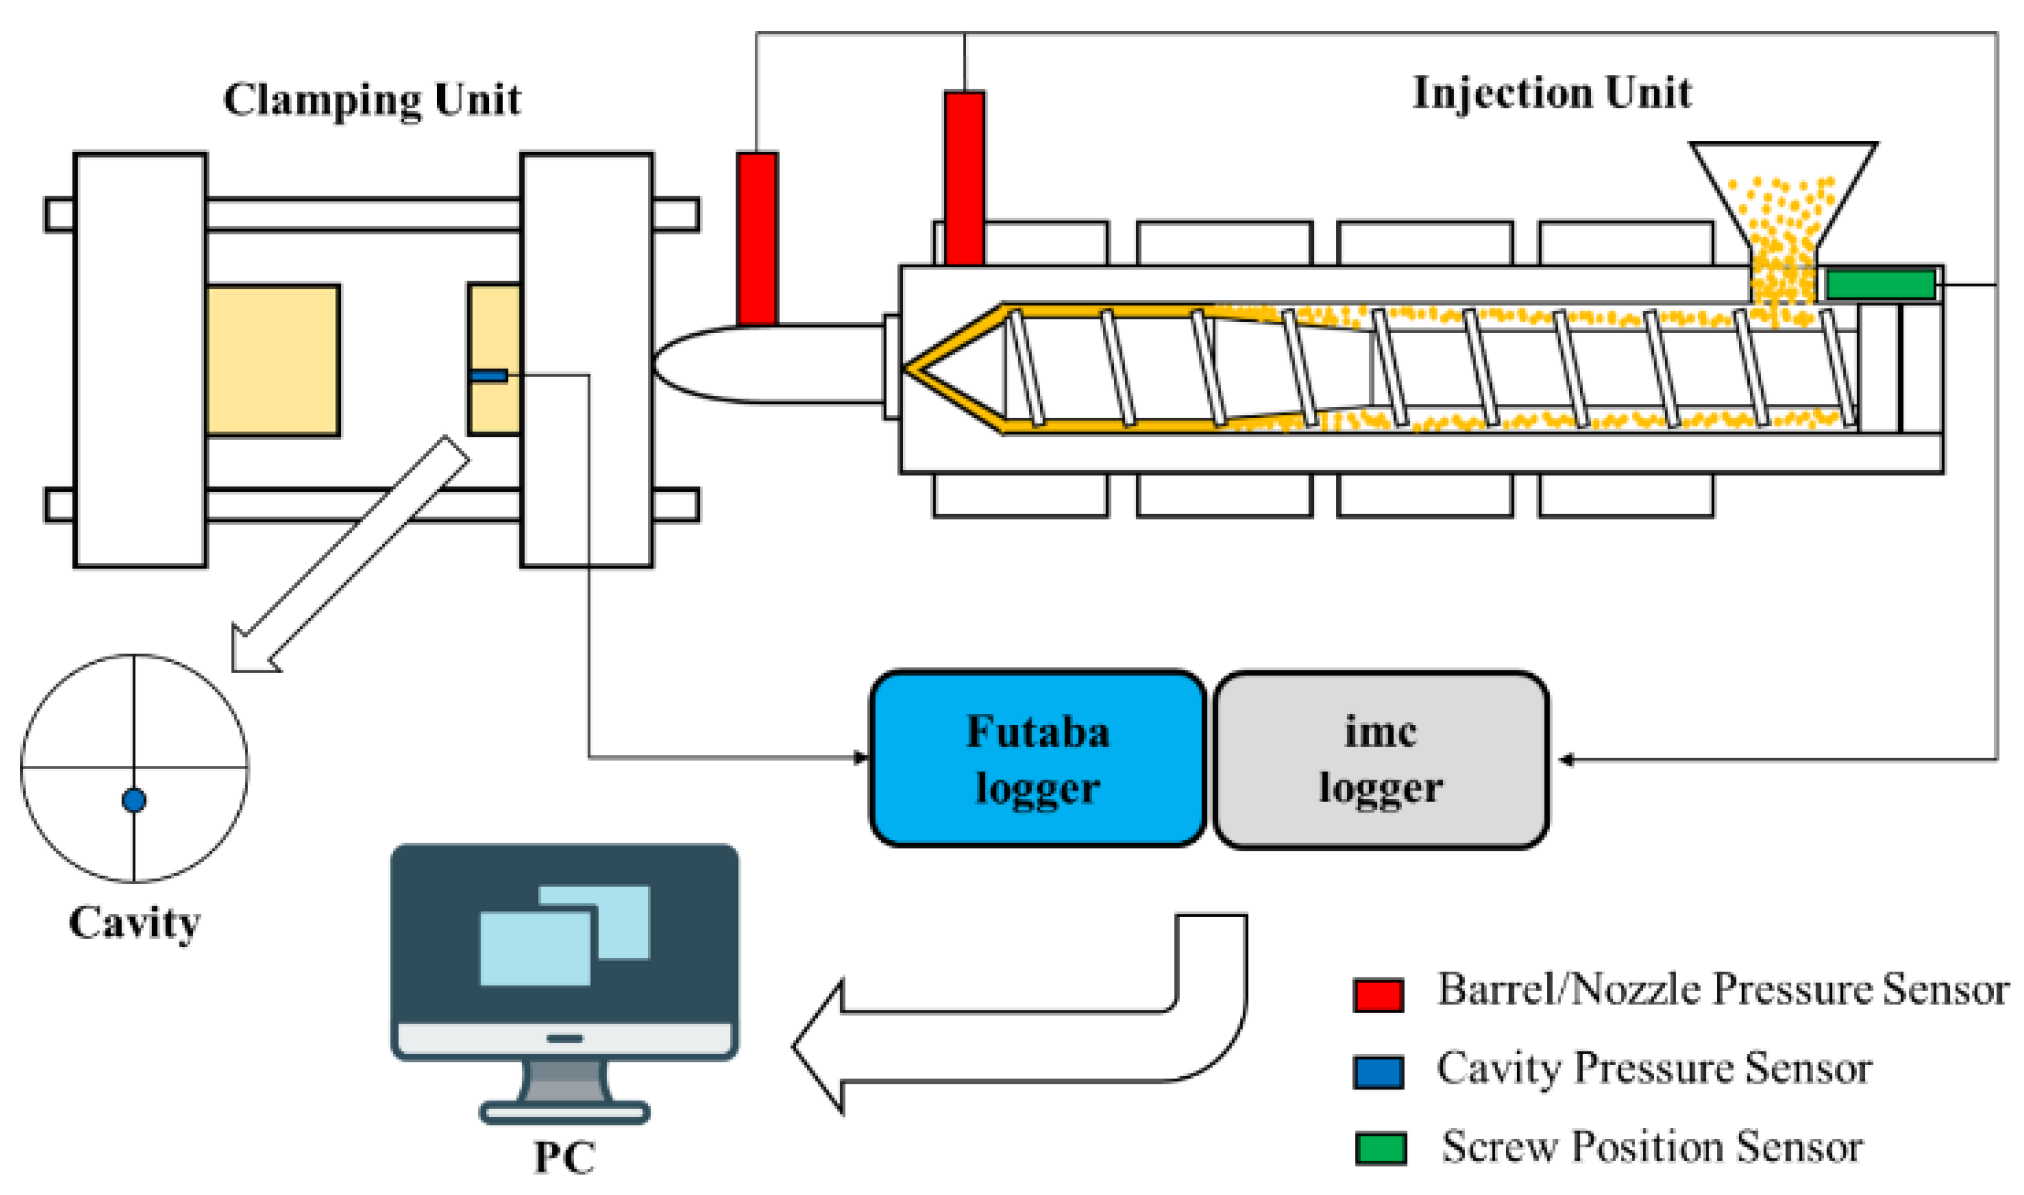
2.1. Sample and Equipment
2.2. Materials
2.3. Test Method
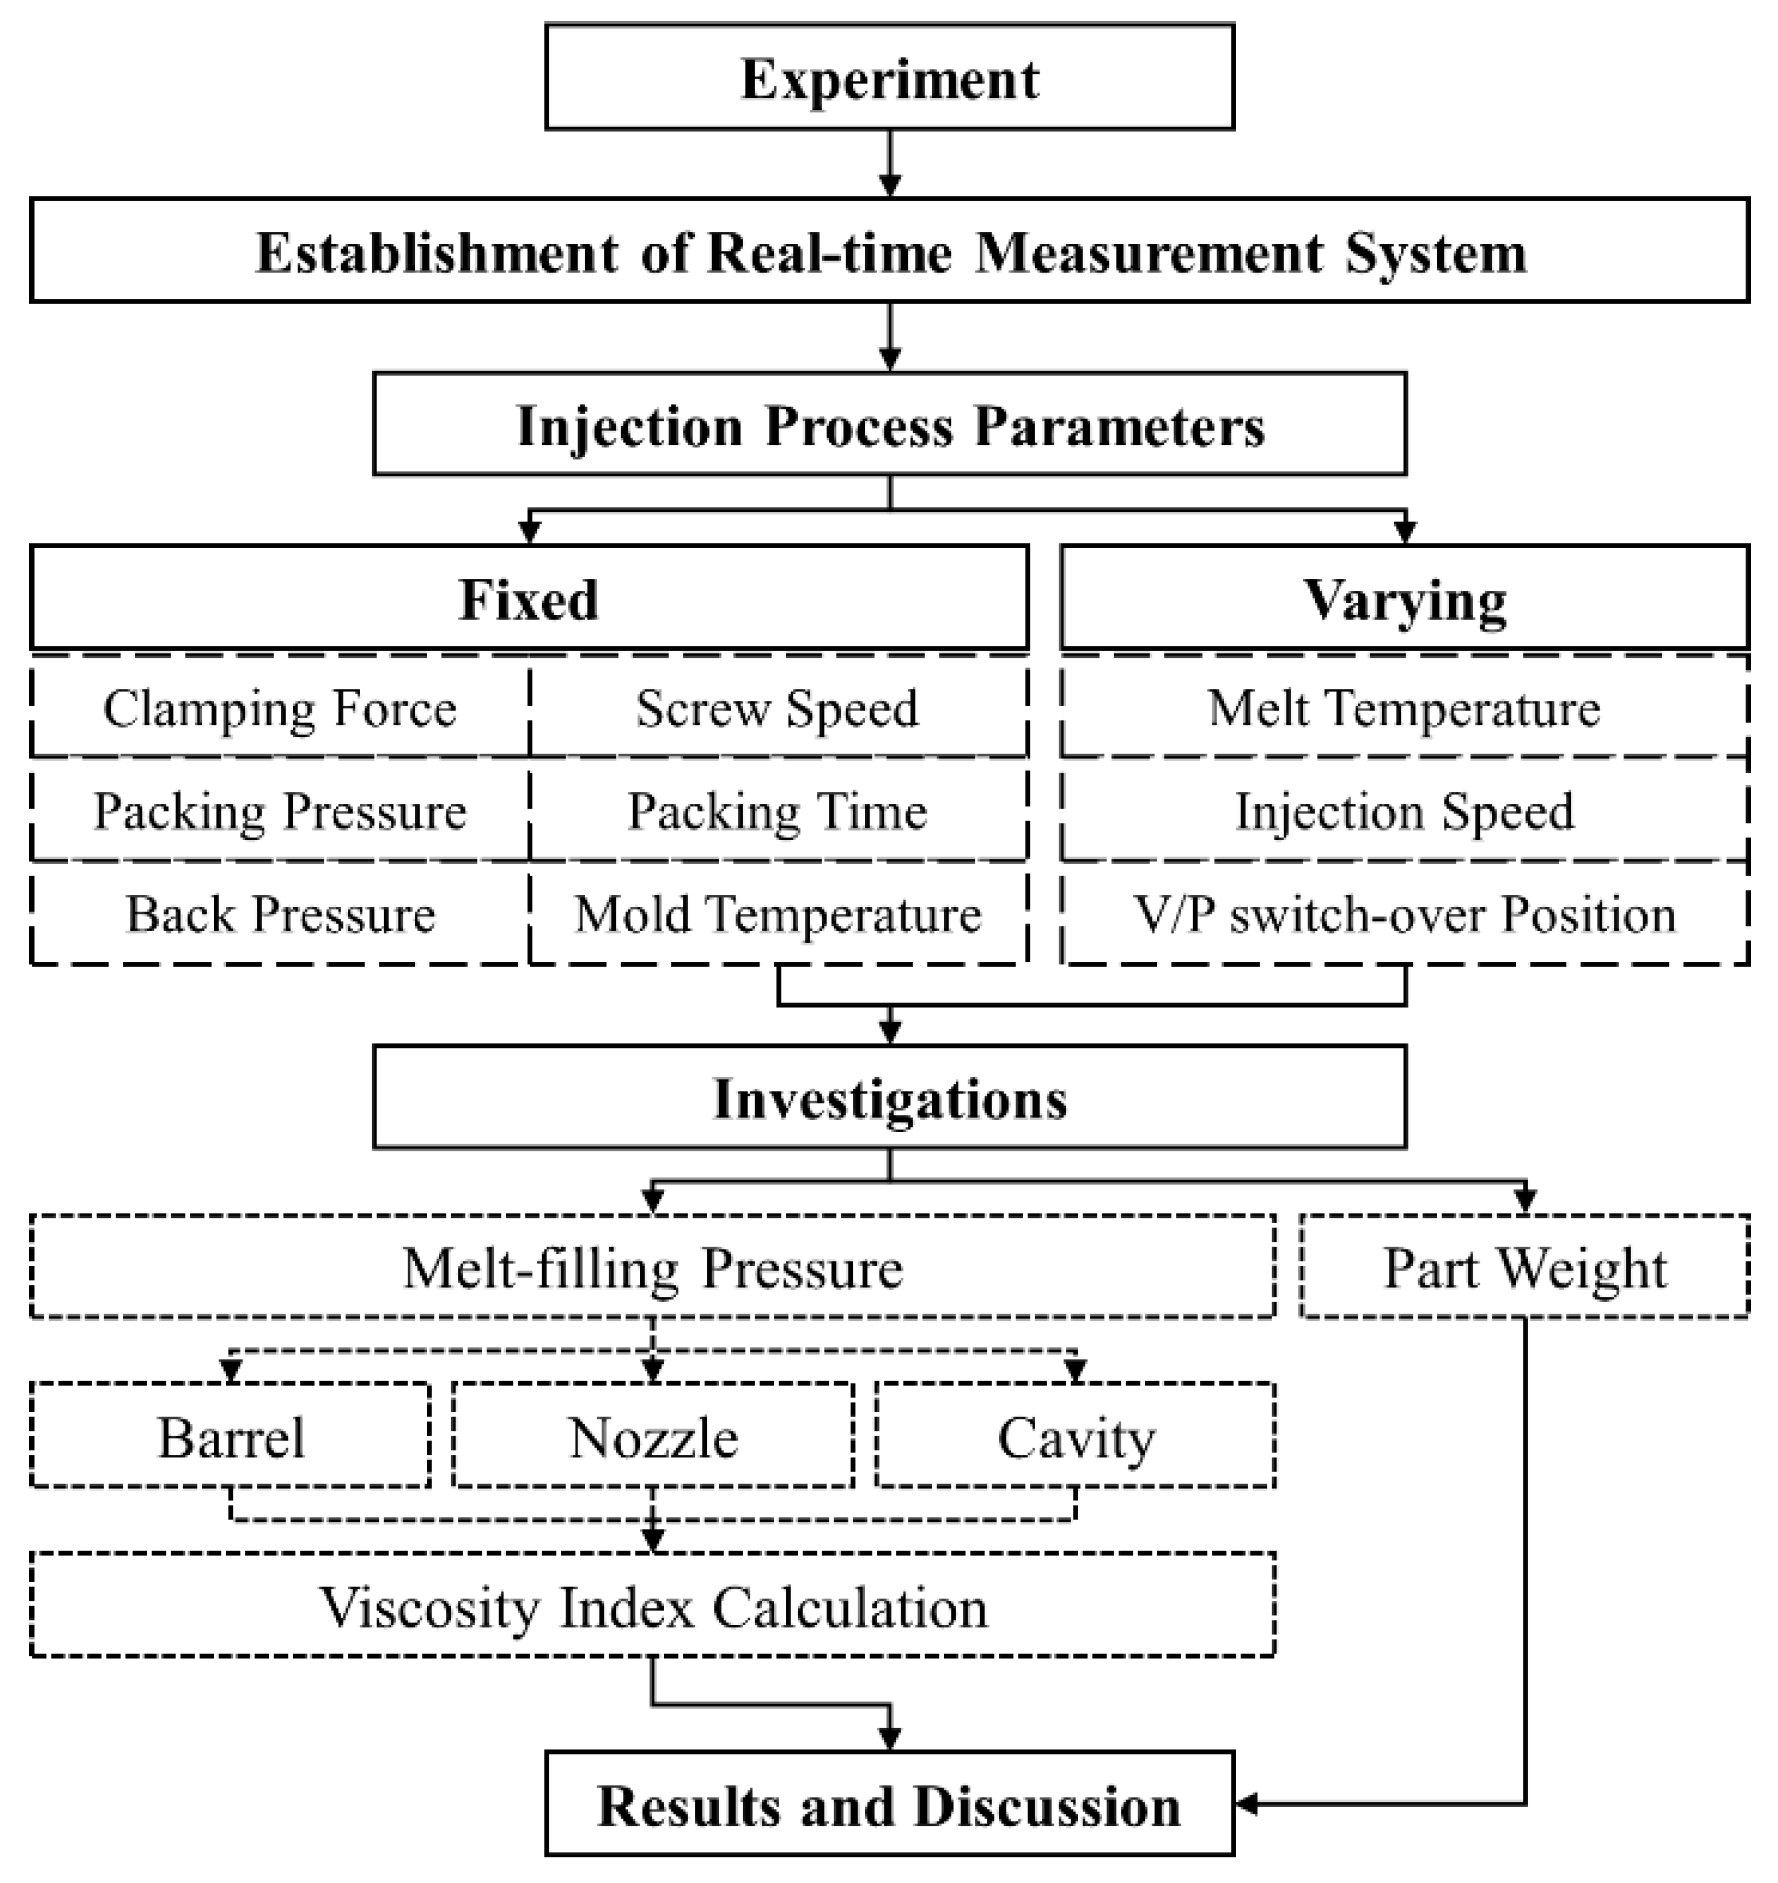
2.3.1. Flow of Investigations
2.3.2. Melt-Filling Pressure of the Real-Time Mechanism
3. Results and Discussion
3.1. Effect of Melt-Filling Pressure and Viscosity
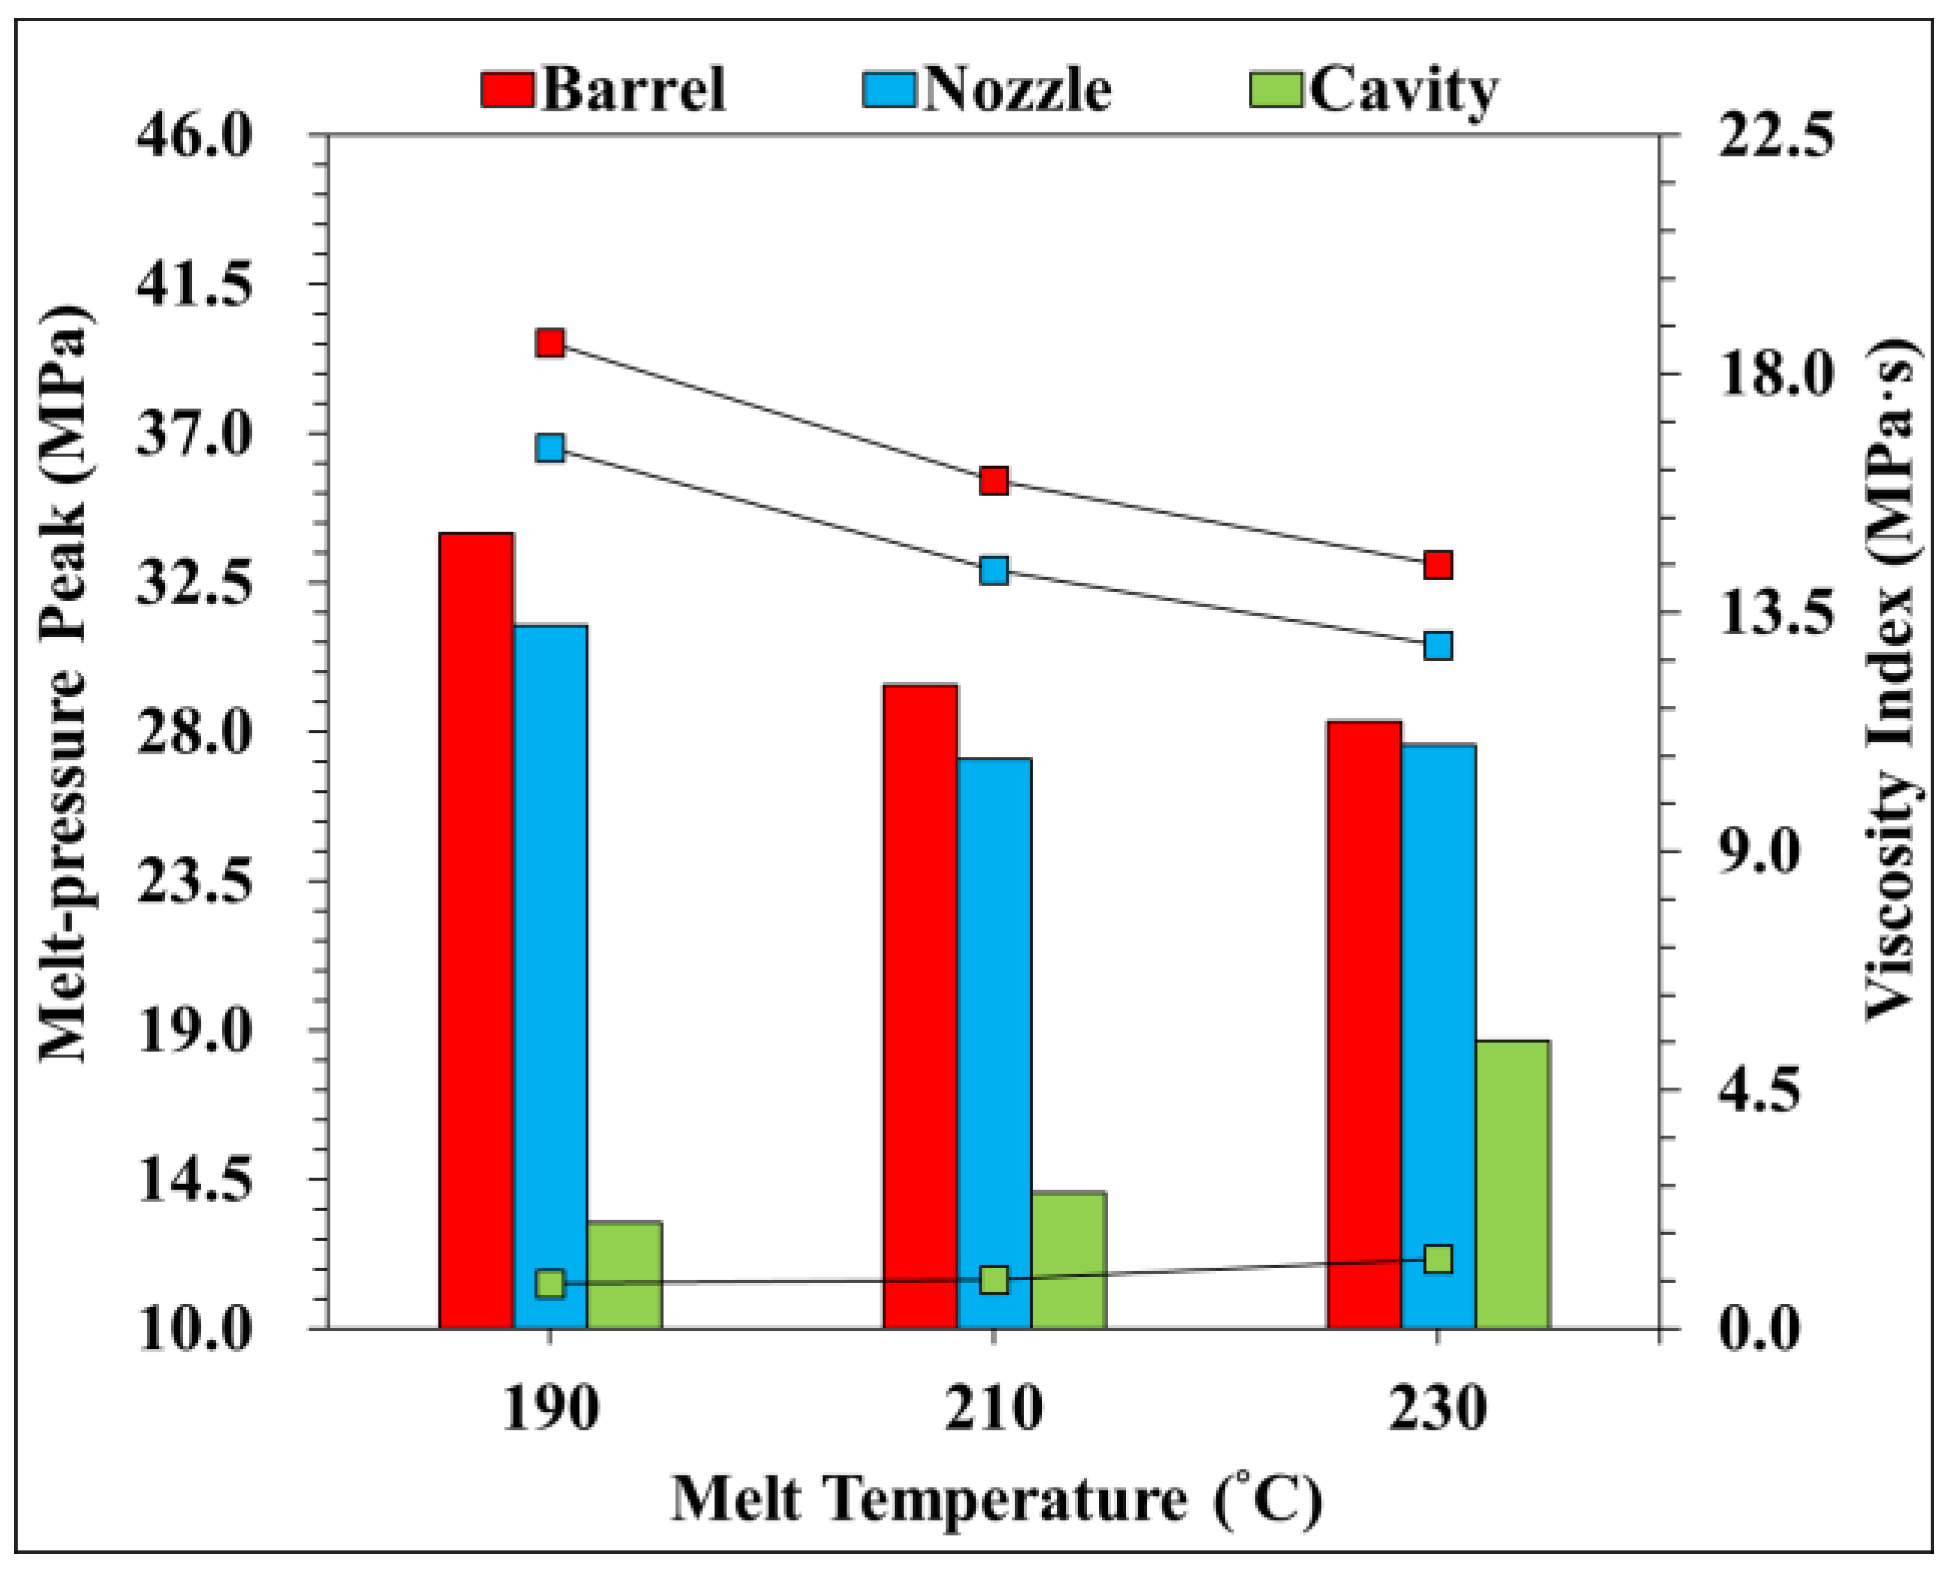
- Effect of temperature of melt.
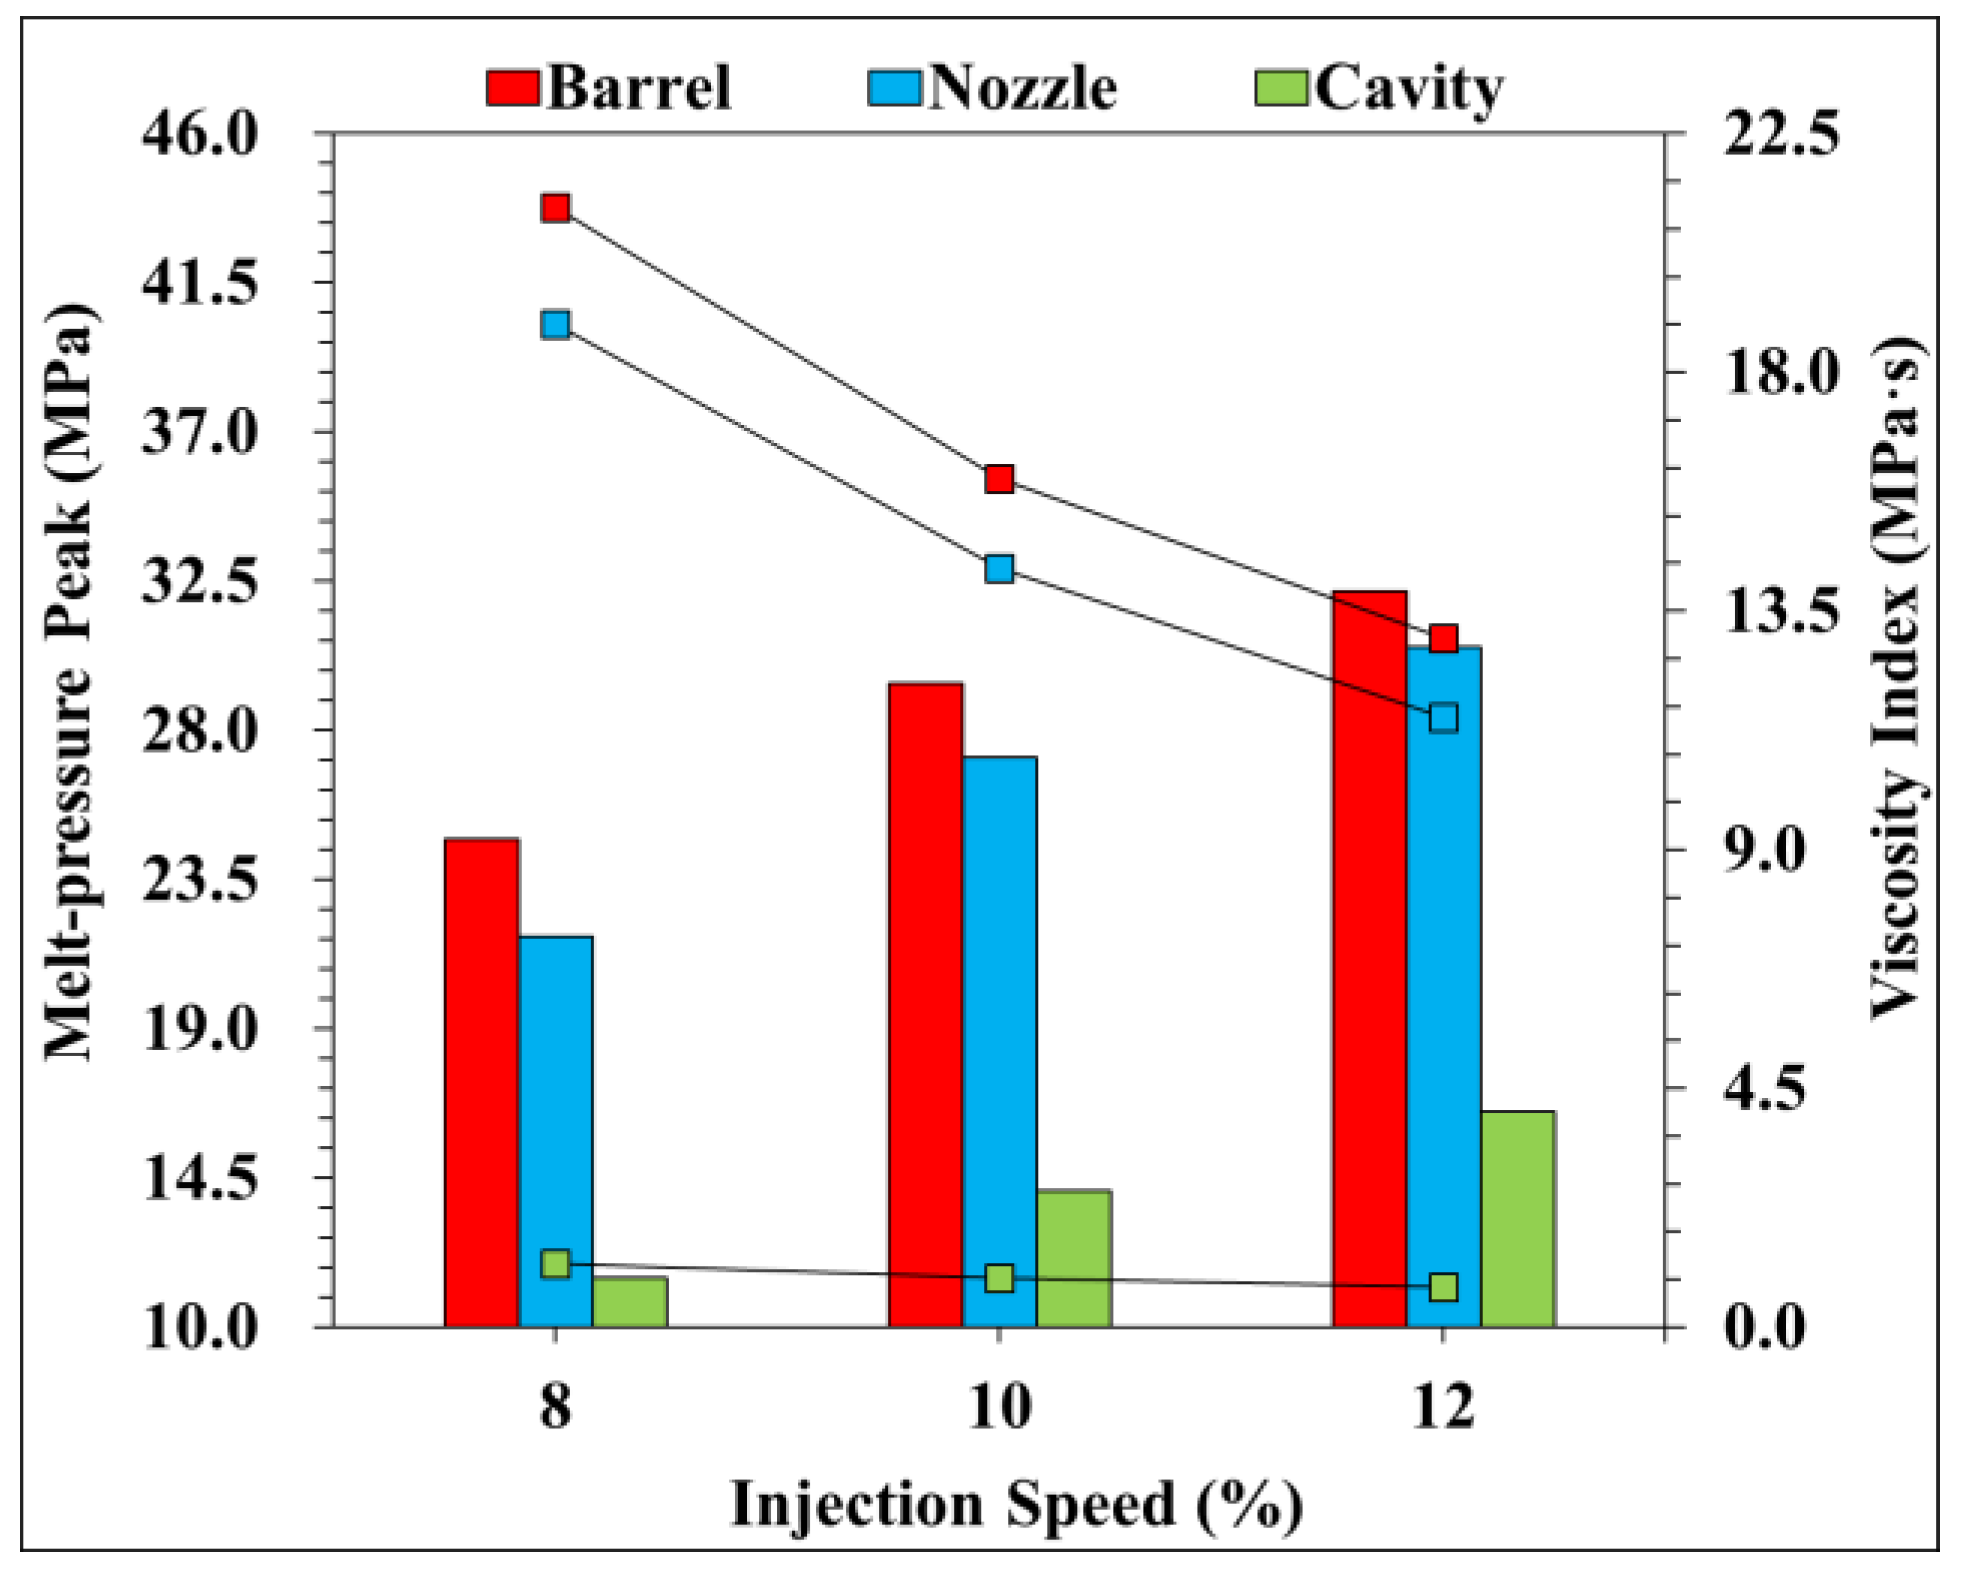
- Effect of injection speed
- Effect of V/P switch-over position
3.2. Trend of Viscosity Index and Final Weight
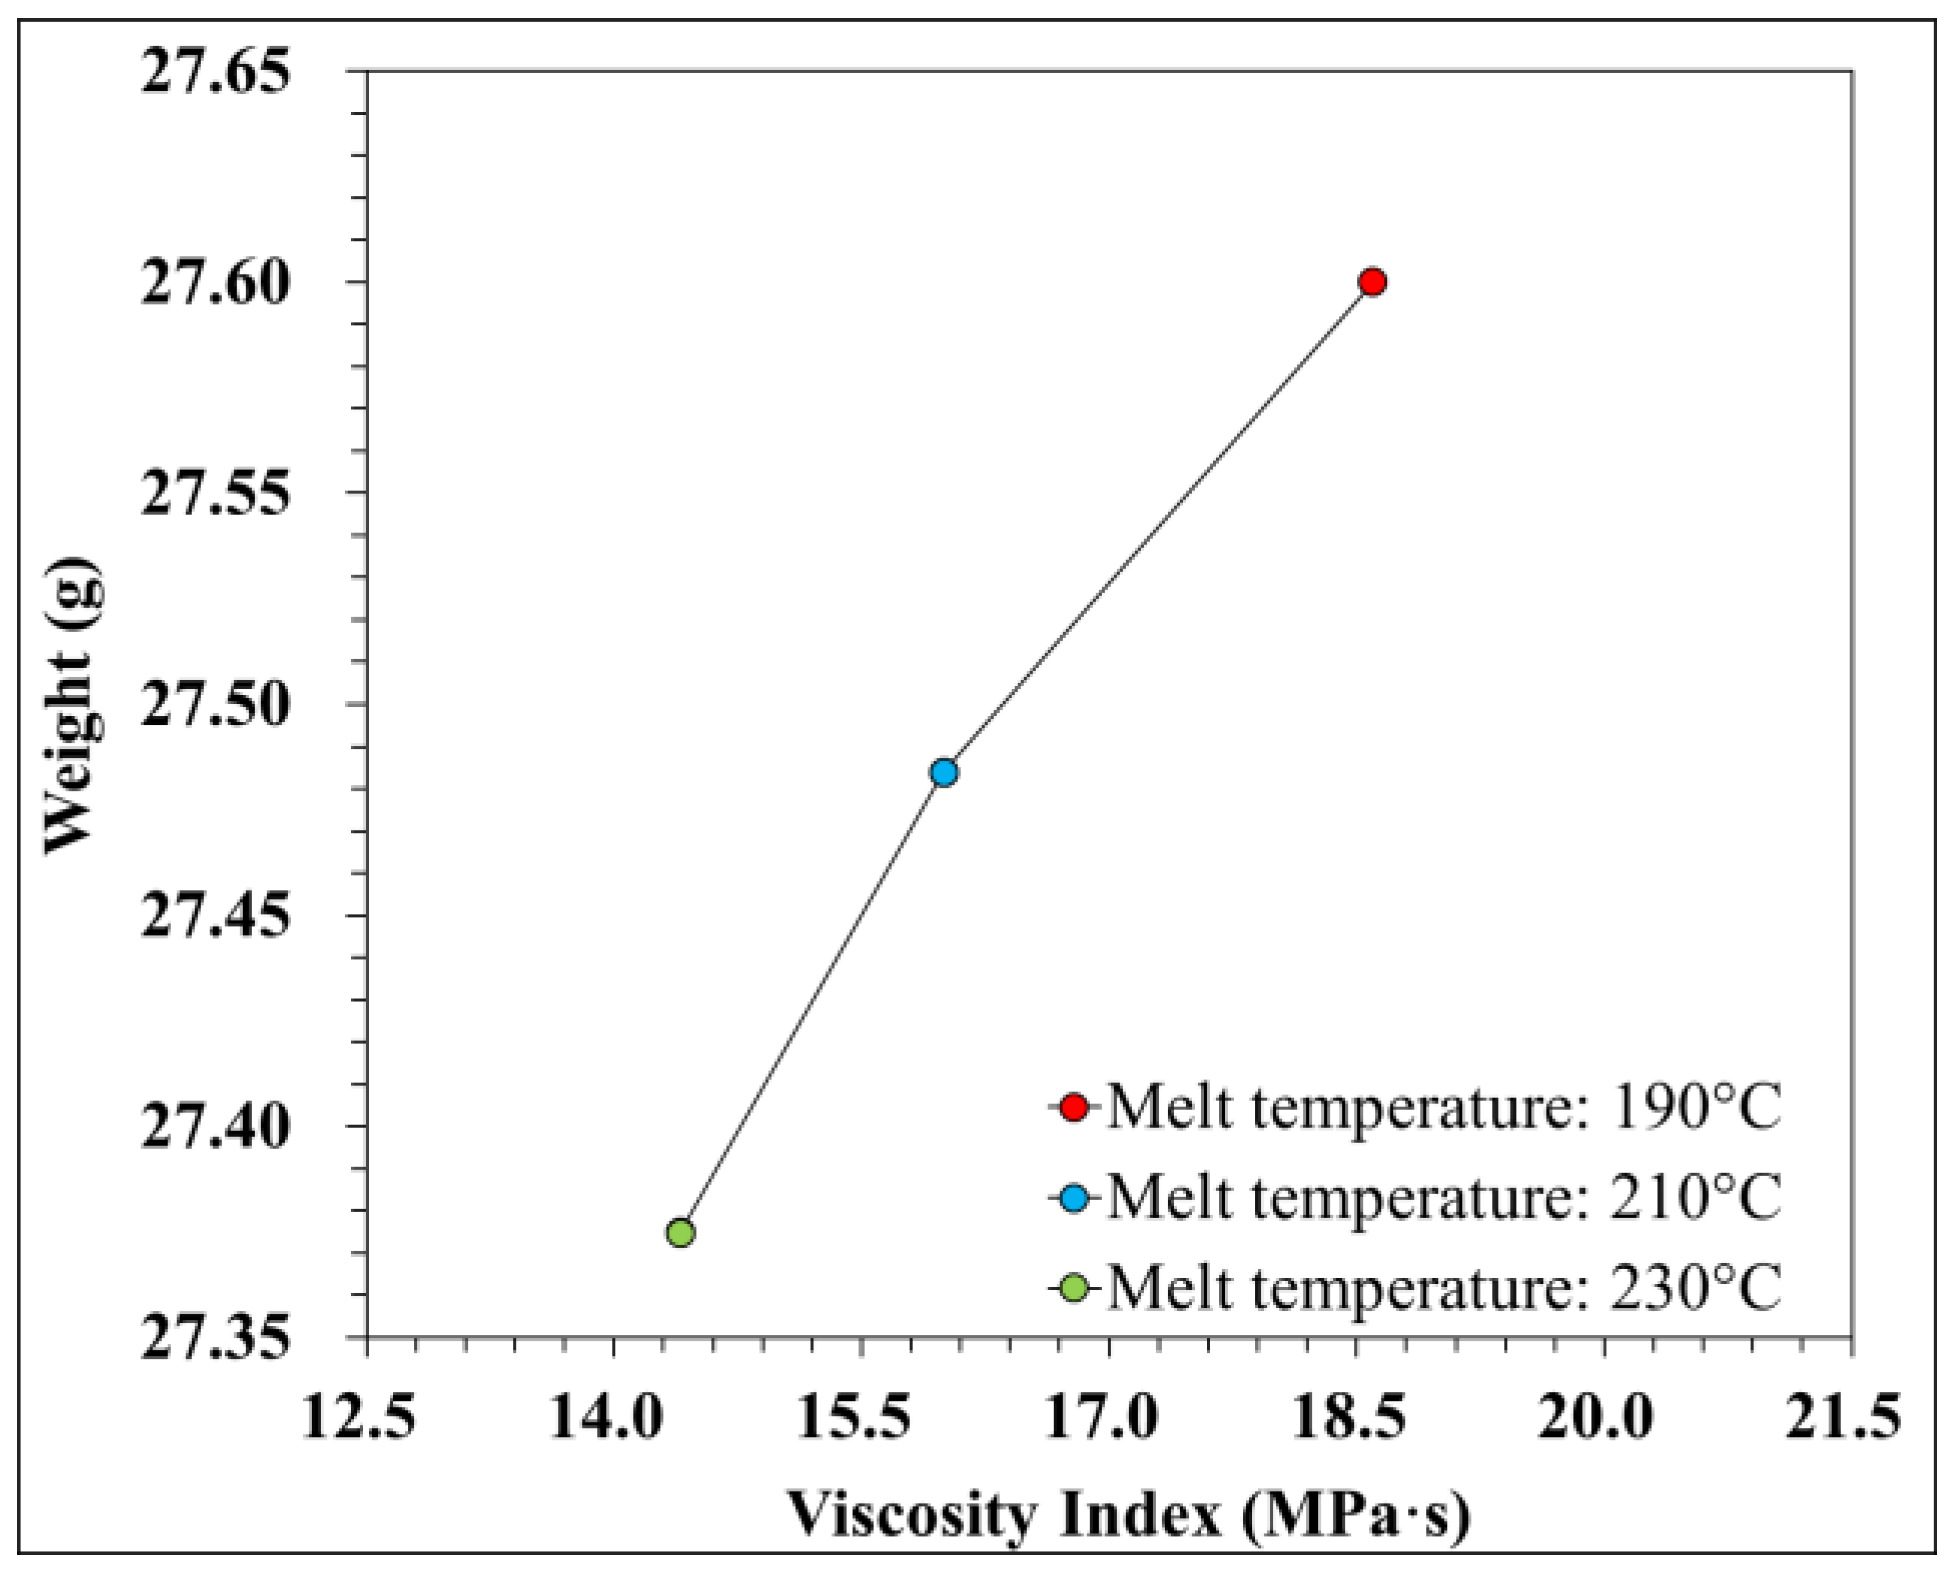
- Variation in the melt temperature
- Variation in the injection speed
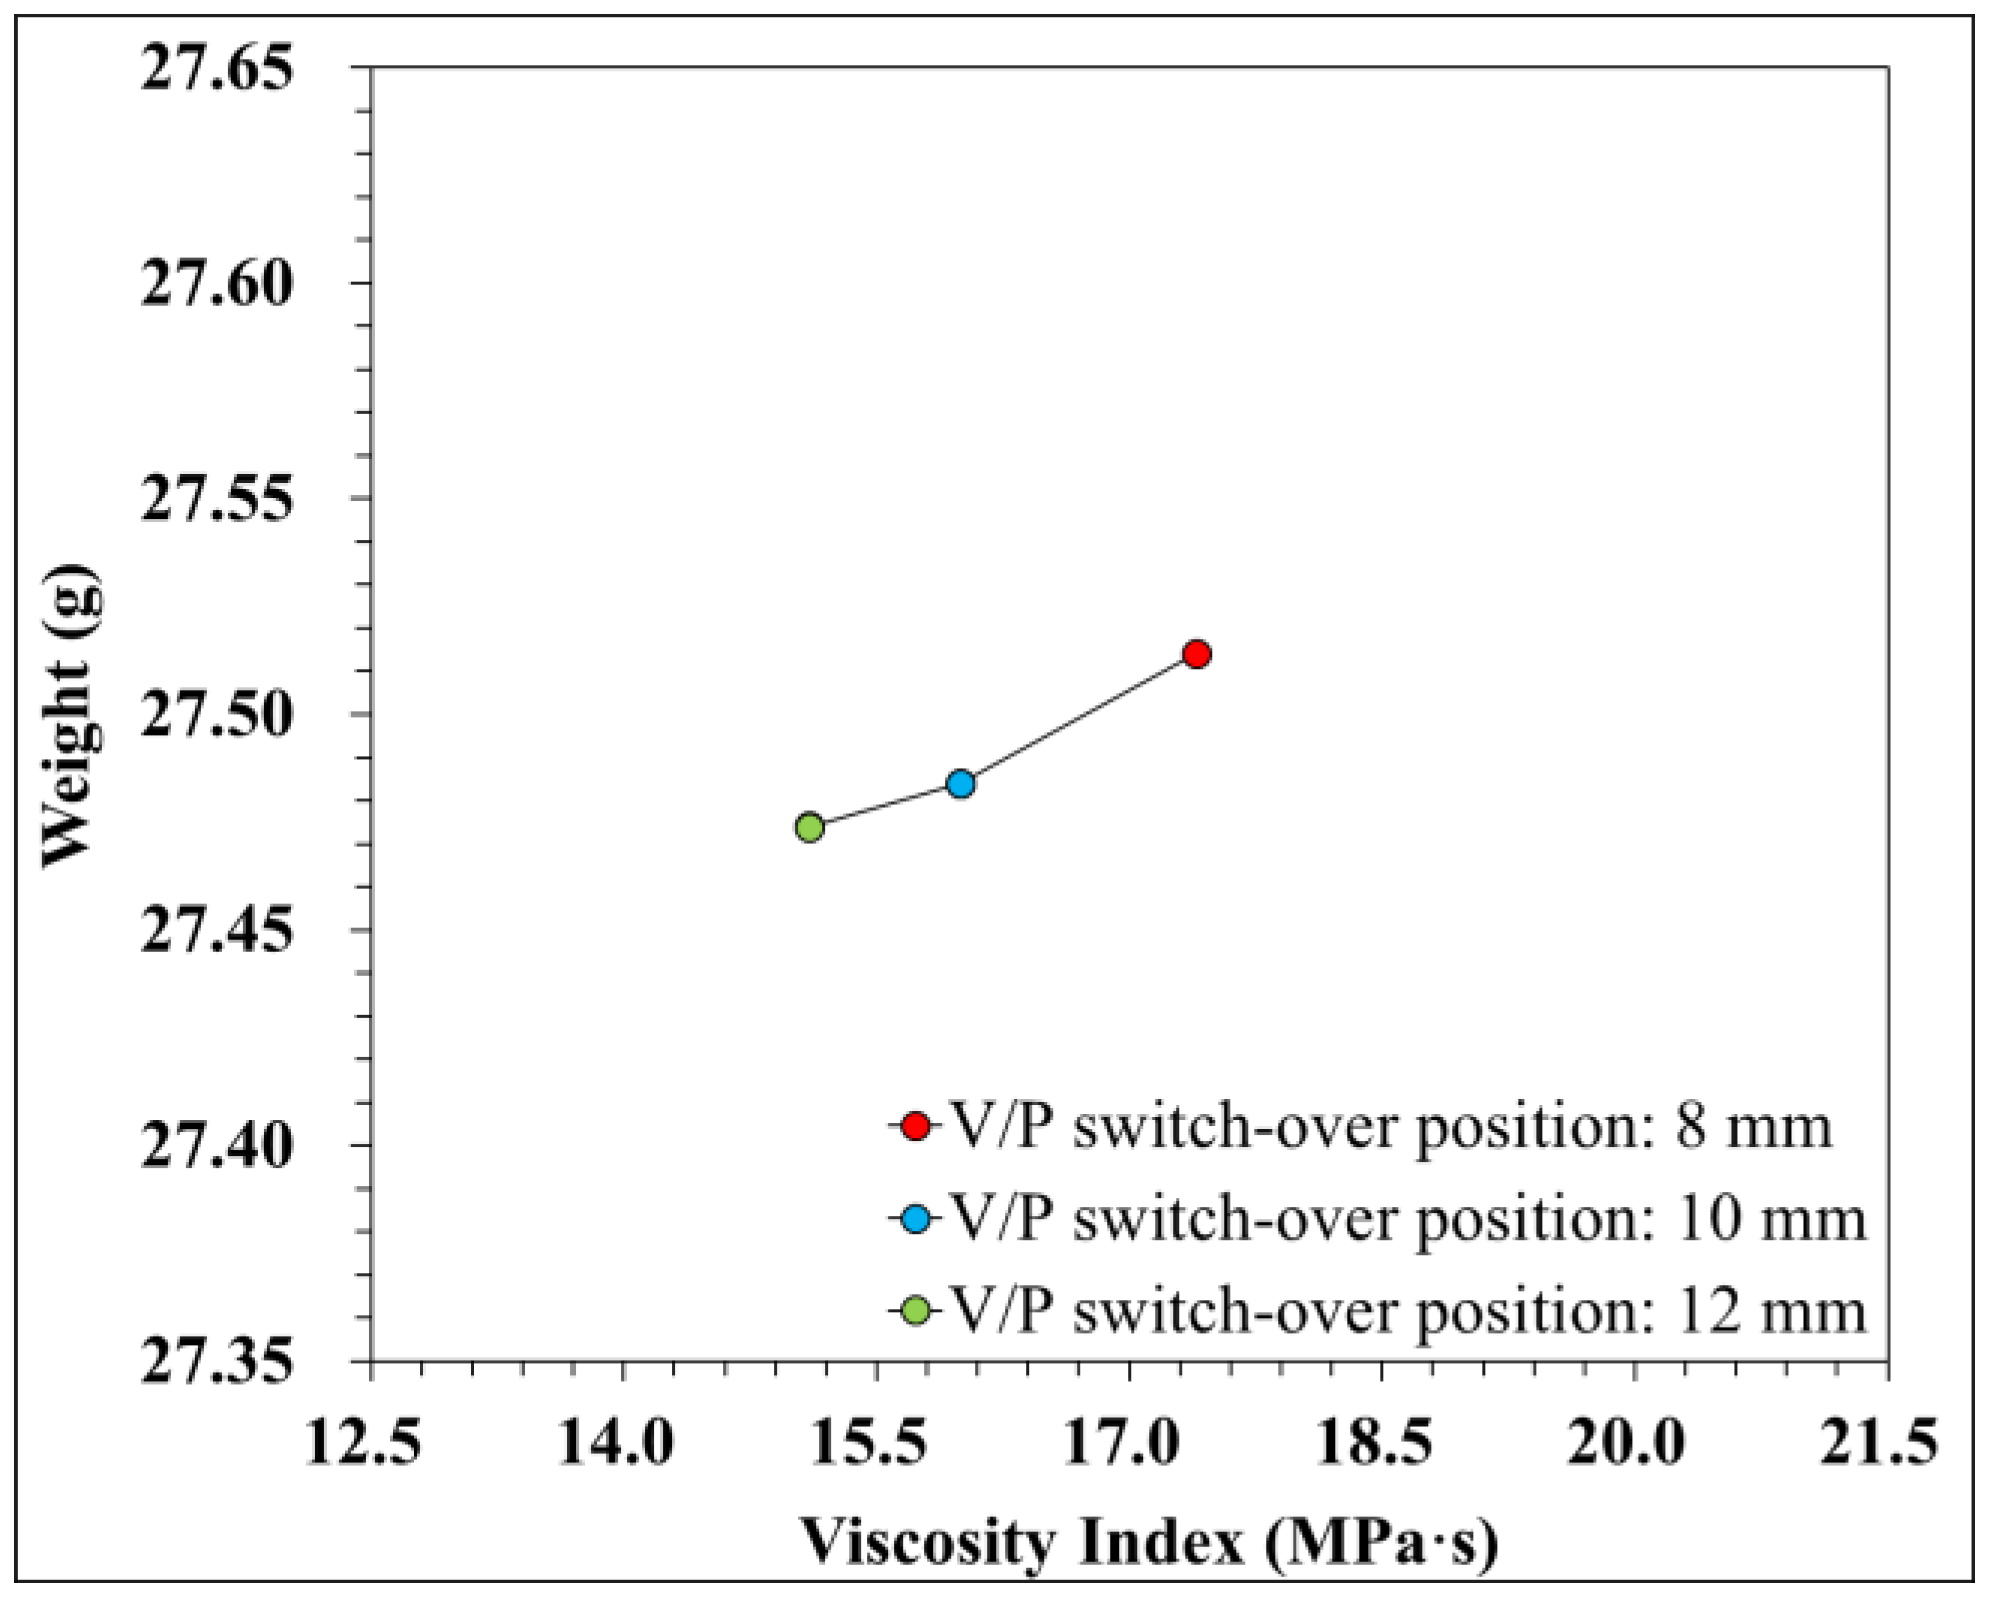
- Variation in the V/P switch-over position
4. Conclusions
- (1)
- The melt-filling pressures in the mold cavity, injection barrel, and nozzle changed with the process parameters. The injection speed had a relatively significant impact on the variation in the barrel pressure.
- (2)
- Research into the correlation between the viscosity index variation in the injection barrel and part weight in response to different process parameters shows that changes in the melt temperature had a relatively significant impact on part weight and that changes in the injection speed had a relatively significant impact on viscosity variation.
Author Contributions
Funding
Institutional Review Board Statement
Informed Consent Statement
Data Availability Statement
Acknowledgments
Conflicts of Interest
References
- Kazmer, D.O.; Velusamy, S.; Westerdale, S.; Johnston, S.; Gao, R.X. A comparison of seven filling to packing switchover methods for injection molding. Polym. Eng. Sci. 2010, 50, 2031–2043. [Google Scholar] [CrossRef]
- Michaeli, W.; Schreiber, A. Online control of the injection molding process based on process variables. Adv. Polym. Technol. 2009, 28, 65–76. [Google Scholar] [CrossRef]
- Huang, M.S.; Lin, C.Y. A Novel Clamping Force Searching Method Based on Sensing Tie-Bar Elongation for Injection Molding. Int. J. Heat Mass Transf. 2017, 109, 223–230. [Google Scholar] [CrossRef]
- Chen, J.Y.; Liu, C.Y.; Huang, M.S. Enhancement of Injection Molding Consistency by Adjusting Velocity/Pressure Switching Time Based on Clamping Force. Int. Polym. Process. 2019, 34, 564–572. [Google Scholar] [CrossRef]
- Chen, Z.; Turng, L.S. Injection molding quality control by integrating weight feedback into a cascade closed-loop control system. Polym. Eng. Sci. 2007, 47, 852–862. [Google Scholar] [CrossRef]
- Agrawal, A.R.; Pandelidis, I.O.; Pecht, M. Injection-molding process control—A review. Polym. Eng. Sci. 1987, 27, 1345–1357. [Google Scholar] [CrossRef]
- Zhang, S.; Dubay, R.; Charest, M. A principal component analysis model-based predictive controller for controlling part warpage in plastic injection molding. Expert Syst. Appl. 2015, 42, 2919–2927. [Google Scholar] [CrossRef]
- Heinzler, F.A.; Mistier, M.; Wortberg, J. Quality Improvement by Enhanced Pressure Controlled Injection Molding. SPE ANTEC Tech. Pap. 2014, 2, 1694–1699. [Google Scholar]
- Hopmann, C.; Abel, D.; Heinisch, J.; Stemmler, S. Self-Optimizing Injection Molding Based on Iterative Learning Cavity Pressure Control. Prod. Eng. 2017, 11, 97–106. [Google Scholar] [CrossRef]
- Chen, Y.-S.; Wu, K.-T.; Tsai, M.-H.; Hwang, S.-J.; Lee, H.-H.; Peng, H.-S.; Chu, H.-Y. Adaptive process control of the changeover point for injection molding process. J. Low Freq. Noise Vib. Act. Control 2021, 40, 383–394. [Google Scholar] [CrossRef]
- Chen, J.-Y.; Yang, K.-J.; Huang, M.-S. Online quality monitoring of molten resin in injection molding. Int. J. Heat Mass Transf. 2018, 122, 681–693. [Google Scholar] [CrossRef]
- Schiffers, R.; Kruppa, S.; Moser, S. The right changeover point for each shot. J. Kunststoffe 2014, 11, 26–29. [Google Scholar]


| Exp. | Melt Temperature (°C) | Injection Speed (%) | V/P Switch-Over Position (mm) |
|---|---|---|---|
| 1 | 190 | 50 | 10 |
| 2 | 210 | 50 | 10 |
| 3 | 230 | 50 | 10 |
| 4 | 210 | 30 | 10 |
| 5 | 210 | 50 | 10 |
| 6 | 210 | 70 | 10 |
| 7 | 210 | 50 | 8 |
| 8 | 210 | 50 | 10 |
| 9 | 210 | 50 | 12 |
Disclaimer/Publisher’s Note: The statements, opinions and data contained in all publications are solely those of the individual author(s) and contributor(s) and not of MDPI and/or the editor(s). MDPI and/or the editor(s) disclaim responsibility for any injury to people or property resulting from any ideas, methods, instructions or products referred to in the content. |
© 2023 by the authors. Licensee MDPI, Basel, Switzerland. This article is an open access article distributed under the terms and conditions of the Creative Commons Attribution (CC BY) license (https://creativecommons.org/licenses/by/4.0/).
Share and Cite
Lee, C.-C.; Peng, H.-S.; Huang, P.-W.; Liew, K.-F.; Wu, D.-R.; Su, W.-J. Prediction and Property Characterization of Injection Machining Parts Using Analysis for Relationship between Melt-Filling Pressure Measurement and Calculation Viscosity Index. Eng. Proc. 2023, 55, 25. https://doi.org/10.3390/engproc2023055025
Lee C-C, Peng H-S, Huang P-W, Liew K-F, Wu D-R, Su W-J. Prediction and Property Characterization of Injection Machining Parts Using Analysis for Relationship between Melt-Filling Pressure Measurement and Calculation Viscosity Index. Engineering Proceedings. 2023; 55(1):25. https://doi.org/10.3390/engproc2023055025
Chicago/Turabian StyleLee, Chin-Chun, Hsin-Shu Peng, Po-Wei Huang, Kai-Fu Liew, Dian-Ru Wu, and Wei-Jie Su. 2023. "Prediction and Property Characterization of Injection Machining Parts Using Analysis for Relationship between Melt-Filling Pressure Measurement and Calculation Viscosity Index" Engineering Proceedings 55, no. 1: 25. https://doi.org/10.3390/engproc2023055025