Abstract
The main consequence of the arrival of COVID-19 was the application of social distancing, which mainly had implications regarding the economies of affected countries. This affected students, whose economy was weakened because of social restrictions. Therefore, private universities that depend strongly on the continuity of students had to face some difficult periods, with an eventual increase in desertions. In this way, the general managers’ offices had to find new and consistent directions for correct decision making without reducing the quality of the service. This paper presents a scheme that was applied in a private university in the south of Lima city during the period of 2020–2021. It is shown that the usage of a set of variables and their combinations to make a decision only appears to be relevant if a such decision is free of either external or internal noise. The results exhibit a minimization of 70% in the potential number of desertions in 2021 due to the gained experiences of 2020.
1. Introduction
In March of 2020, all countries were dramatically affected by the unexpected arrival of coronavirus disease [1,2,3] producing fatalities in its first pandemic wave. This triggered a chain of economic, political, and educational decisions in affected places that changed the day-to-day evolution of the whole of society in order to guarantee the health of the people [4,5].
Such decisions, such as to migrate to a virtual (or online) mode, were supported by technology, especially the Internet. In the age of 4G, the Internet emerged as a prominent exit from the problem of continuity in human development due to its interaction with a changing society dictated by the latest technologies.
Clearly, at the beginning of 2020, most countries adopted the so-called digitalization of their systems as an imminent action to counteract the rapid weakening of society due to the fast-increasing number of COVID-19 infections [6,7,8,9,10].
In this manner, the educational sector modified its classical style of blackboard teaching to one based entirely on video conferences [11,12,13]. This was undertaken as a protective action to avoid infections at schools and universities. Thus, after curfews were implemented, universities had to adjust their pedagogical methodologies towards online digital education.
Although advanced students, ranging from the second to the last years of their academic programs, might have interacted with video conferences prior to the beginning of the pandemic, this was not the case with freshman students. In effect, more of them had no experience with virtual education, so universities had to focus their educational machinery, in particular the mechanisms of virtual education, onto these freshman students as a critical action to keep their tuition and, therefore, to keep them enrolled over the coming years. Clearly, universities faced a rise in desertion, which can be seen as an imminent threat to their institutional stability, particularly private ones [14,15].
Thus emerged the question: how interesting were the first online classes for freshman students? From this, one can then formulate a subsequent question: how stimulating were the first lectures for them whilst using software-based video conferences?
In this paper, attention has been paid to a private university in south Lima, with a population of around 7.5k students. Thus, from the beginning of the pandemic, this university continued with its evolution of whole-university dynamics through video-conference meetings and video-conference classes.
Thus, based on experience, it was noted that, although no strong desertion was reported, surveys underline the nonconformity of freshman students.
Although video technology most likely personalized students’ education, one can see that the impact and nonconformity on the side of the students is not instantaneously felt. Thus, the success of online classes depends in on the one hand on technology, and on the other hand on the strong capability of instructors and how they can keep the attention of students throughout a class. In this manner, it is not clear if the quality of education was untouched [16,17]. It is merely a point to be studied in this paper.
The rest of this paper is structured as follows: In the second section, the main characteristics of online classes are viewed. In the third section, a statistical analysis is presented. In the fourth section, the results of the study are given. Finally, the conclusion regarding the results of paper is presented.
2. Basics of Online Classes
An online class, called also virtual teaching, can be defined as an interaction at a distance between a teacher and student through a software–hardware interface that aims to replace an ordinary class. In contrast to these ordinary classes, where a teacher employs a blackboard with chalk and there is a face-to-face interaction, a virtual class would present limitations (on the side of student), some of which can be listed below.
Table 1 above highlights up to five variables that were selected from applied surveys to freshman students. In the first column on the left, Internet connections are described as the most important variable to be met in a successful manner for virtual classes. It is clearly a crucial variable that demands to be unstoppable, as written in the third column. In the last column, one can see that this might not work for a class due to the following reasons: (i) the Internet provider might have increased costs in the pandemic epoch as a consequence of supply and demand; (ii) the fast-increasing number of new Internet clients had a noteworthy impact on the networks as well as on the quality of service. In this manner, connectivity to the Internet in South American countries can be seen as an intersection of social and technological problems.

Table 1.
Description of variables studied at this paper.
Although, on the one hand, one can guarantee the stability of an Internet connection, on the other hand, one can wonder about the social role of a video conference. In fact, while an instructor carries out a class, based on either theory or exercises, it is noteworthy that this may not be comfortable for each of the attenders. A common mistake is likely made here in the sense that one assumes that virtual classes for a freshman student must be highly pleasant in all educational directions. A sensitive point in these virtual classes are the examinations. In 2020, various styles of examinations were undertaken, each carrying the risk that they may not be trusted as sincere qualifications. Thus, the application of virtual examinations might have not fulfilled the desire to know that one has truly learnt most parts of a course. Even with these subjective obstacles, courses in basic sciences such as physics and math implemented methodologies rather similar to the ordinary ones that kept up a face-to-face style, yielding interesting results.
3. Measuring the Satisfaction of Students
It is common that subjectivity cannot be measured in terms of numbers. Even in people with different levels of satisfaction or dissatisfaction, the measurements of a group turn out to be clouded by the presence of hidden variables that cannot be seen at a first glance.
Instead of that mentioned above, this study has opted to take probabilities as a firm basis to measure the levels of acceptance in freshman students and how, with these different levels of acceptance, one can build a mathematical methodology that allows us to identify the probability of desertion by also using the listed variables in Table 1.
A naïve manner to introduce mathematics in the construction of a phenomenological equation that yields reasonable probabilities of desertion [18] can be detailed as follows:
where is the probability of acceptance and and are the number of satisfied and unsatisfied students, respectively. A first equation can be arrived at below:
An unfortunate case is where u ≫ s, which makes sense only if the number of unsatisfied students is large in comparison with the satisfied ones. In this manner, the following can be described:
The following is the expansion in a series of the well-known exponential function:
With this, Equation (1), the dissatisfaction probability, can be written now as follows:
Equation (4) might be seen as a simple mathematical expression. However, for the purpose of this study, the exact values of both “s” and “u” are required. Over the course of a semester of virtual classes, these quantities may have either oscillated or been constant. In this manner, one can state that these numbers depend on time. Thus emerges the question: how to measure these quantities in an accurate way? In addition, Equation (4) can also be written as a satisfaction probability:
by which one can test that the sum of , which constitutes the starting point of the next section. Certainly, the involved probabilities should be dependent upon time. This point is boarded below.
Probability of Desertion
Equations (4) and (5) constitute the basic definitions towards a solid relationship that can communicate to us, to some extent, the feasibility of having a quantitative idea of desertion.
In virtue of the above equations, one can define the following:
where the constant is a kind of weight in the formulation. In order to illustrate Equation (6), one can assume the limit case where u = s. It yields the following:
so that, if , then one has a probability of desertion of 50%. Clearly, one has ignored tangible details that denote the true causes of possible desertion. Then, one can wonder about all these details and how they can all be entered into a pure mathematical description, as is given in all of the above equations.
Consequently, one can see the entire responsibility of the constants and . Again, from experience, one can state that the disagreement and nonconformity with the virtual sessions might not be constant throughout the academic semester, but is also under variation based on time.
Then, one finds that the time as an independent variable cannot be incorporated in a straightforward manner inside the arguments of exponentials in Equation (6).
Alternatively, one can opt for the variables of Table 1: (i) the type of video conference and (ii) confidence in examinations. In virtue of Equation (7), a liner model of desertion can be written below:
where, while dissatisfaction increases linearly with time, satisfaction depends directly on , with n being an integer number that, in Equation (8), is assumed to be negative, and ∆ is a kind of error with the identification of the true number of students that are satisfied with virtual classes.
Consider the case that no error is perceived and the probability of desertion is free of errors. Thus, one may obtain below the normalized probability of desertion:
where and . On the other hand, the factor 1/0.8 is required to normalize to unity. In Figure 1, one can see the different distributions of the probability of desertion based on Equation (9) for q = 1, 2, 3, and 4. While the green color distribution clearly increases with q = 1, the orange color decreases with q = 4.
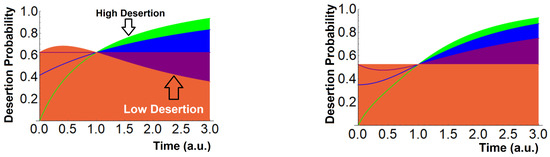
Figure 1.
(left) The different distributions of probability for 4 values of integer “q” according to Equation (9). Here q = 1, 2, 3 and 4 for colors green, blue, magenta and orange, respectively. The arrows indicate high and low desertion. (right) Plotting of Equation (9) with the quadratic terms in “t”. The orange color denotes the scenario where desertion is not well defined. Green, blue and magenta are denoting scenarios of high desertion.
In Figure 2, Equation (9) has been plotted, but with the case where . The quadratic case is of interest because it exhibits a rapid increase in desertion despite the fact that the term increases with q > 2. Thus, in Figure 2, the orange color appears to be constant at around 50%. Then, one can wonder which parameter from Equation (8) can be changed in order to decrease the probability of desertion. In fact, the parameter “a” as well as can be slightly varied according to the variables listed in Table 1. The results of an applied survey for 78 physics students are detailed below.
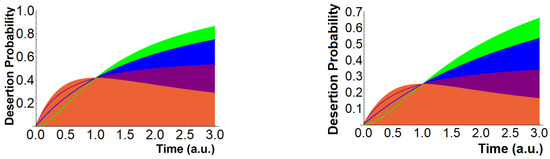
Figure 2.
(left) Distributions of probability of desertion, where 1 is the entire acceptance of students on a physics course (2020). The influence of constant “a” equal to 0.001 is seen as a kind of alleviation. Here q = 1, 2, 3 and 4 for colors green, blue, magenta and orange, respectively. (right) The case when where the desertion appears to be lower than previous cases. The role of the university is assumed to manage the academic level in order to maintain the attention of students and avoid their desertion.
4. Alternatives Scenarios of Desertion
As stated above, one can define the free parameters “a” and to acquire a set of values that decrease the probability of desertion [19]. In this way, one can write below that
where , and are the number of students that are not satisfied with the video-conference software (or do not like it), the number of students that approve of the content of the course (see Table 2), and the ones that do not agree with virtual classes, respectively. For example, the case where represents a high percent of order of 80% up to 90% tells us that is a large number, whereas would represent a minimum number; then, “a” acquires a small size. With this in mind, the resultant probabilities can be seen in Figure 2. In fact, from Equation (10), one can obtain a value for “a” = 0.01; the distributions of Figure 2 based on the equation are written below:
Table 2.
Variables for freshman students.
In Figure 2 (left), one can see a kind of acceptance of the virtual classes in the freshman students. Only the green color, that is, the case of “q = 1”, turns out to be above 50%. The blue and other colors range between 35% and 65%, expressing the fact that an excellent presentation of the course content might guarantee, to some extent, the minimization of the number of desertions.
On the other hand, the case that is proportional to “t”, the time, is of interest for this study. In this manner, the term “t” becomes “0.5 t”, acquiring the following form:
In Figure 2 (right), the resulting probabilities from Equation (12) are plotted. In comparison to previous plots, this case turns out to be optimal in the sense that the number of desertions might be at the mid-range of the probabilities, around 50%. However, the orange color displays the range of less than 25%, indicating that one of four students is likely willing to abandon their university studies. In respect of the shape of the distributions of probability, one can see that the mathematical function modeling the willingness to desert of freshman students can be somewhat given as
with ““ being a constant of normalization, and and are defined above. While the tanh distribution denotes the deserters, the negative exponential explains the expected behavior to decrease desertion through the parameter “”.
5. Conclusions
The present study consisted of a quantitative analysis of a set of mathematical models that may shed light on the problem of desertion amongst freshman students at a private university located in south Lima. Essentially, a sample of 78 students was considered over the course of the 2020 academic year, encompassing the very beginning of the COVID-19 pandemic.
The main variables used within the mathematical model are (i) satisfaction and (ii) dissatisfaction. It is assumed and is the argument of this paper that if this information is possible to identify through well-designed surveys aimed at students throughout a course, then by using the information that there exists a number of unsatisfied students, a rapid response on the side of the instructor or teacher should be undertaken. As seen in Table 2 above the content of a course and how it is presented would be a valuable to be considered in order to avoid desertion. Furthermore, the applied survey also determined that the style in which a teacher or instructor carries out their class would be an interesting point to be considered in the future. Nevertheless, the pandemic blocked all available ways to avoid the imminent, undesired fact of the desertion of freshman students [20].
Funding
This research received no external funding.
Institutional Review Board Statement
Not applicable.
Informed Consent Statement
Not applicable.
Data Availability Statement
Data are contained within the article.
Conflicts of Interest
The author declares no conflict of interest.
References
- Bahl, P.; Doolan, C.; De Silva, C.; Chughtai, A.A.; Bourouiba, L.; MacIntyre, C.R. Airborne or droplet precautions for health workers treating coronavirus disease 2019? J. Infect. Dis. 2020, 225, 1561–1568. [Google Scholar] [CrossRef] [PubMed]
- Bourouiba, L. Turbulent gas clouds and respiratory pathogen emissions: Potential implications for reducing transmission of COVID-19. JAMA 2020, 323, 1837–1838. [Google Scholar] [CrossRef] [PubMed]
- Mittal, R.; Ni, R.; Seo, J. The flow physics of COVID-19. J. Fluid Mech. 2020, 894, F2. [Google Scholar] [CrossRef]
- Lewis, D. Mounting evidence suggests coronavirus is airborne—But health advice has not caught up. Nature 2020, 583, 510–513. [Google Scholar] [CrossRef] [PubMed]
- Seminara, G.; Carli, B.; Forni, G.; Fuzzi, S.; Mazzino, A.; Rinaldo, A. Biological fluid dynamics of airborne COVID-19 infection. Rend. Fis. Acc. Lincei 2020, 31, 505–537. [Google Scholar] [CrossRef] [PubMed]
- Dietz, L.; Horve, P.F.; Coil, D.A.; Fretz, M.; Eisen, J.A.; Van Den Wymelenberg, K. 2019 novel coronavirus (COVID-19) pandemic: Built environment considerations to reduce transmission. mSystems 2020, 5, e00245-20. [Google Scholar] [CrossRef] [PubMed]
- The World Health Organisation. Coronavirus Disease (COVID-19)_Advice_for_the_Public. 2020. Available online: https://www.who.int/emergencies/diseases/novel-coronavirus-2019/advice-for-public (accessed on 1 July 2022).
- Hoehl, S.; Rabenau, H.; Berger, A.; Kortenbusch, M.; Cinatl, J.; Bojkova, D.; Behrens, P.; Böddinghaus, B.; Götsch, U.; Naujoks, F.; et al. Evidence of SARS-CoV-2 infection in returning travelers from Wuhan, China. N. Engl. J. Med. 2020, 382, 1278–1280. [Google Scholar] [CrossRef] [PubMed]
- Lai, C.C.; Liu, Y.H.; Wang, C.-Y.; Wang, Y.-H.; Hsueh, S.-C.; Yen, M.-Y.; Ko, W.-C.; Hsueh, P.-R. Asymptomatic carrier state, acute respiratory disease, and pneumonia due to severe acute respiratory syndrome coronavirus 2 (SARS-CoV-2): Facts and myths. J. Microbiol. Immunol. Infect. 2020, 53, 404–412. [Google Scholar] [CrossRef] [PubMed]
- Sohrabi, C.; Alsafi, Z.; O’Neill, N.; Khan, M.; Kerwan, A.; Al-Jabir, A.; Iosifidis, C.; Agha, R. World Health Organization declares global emergency: A review of the 2019 novel coronavirus (COVID-19). Int. J. Surg. 2020, 76, 71–76. [Google Scholar] [CrossRef] [PubMed]
- Kita, Y.; Yasuda, S.; Gherghel, C. Online education and the mental health of faculty during the COVID-19 pandemic in Japan. Sci. Rep. 2022, 12, 8990. [Google Scholar] [CrossRef] [PubMed]
- Wang, Z.H.; Wang, Z.-H.; Yang, H.-L.; Yang, Y.-Q.; Liu, D.; Li, Z.-H.; Zhang, X.-R.; Zhang, Y.-J.; Shen, D.; Chen, P.-L.; et al. Prevalence of anxiety and depression symptom, and the demands for psychological knowledge and interventions in college students during COVID-19 epidemic: A large cross-sectional study. J. Affect. Disord. 2020, 275, 188–193. [Google Scholar] [CrossRef] [PubMed]
- Aguilera-Hermida, A.P. College students’ use and acceptance of emergency online learning due to COVID-19. Int. J. Educ. Res. Open 2020, 1, 100011. [Google Scholar] [CrossRef] [PubMed]
- Rogowska, A.M.; Kuśnierz, C.; Bokszczanin, A. Examining anxiety, life satisfaction, general health, stress and coping styles during COVID-19 pandemic in Polish sample of university students. Psychol. Res. Behav. Manag. 2020, 13, 797–811. [Google Scholar] [CrossRef] [PubMed]
- Son, C.; Hegde, S.; Smith, A.; Wang, X.; Sasangohar, F. Effects of COVID-19 on college students’ mental health in the United States: Interview survey study. J. Med. Internet Res. 2020, 22, e21279. [Google Scholar] [CrossRef] [PubMed]
- Nieto-Chaupis, H. Quantifying and Modeling the Measurement of the Quality of Education in Electrical Engineering Programs: A Heuristic Approach. In Proceedings of the 2018 IEEE XXV International Conference on Electronics, Electrical Engineering and Computing (INTERCON), Lima, Peru, 8–10 August 2018; pp. 1–4. [Google Scholar] [CrossRef]
- Nieto-Chaupis, H. Experiences on the quality of education assessment in a network engineering program in Lima city. In Proceedings of the 2017 IEEE URUCON, Montevideo, Uruguay, 23–25 October 2017; pp. 1–4. [Google Scholar] [CrossRef]
- Merchán Rubiano, S.M.; López-Cruz, O.; Gómez Soto, E. Teaching computer programming: Practices, difficulties and opportunities. In Proceedings of the 2015 IEEE Frontiers in Education Conference (FIE), El Paso, TX, USA, 21–24 October 2015; pp. 1–9. [Google Scholar] [CrossRef]
- Da Costa, F.J.; de Souza Bispo, M.; de Faria Pereira, R.d.C. Dropout and retention of undergraduate students in management: A study at a Brazilian Federal University. RAUSP Manag. J. 2018, 53, 74–85. [Google Scholar] [CrossRef]
- Palacios, C.A.; Reyes-Suárez, J.A.; Bearzotti, L.A.; Leiva, V.; Marchant, C. Knowledge Discovery for Higher Education Student Retention Based on Data Mining: Machine Learning Algorithms and Case Study in Chile. Entropy 2021, 23, 485. [Google Scholar] [CrossRef] [PubMed]


Disclaimer/Publisher’s Note: The statements, opinions and data contained in all publications are solely those of the individual author(s) and contributor(s) and not of MDPI and/or the editor(s). MDPI and/or the editor(s) disclaim responsibility for any injury to people or property resulting from any ideas, methods, instructions or products referred to in the content. |
© 2023 by the author. Licensee MDPI, Basel, Switzerland. This article is an open access article distributed under the terms and conditions of the Creative Commons Attribution (CC BY) license (https://creativecommons.org/licenses/by/4.0/).