Proceeding Paper

Analyzing Temperature Variations in Different Locations within Allegheny County and Its Surrounding Area: The Influence of Methane Emission and the Relationship with Relative Humidity †

1
Department of Civil Engineering, Bangladesh University of Engineering and Technology, Dhaka 1000, Bangladesh
2
Department of Geography and Environment, Jagannath University, Dhaka 1000, Bangladesh
3
Institute of Water and Flood Management, Bangladesh University of Engineering and Technology, Dhaka 1000, Bangladesh
*
Author to whom correspondence should be addressed.
Presented at the 4th International Electronic Conference on Applied Sciences, 27 October–10 November 2023; Available online: https://asec2023.sciforum.net/.
Eng. Proc. 2023, 56(1), 266; https://doi.org/10.3390/ASEC2023-15337
Published: 26 October 2023
(This article belongs to the Proceedings of The 4th International Electronic Conference on Applied Sciences)

Abstract

:
Global warming is a prominent concern receiving attention. Temperature fluctuations, even within close geographical positions, result from diverse elements affecting heat absorption and reflection. Urban areas tend to experience higher average temperatures than rural areas because of increased human activities, this phenomenon is known as the urban heat island effect. Various air quality assessment techniques indicate that methane emissions are higher in urban regions compared to rural areas due to increased usage of natural gas for heating, cooking, and electricity generation, as well as the higher concentration of landfills, wastewater treatment plants vehicular traffic, and livestock farms. This study mainly focuses on methane emission as a parameter of local warming. Investigations reveal location-specific irregular trends in temperature, studying the link between relative methane concentration and temperature. The research, conducted over a five-year period, investigates the intricate relationships between methane levels, humidity, and temperature fluctuations and this detailed analysis offers a valuable perspective into the complexities of urban climates.

1. Introduction

Rapid urbanization is the process of increasing urban population and urban land area. Urban sprawl is a major driver of climate change. Urban areas are known to be warmer than their suburban and rural counterparts. This phenomenon is called the urban heat island effect [1]. The Urban Heat Island effect corresponding to the elevation of land surface temperatures profoundly alters urban ecological systems, as a chain of ecological and environmental consequences across various urban aspects has been triggered by this effect [2].
Relative humidity depends on topography to some extent, for example, relative humidity is markedly higher in valley bottoms and basins with low air movement [3]. Mold and mildew growth, wood rot, corrosion, and damage to materials and structures can be caused by excessive relative humidity. Low humidity can cause crop stress, droughts, and heat waves.
Temperature fluctuation between neighboring zones is mainly influenced by land use. To release 1 unit of energy, less carbon dioxide is released from methane compared to coal or oil. Natural gas is primarily composed of methane which is a potent greenhouse gas. Compared to carbon dioxide, methane has a greater capacity to trap heat [4].
The atmospheric tracer method is an integrated methodology by which methane emissions from natural gas infrastructure and metropolitan areas can be efficiently located and measured [5]. The implementation of the Global Warming Potential Star methodology provides a more realistic estimate in comparison to the traditional global warming potential 100-year method in the case of assessing the climate warming contribution of methane emissions from livestock production [6]. There is a nexus between anthropogenic heat flux and urban heat islands [7]. Existing research has focused on methane’s role in the atmosphere as a major contributor to global warming.
To assess medium-term changes in land surface temperatures, we utilized MODIS 8-day Land Surface Temperature data. Both datasets are accessible through Google Earth Engine (GEE), a cloud-based platform designed for geospatial analysis. GEE offers a diverse catalog of multi-source data and extensive computational capabilities, making it a valuable tool for exporting and analyzing data related to various societal and environmental issues [8]. The objective of the research is to provide rationales that variation of methane emission in different locations, has an apparent connection with contrast of temperature within closely spaced areas of Alleghany County and its surrounding areas, incorporating the linkage of relative humidity and disparity at day and night.

2. Methods

2.1. Data

This study mainly uses secondary data from satellites which are available on the internet. Data on relative humidity was provided in the CSV file for the same time, date, and location along with the temperature data. The data were sizable and unorganized. The file contained data on temperature and relative humidity for almost 87 locations from the time period December 2016 to December 2021. Within this period, temperature and relative humidity were recorded 15 min apart. With the help of data analysis tools, the massive data was cleaned and structured. The average monthly temperature was obtained for day and night separately.

2.2. Study Period and Study Area Selection

Though the provided file contained data for all 12 months, the data were discontinuous, therefore contrast between locations was analyzed for the hottest month, July, only. As the dataset was fragmented and the available data were focused on Allegheny County. So, Allegheny County, Pennsylvania was chosen as the study area.

2.3. Anomaly Detection

Anomaly detection is a crucial task in data mining that deals with identifying data points that deviate significantly from the rest of the data points. One of the methods for detecting anomalies is using trendlines. Trendlines are used to identify patterns in data and can be used to detect anomalies by comparing the actual data points with the predicted values [9].

2.4. Simulation by ArcMap

The sorted dataset was imported to ArcGIS. The spatial analysis was completed with the help of Arc Maps. Stretched values on the color ramp were used to overlay methane concentration data on ArcMap. The gradient maps are visual representations of temperature, relative humidity, and methane emission variations within adjacent regions. The color symbology was used to indicate temperature and relative humidity ranges [10].

2.5. Collection of Methane Emission Data

Leveraging the capabilities of Google Earth Engine, Synthetic Aperture Radar imagery helps to combine the benefits and coverage of free Sentinel 2 imagery, the parallel processing power of GEE cloud, and the accuracy of deep learning algorithms to develop models for slick behavior under diverse climatic and hydrodynamic conditions [11].
Sentinel-5P Precursor Offline Methane dataset has been used which provides offline high-resolution imagery of methane concentrations. Using the Google Earth engine, a raster image was prepared for the study area. After exporting it into ArcMap, 10.8 random 100 points were created and the temperature (°C) and methane concentration values of the same latitude and longitude were extracted and stored in a file. The Fifth Generation European Reanalysis (ERA5)-Land Monthly Aggregated dataset, provided by the European Centre for Medium-Range Weather Forecasts (ECMWF), offers a consistent perspective on the evolution of land variables over several decades. It provides enhanced resolution compared to ERA5. The asset which was used in this study was a monthly aggregate of ECMWF and ERA5 Land hourly assets which includes both flow and non-flow bands. Using this dataset we calculated the mean temperature of 2018–2022 and finally exported the data into ArcMap 10.8. Finally, we extracted the land surface temperature value for 100 points. The relation between the two variables, surface temperature, and corresponding methane emission was visualized through a scatterplot.

3. Results and Discussion

3.1. Data Analysis

The temperature, relative humidity, and daily methane emission were compared with the help of maps, and significant fluctuation was noticed in the nearby vicinity.

3.2. Excessively High or Low Temperature in Certain Locations during Daytime

By analyzing data from five years, the temperature was highest in Mckees Rock (33.47 °C) and lowest in 27 Coursin Road (25.2 °C). Beside that, the surface temperature was massively high in Sewickly_1, Market Square, and Uptown. From the map, we can observe that the day temperature was low in Brighton Heights, Aspinwall, Morris St EAW, 1500 Grant Street, and Goodman Street.

3.3. Excessively High or Low Temperature during Night

Observing the data from five years, night temperature was never below 19.72 °C or higher than 24.62 °C. So, it can be said that night temperature has been at a tolerable level within Alleghany County.

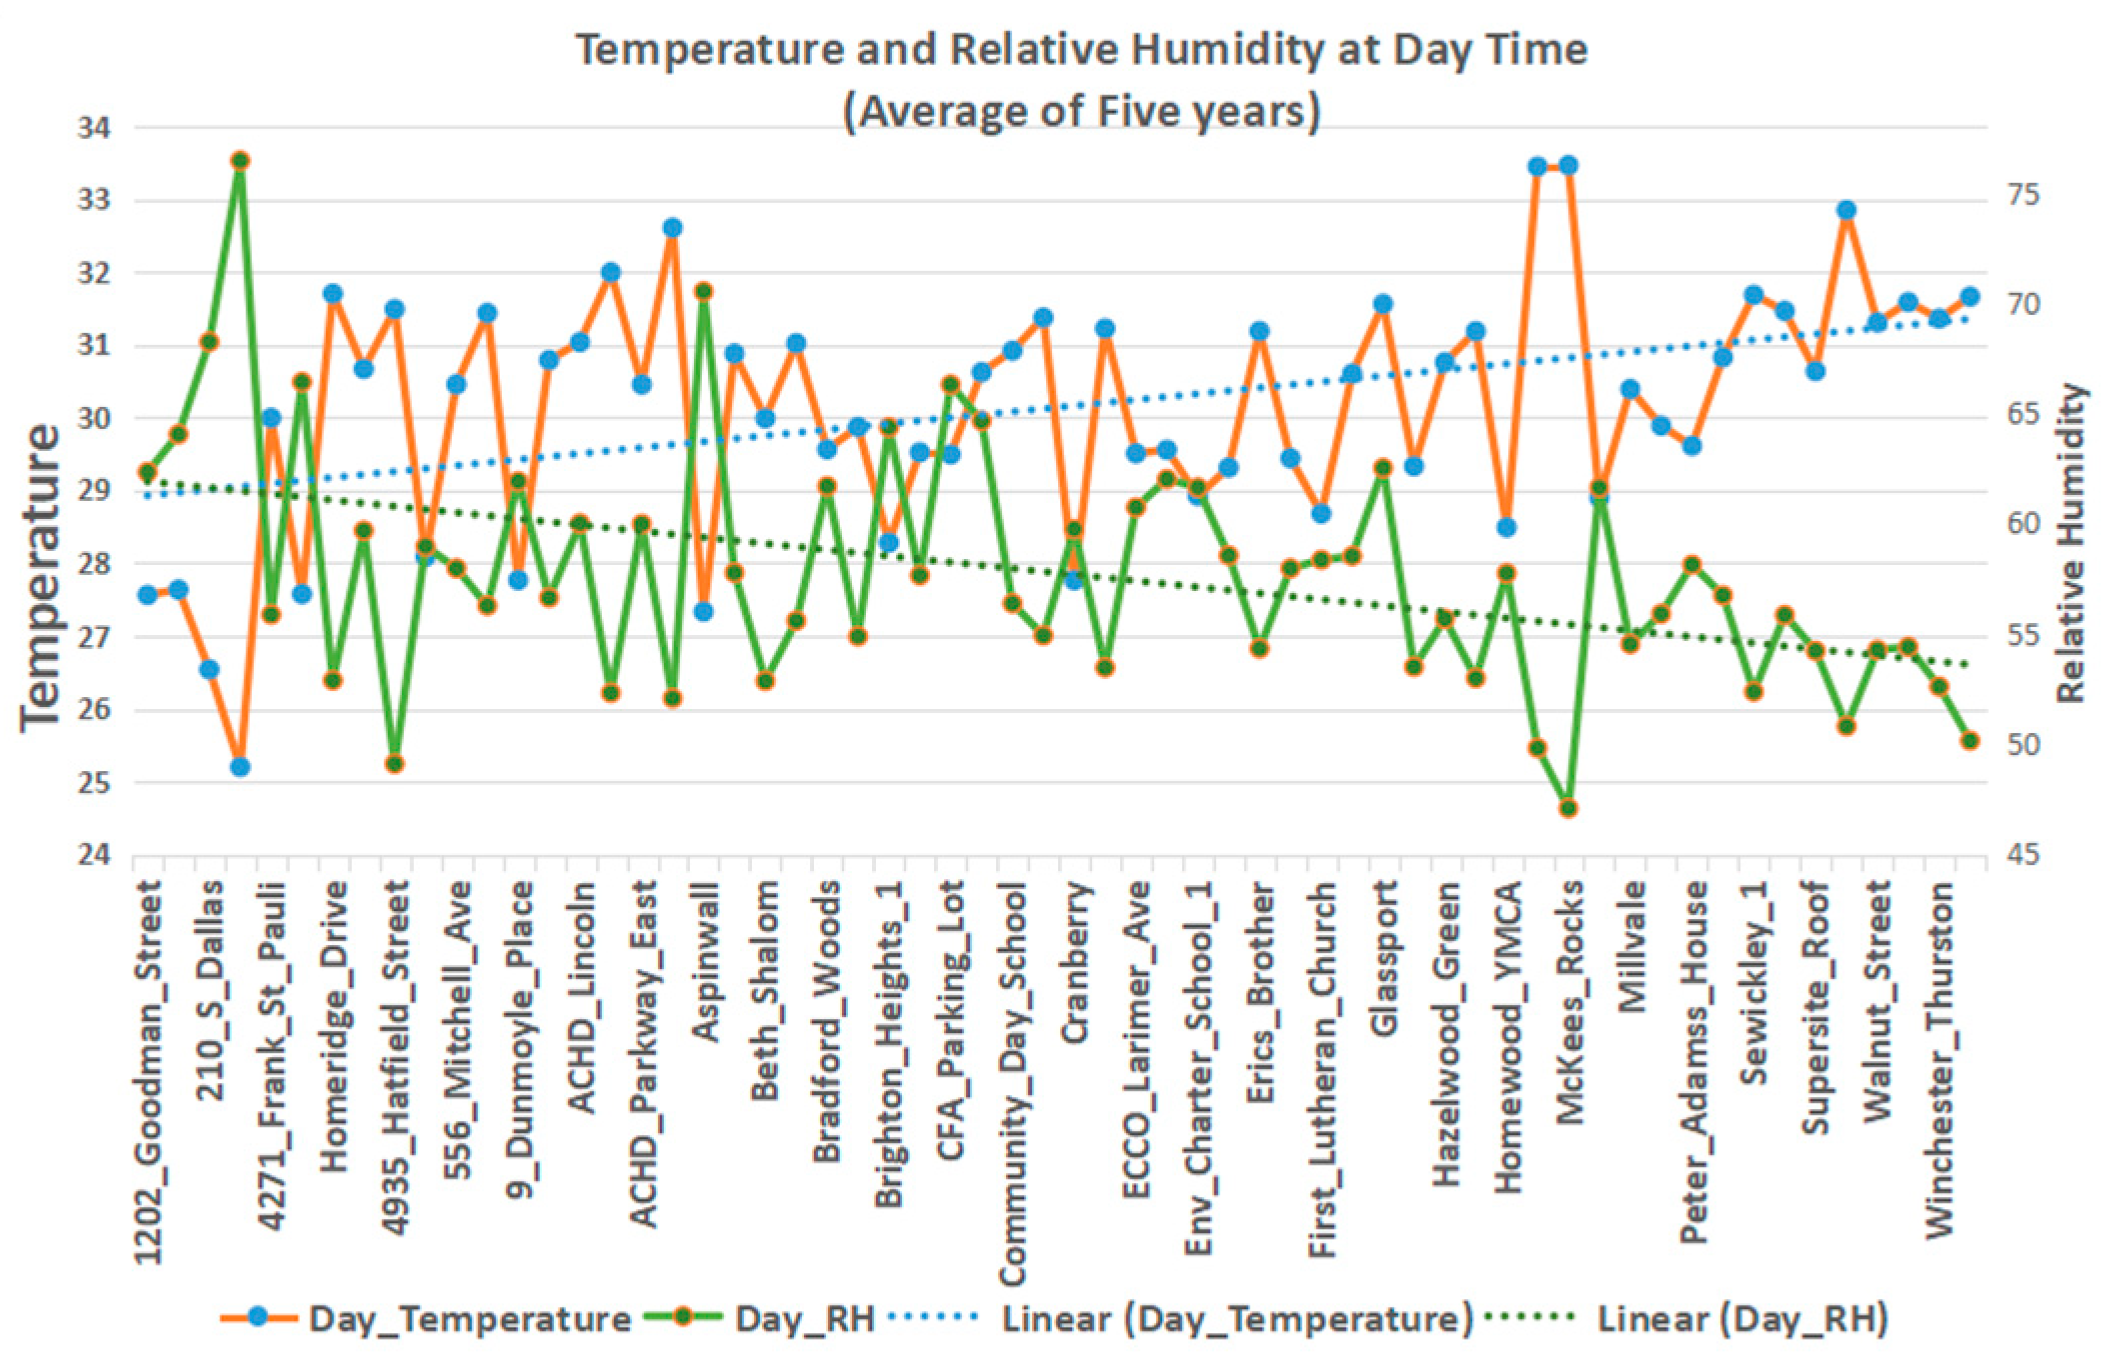
3.4. Excessively High or Low Relative Humidity during Day

During the daytime relative humidity was found to be lowest in Mckees Rock (47.08%) and highest at 27 Coursin Road (76.46). Other than that, comparatively low relative humidity can be observed at Sewickley_1, Uptown, and Market Square. On the other hand, relative humidity is higher in Brighton Heights, Aspinwall, 210_ allas, Morris St EAW, and Grant Street.

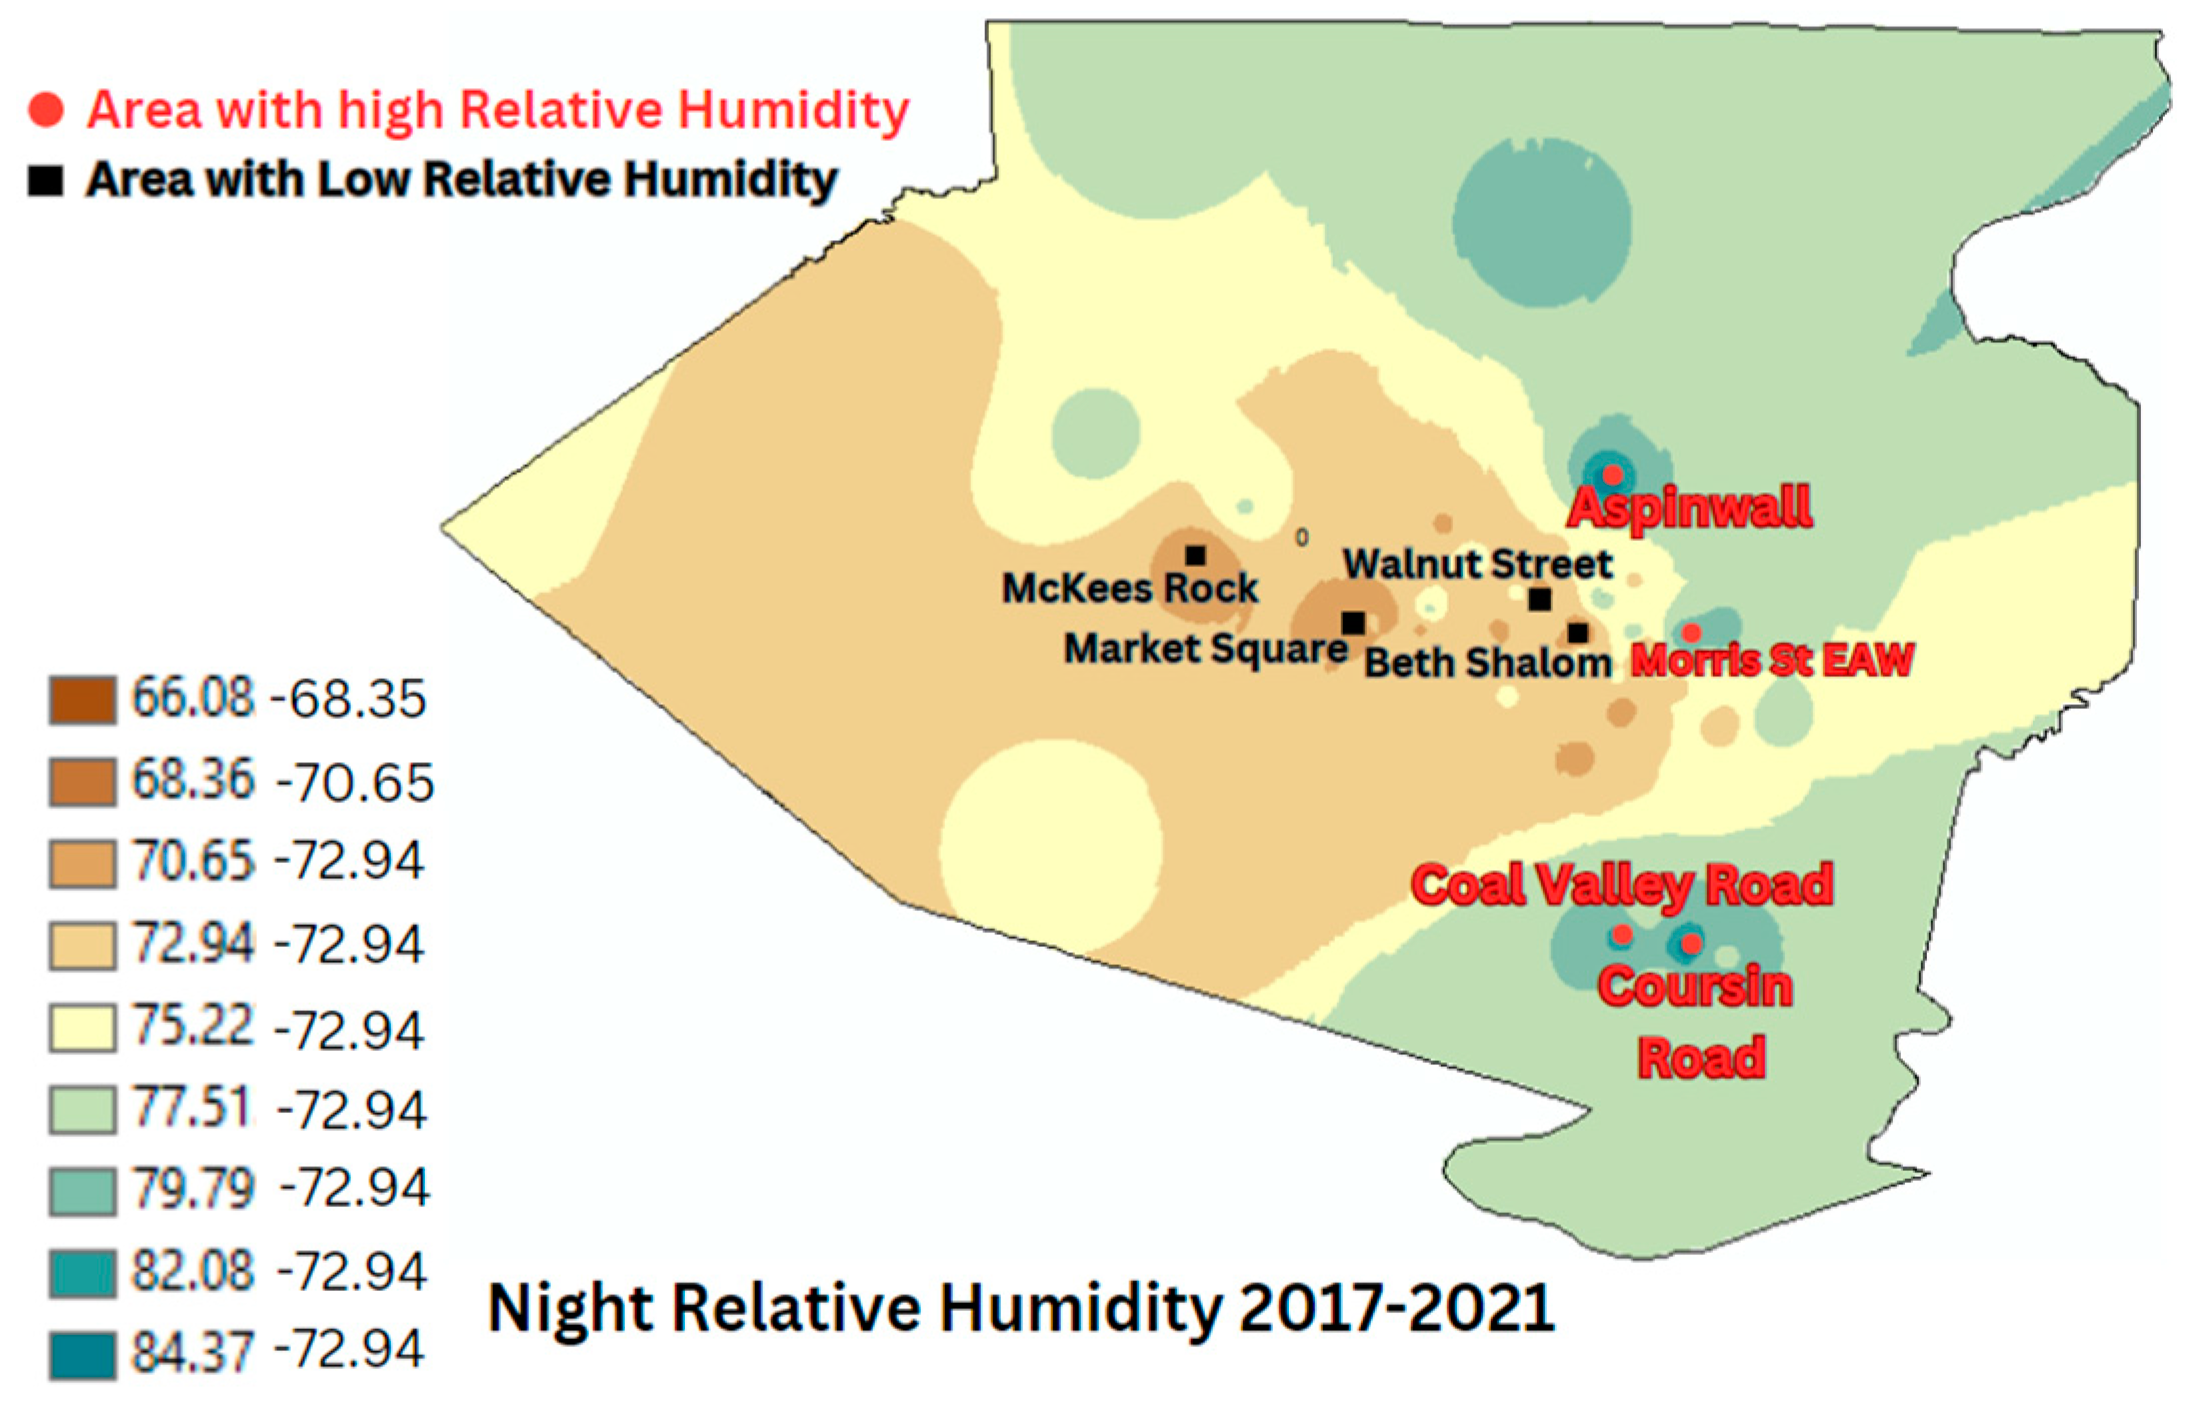
3.5. Excessively High or Low Relative Humidity during Night

During the night we can see that relative humidity was at a high level at Aspinwall, 27 Coursin Road, Morris St EAW, and Coal Valley Road. It is highest at 27 Coursin Road (86.68%). On the other hand, relative humidity at night was lowest in 210 Dallas (68.24%). Besides that, relative humidity was low at Mckees Rock, Market Square, Beth Shalom, and Walnut Street. For time period 2017–2021 the average temperature during day time, average night temperature, day time average relative humidity and night time average relative humidity are shown respectively in Figure 1, Figure 2, Figure 3 and Figure 4.

3.6. Relation of Relative Humidity with Temperature

The plots are drawn to indicate average temperature and relative humidity data for five years’ timespan. Separate plots are drawn for day and night. Though there is no definite relation between temperature and relative humidity, for most of the locations high relative humidity corresponds to low temperature. On the contrary, low relative humidity corresponds to high temperature. This is why the trendline for relative humidity has gone downwards and the trendline for temperature has gone upwards. Spatial variability such as geologic position, land use topographic condition, and terrain exposure such as solar exposure, wind exposure, terrain roughness, slope exposure, and hydrologic exposure are probable factors that influence the absolute and relative humidity, and those factors are also related to temperature. The outliers of the trendlines are 27 Coursin Raod with high daytime relative humidity and 4935 Hatfield Street, Market Square, and Mckees Rocks with very low daytime relative humidity. Excessive temperature has been observed in Alison Barth which is 32.6 °C Market Square which is 33.45 °C and in Mckees Rocks which is 33.47 °C. Some other anomalies detected in the trendline are 27 Coursin_Road (86.68%) and Aspinwall (86.05%) which show higher relative humidity than other points and Beth Shalom (65.61%) which displays excessively low relative humidity at night. For timespan 2017–2021, relation of average relative humidity with average day temperature and relation of average relative humidity with average night temperature are depicted in Figure 5 and Figure 6.

3.7. Methane Emission

From Figure 7, it can be observed that methane emission is comparatively less in Franklin Park, Pine and McCandless, and West Alleghany, whereas methane concentration is high at Pittsburgh, Baldwin Whitehall, and Brentwood Borough SD. As for the rest of the areas in Alleghany County, methane emission is at a moderate level.

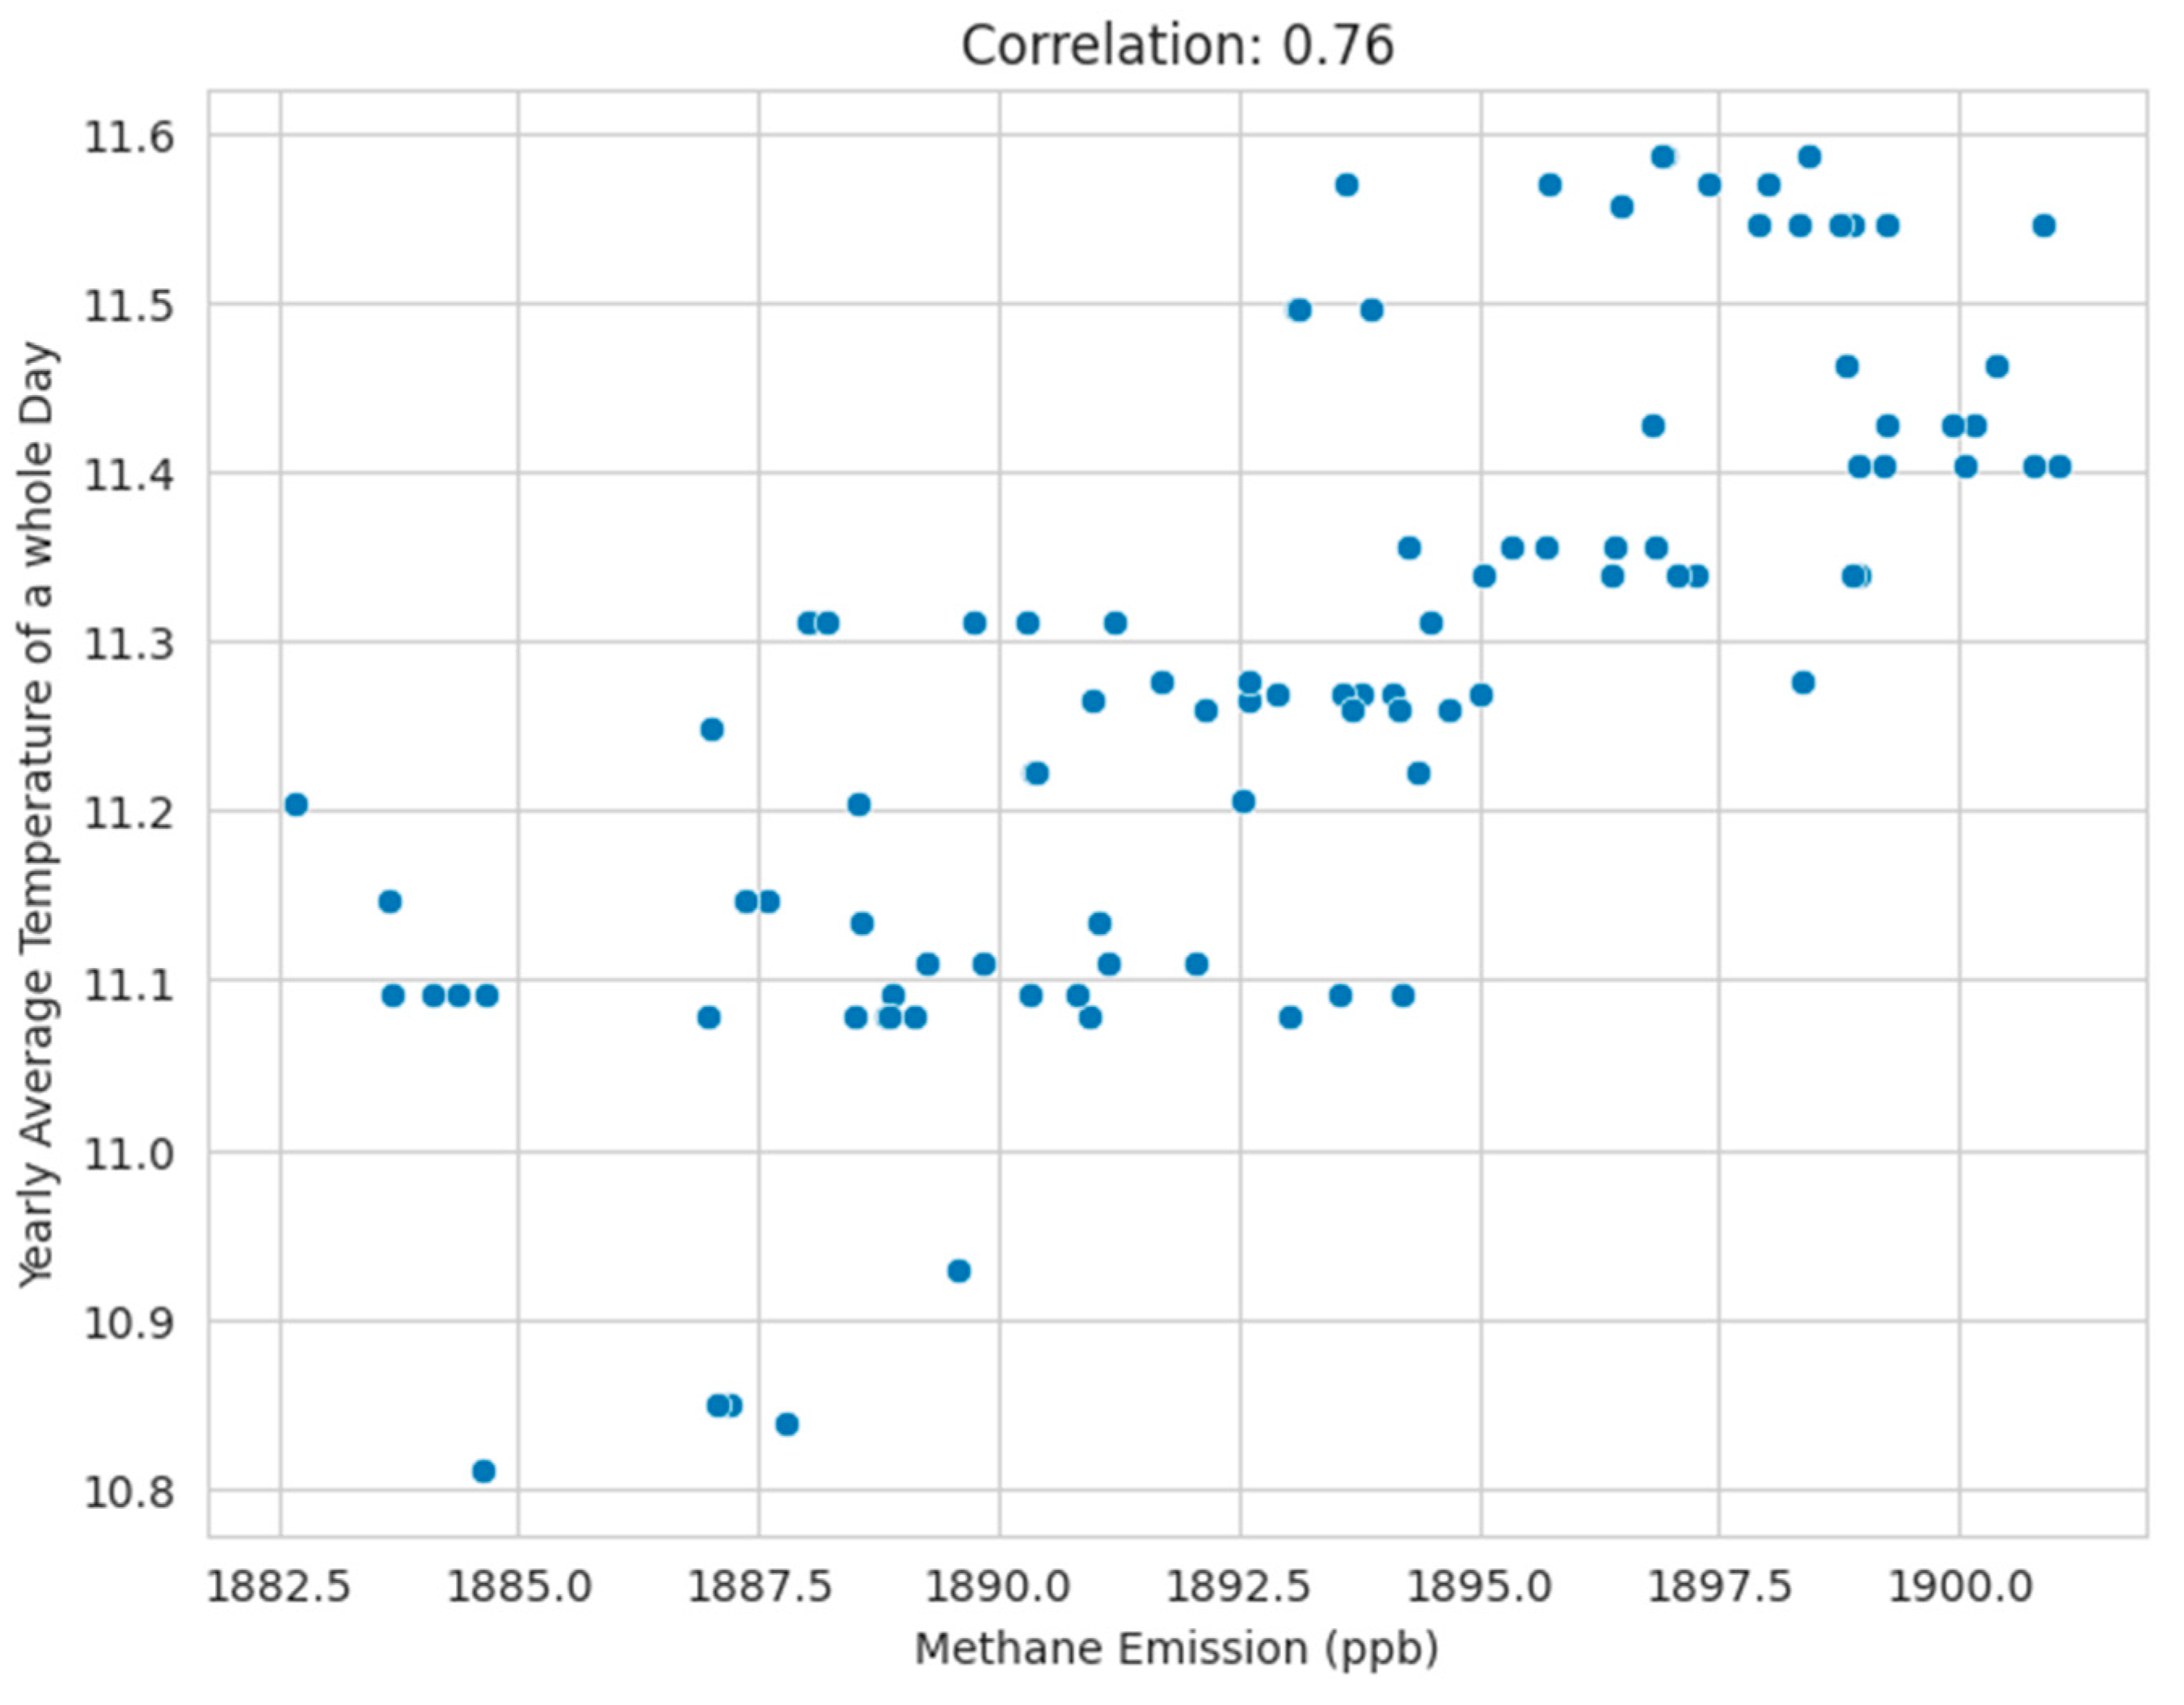
3.8. Relation of Temperature with Methane Emission

The scatterplot displays a connection between two variables, the yearly average temperature and daily methane emission (in ppb) of the same place. The Pearson correlation coefficient is used to show the strength and direction of the linear relationship of these two variables. The correlation of yearly temperature with methane emission is displayed in Figure 8.
The influence of heat cannot be solely attributed to sunlight levels as there are other significant factors to be considered. The Pearson correlation coefficient was found to be 0.76, which indicates a strong positive linear relationship. The Pearson correlation shown in this research is based on empirical data. The remote sensing data used in this correlation study are worth producing desired outcomes. The positive sign of the correlation coefficient indicates that as the average methane emission per day increases, the yearly average temperature is likely to increase as well.

4. Conclusions

This study mainly covered the indications that, even in geographically proximate regions where sunlight intensity is almost the same, temperature can vary up to 4 °C or 5 °C and the relative humidity can differ as much as 17%. This sharp contrast is exhibited within contiguous zones due to several variables among which methane concentration is likely to be a significant factor according to the analysis that this research shows. Methane has 28 times the global warming potential of carbon dioxide over a 100-year timeline and at the same time, it is 84 times more potent on a 20-year timescale [12]. Methane’s molar heat capacity at constant pressure (Cp,m) is approximately 35.8 J/mol K. On the other hand, the molar heat capacity of methane at constant volume (Cv,m) is approximately 27.4 J/mol K [13]. The gradient maps along with the trendlines provide grounds for a connection between relative humidity and methane concentration with temperature, as the relative humidity shows the opposite trend with temperature and methane shows a positive correlation. Hence, there are strong grounds for disparity of temperature within different locations in our study area. Further assessment of data provided by Google Earth Engine was helpful in deriving concise deductions to rely on. To extract data from Google Earth Engine, complex algorithms were applied and as a result, the obtained deduction from the analysis of these data were reliable. Our findings might have significant implications for understanding and mitigating the effects of climate change as methane is a powerful greenhouse gas that traps heat in the atmosphere. Notably, regions with elevated temperatures tend to display a higher vapor-holding capacity in the air, resulting in lower humidity levels compared to the saturation point. A higher degree of relative humidity may have negative effects on human health, comfort, productivity, and ecosystems. Other air quality parameters, surface features and meteorological factors must also be considered alongside relative humidity and methane to fully identify the causes of local warming.

Author Contributions

Conceptualization, L.A.; methodology, L.A.; software, L.A., F.H.S. and R.M.; validation, L.A. and R.M.; formal analysis, L.A.; data curation, L.A.; Data Collection L.A. and F.H.S.; writing—original draft preparation, L.A.; writing—review and editing, L.A. and R.M.; visualization, L.A.; All authors have read and agreed to the published version of the manuscript.

Funding

This research received no external funding.

Institutional Review Board Statement

Not applicable.

Informed Consent Statement

Not applicable.

Data Availability Statement

Data can be made available upon request.

Acknowledgments

We thank the Provat Kumar Saha, Department of Civil engineering, Bangladesh University of Engineering and Technology for sharing the satellite data which made this study possible.

Conflicts of Interest

The authors declare no conflict of interest.

References

  1. Burnett, C.; Blaschke, T. A multi-scale segmentation/object relationship modelling methodology for landscape analysis. Ecol. Modell. 2003, 168, 233–249. [Google Scholar] [CrossRef]
  2. Yang, L.; Qian, F.; Song, D.X.; Zheng, K.J. Research on urban heat-island effect. Procedia Eng. 2016, 169, 11–18. [Google Scholar] [CrossRef]
  3. Ferrante, A.; Mariani, L. Agronomic Management for Enhancing Plant Tolerance to Abiotic Stresses: High and Low Values of Temperature, Light Intensity, and Relative Humidity. Horticulturae 2018, 4, 21. [Google Scholar] [CrossRef]
  4. Howarth, R.W. A bridge to nowhere: Methane emissions and the greenhouse gas footprint of natural gas. Energy Sci. Eng. 2014, 2, 47–60. [Google Scholar] [CrossRef]
  5. Lamb, B.K.; McManus, J.B.; Shorter, J.H.; Kolb, C.E.; Mosher, B.; Harriss, R.C.; Zimmerman, P. Development of atmospheric tracer methods to measure methane emissions from natural gas facilities and urban areas. Environ. Sci. Technol. 1995, 29, 1468–1479. [Google Scholar] [CrossRef] [PubMed]
  6. Beck, M.R.; Thompson, L.R.; Rowntree, J.E.; Campbell, T.N.; Koziel, J.A.; Place, S.E.; Stackhouse-Lawson, K.R. US manure methane emissions represent a greater contributor to implied climate warming than enteric methane emissions using the global warming potential* methodology. Front. Sustain. Food Syst. 2023, 7, 1209541. [Google Scholar] [CrossRef]
  7. Sarda, R.; Pal, S. Nexus Between Anthropogenic Heat Flux and Urban Heat Island. In Advancements in Urban Environmental Studies: Application of Geospatial Technology and Artificial Intelligence in Urban Studies; Springer International Publishing: Cham, Switzerland, 2023; pp. 301–324. [Google Scholar]
  8. Gorelick, N. Google Earth Engine: Planetary-scale geospatial analysis for everyone. Remote Sens. Environ. 2017, 202, 18–27. [Google Scholar] [CrossRef]
  9. Samariya, D.; Thakkar, A. A Comprehensive Survey of Anomaly Detection Algorithms. Ann. Data Sci. 2023, 10, 829–850. [Google Scholar] [CrossRef]
  10. Vineesha, S. Estimating land surface temperature in ArcGIS using Landsat-8, Hoshangabad district, (Madhya Pradesh). Int. J. Appl. Res. 2017, 3, 1374–1379. [Google Scholar]
  11. Hernández-Hamón, H.; Ramírez, P.Z.; Zaraza, M.; Micallef, A. Google Earth Engine app using Sentinel 1 SAR and deep learning for ocean seep methane detection and monitoring. Remote Sens. Appl. Soc. Environ. 2023, 32, 101036. [Google Scholar] [CrossRef]
  12. European Commission. Available online: https://energy.ec.europa.eu/newsletters_en (accessed on 20 October 2023).
  13. Methane–Density–Heat Capacity–Thermal Conductivity. Available online: https://material-properties.org/methane-density-heat-capacity-thermal-conductivity/?fbclid=IwAR3MrFAHMWZJgFwLgDA6Q9ngsGsQXPEYUhjs4i5Xze8bzbB-KYfcPc4cd_k (accessed on 20 October 2023).
Figure 1. Day Average Temperature 2017–2021.
Engproc 56 00266 g001
Figure 2. Average Night Temperature 2017–2021.
Engproc 56 00266 g002
Figure 3. Daytime Average relative humidity 2017–2021.
Engproc 56 00266 g003
Figure 4. Average Night Time Relative Humidity 2017–2021.
Engproc 56 00266 g004
Figure 5. Relation of relative humidity with day temperature.
Engproc 56 00266 g005
Figure 6. Relation of Relative Humidity With Temperature During Night.
Engproc 56 00266 g006
Figure 7. Methane Emission(ppb) Per Day in Different Locations of Alleghany County.
Engproc 56 00266 g007
Figure 8. Correlation of Yearly Temperature with Methane Emission.
Engproc 56 00266 g008
Disclaimer/Publisher’s Note: The statements, opinions and data contained in all publications are solely those of the individual author(s) and contributor(s) and not of MDPI and/or the editor(s). MDPI and/or the editor(s) disclaim responsibility for any injury to people or property resulting from any ideas, methods, instructions or products referred to in the content.

