Proceeding Paper

Modeling and Optimizing the Performance of an Industrial Trigeneration Unit †

Department of Chemical and Biochemical Engineering, Faculty of Chemical and Food Technology, Slovak University of Technology, Radlinského 9, 821 37 Bratislava, Slovakia
*
Author to whom correspondence should be addressed.
Presented at the 4th International Electronic Conference on Applied Sciences, 27 October–10 November 2023; Available online: https://asec2023.sciforum.net/.
Eng. Proc. 2023, 56(1), 37; https://doi.org/10.3390/ASEC2023-15409
Published: 27 October 2023
(This article belongs to the Proceedings of The 4th International Electronic Conference on Applied Sciences)

Abstract

:
Trigeneration provides an effective means of power, heat, and cold production on site. Proper design and well-managed operation of such units can bring in substantial savings in consumed primary energy as well as in the amount of greenhouse gases released to the atmosphere, compared to separate production of all three media. The studied sub-MW-sized trigeneration unit comprises an internal combustion engine combined with an absorption chiller and a heat management system, delivering all three media to a nearby industrial facility. A mathematical model is developed based on available design and process data, a profit function is set up, and the subsequent sensitivity analysis of economic parameters is realized. The lowered efficiency of summer operation is analyzed, and a suitable solution is proposed, with an estimated total investment cost of EUR 114,000 and an anticipated simple payback period less than 2 years.

1. Introduction

The constant increase in energy prices forces consumers to operate more efficiently and sustainably. The industry sector in the European Union was responsible for 26.1% of the total energy consumption in 2020, with electricity and natural gas making up more than 60% (6000 PJ) [1]. Therefore, it is important to reduce the use of energy and fuels. Additionally, due to the developing environmental crisis, it is crucial to decrease the production of greenhouse gas emissions. Trigeneration is a combined cooling, heating, and power (CCHP) production from one or more energy sources. A common trigeneration unit consists of a cogeneration unit (CHP) in combination with an absorption chiller [2]. The sources of energy in CCHP vary from fossil fuels, e.g., oil, coal, or natural gas (NG), to renewables [3]. Additionally, it depends on whether the unit is installed in a residential sector, a small industrial sector, or in a large industry. The design and management of the trigeneration unit is a challenging task because the heat and cold consumption in both industrial and residential applications vary on an hourly or daily basis [4,5].
Alongside an increased overall efficiency, CCHP also offers a reduction in greenhouse gas emissions [6,7]. Usually, the overall efficiency of CCHP varies from 80% to 93% [8] and the efficiency of the CHP itself can reach 80% [3,6]. For a comparison, a conventional power plant where no heat or cold is produced reaches an efficiency from 27% to 40% [9,10]. A decreased CCHP efficiency may result from off-design operations and may negate the expected economic and environmental benefits. An example of this is a summer operation, when space heating is not required, and cold production unit is unable to consume heat produced at the nominal CCHP load.
This work analyzes the operation of an industrial trigeneration unit and proposes means of its improvement by debottlenecking the current design. A simple linear model is developed to describe the main features of the CCHP operation, yielding a profit function and enabling profit maximization.

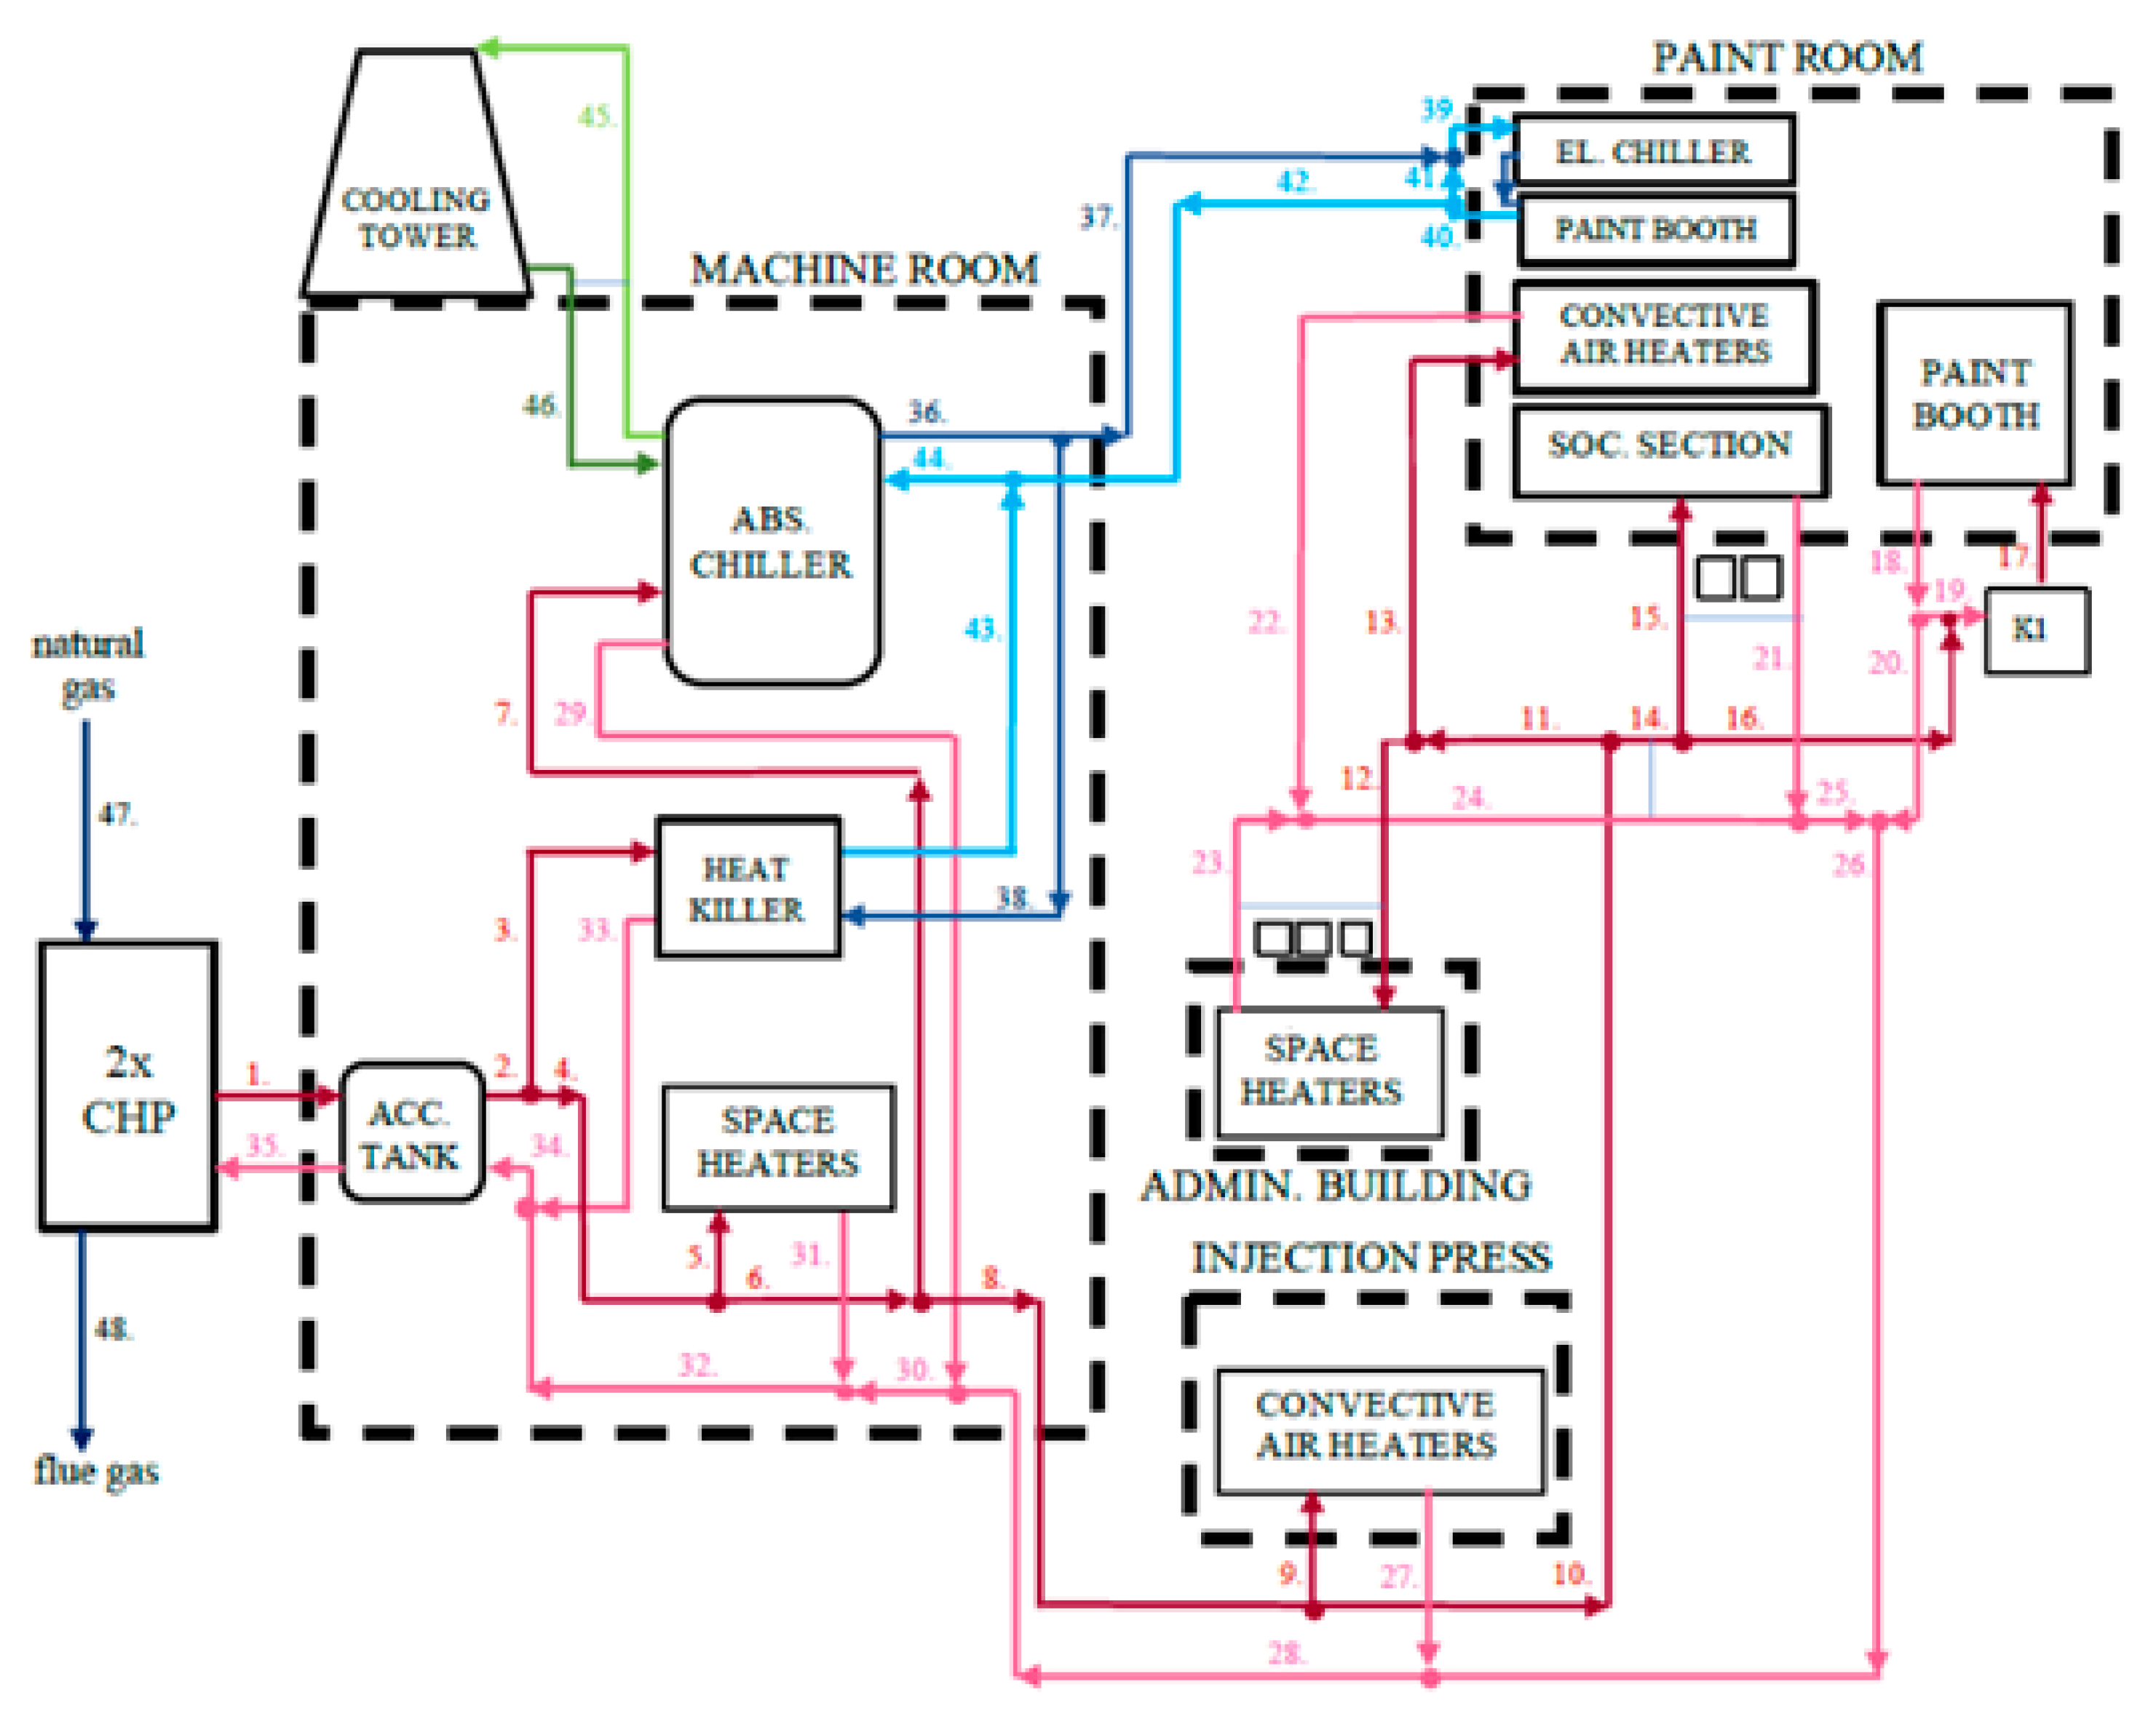
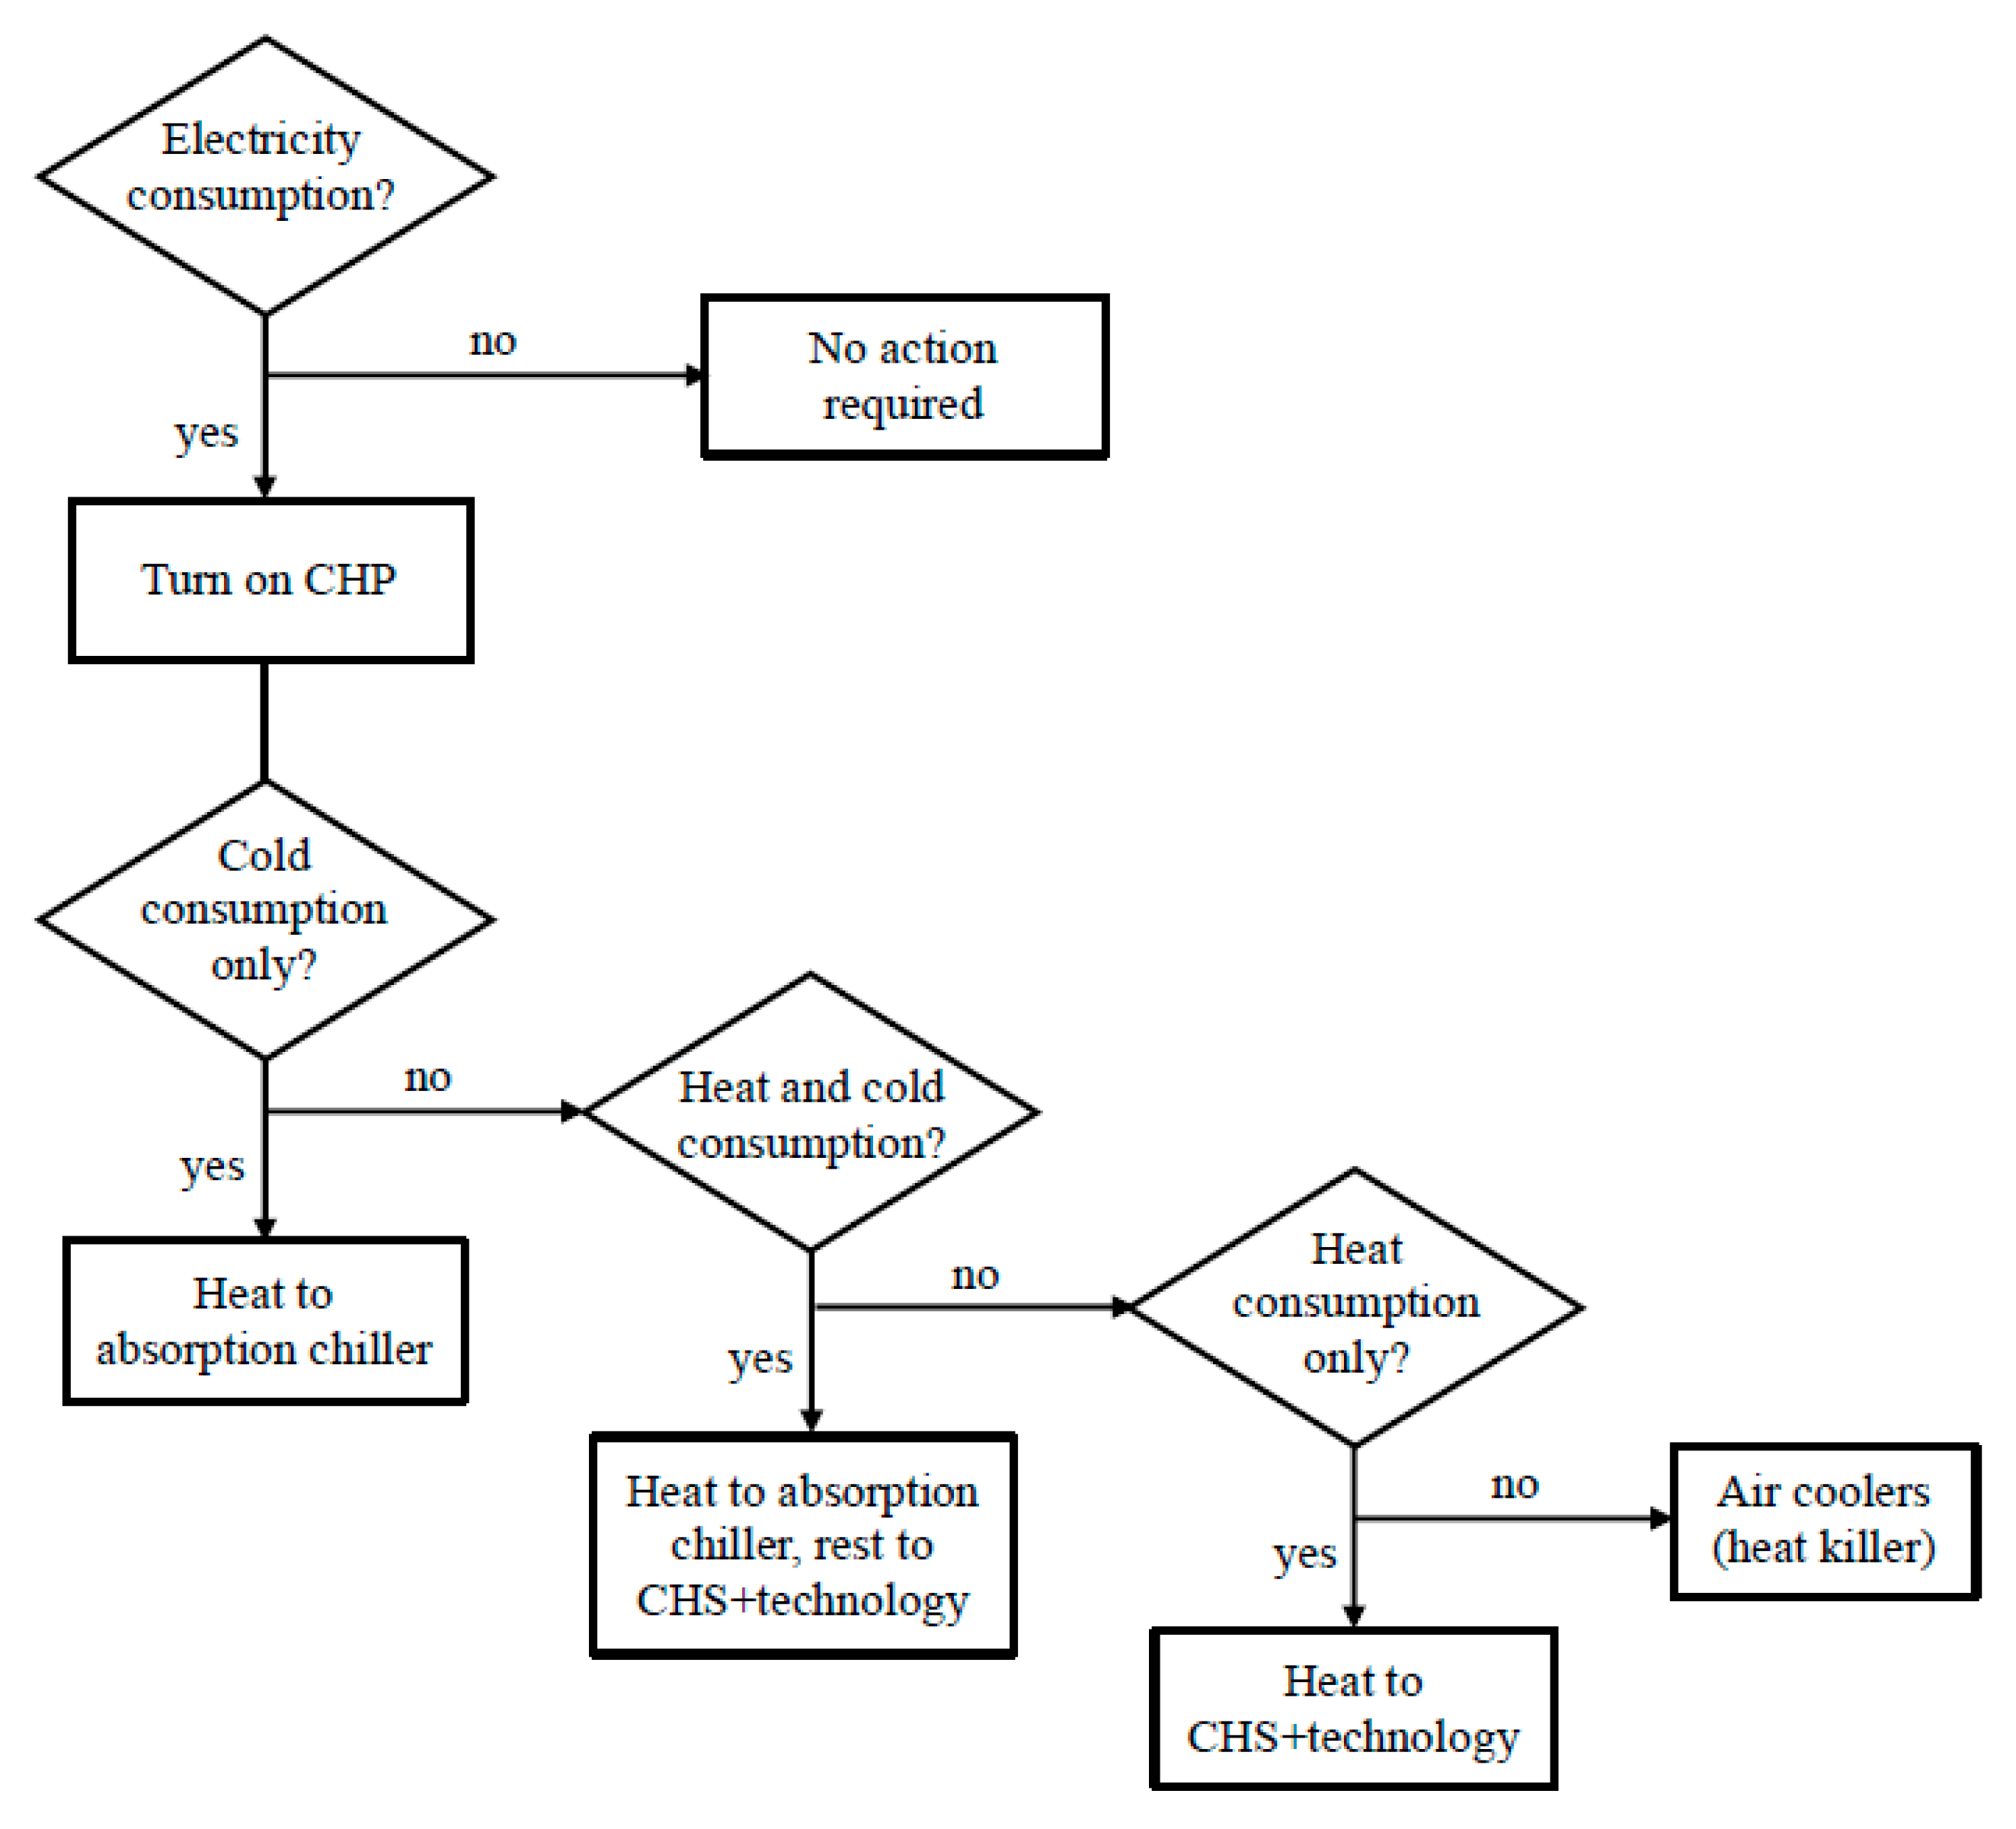
2. Materials and Methods
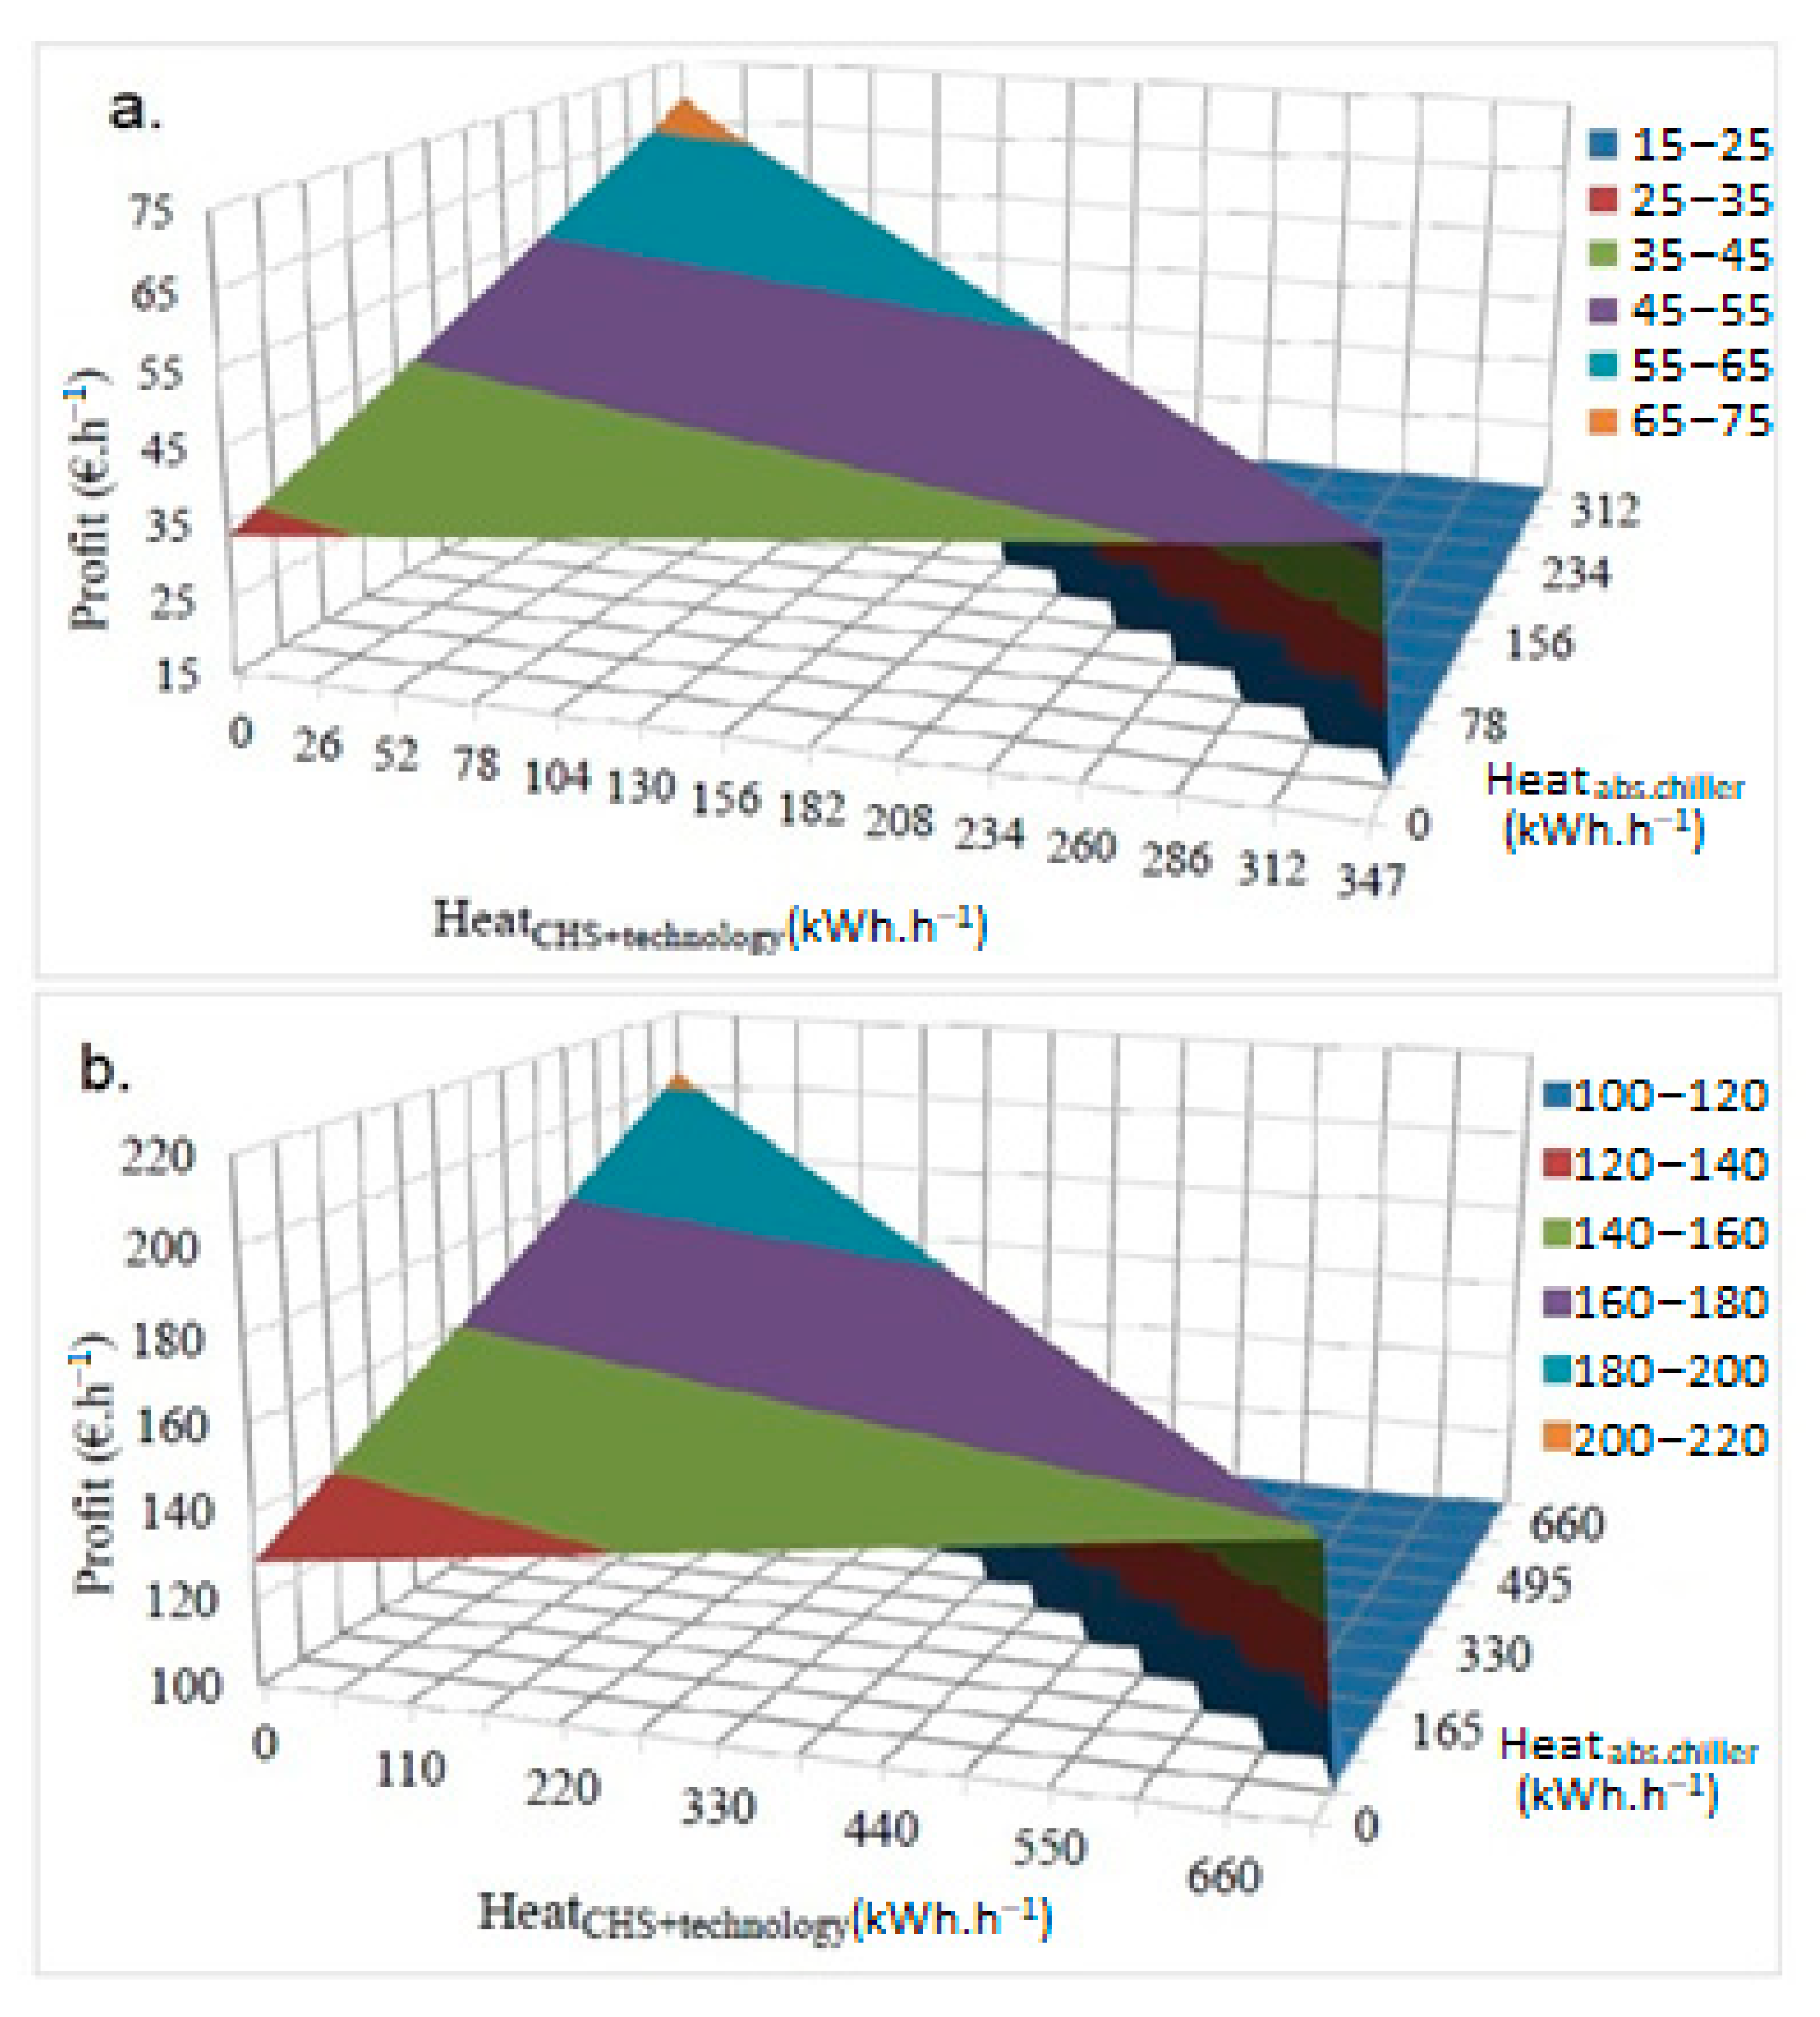
The analyzed trigeneration unit and the related heat and cold consumers located in an industrial facility are schematically depicted in Figure 1. Two identical internal combustion engines are operated in the CHP, each with a nominal power output of 250 kW and a heat output of 362 kW, respectively. The absorption chiller produces up to 618 kW of cold with the related coefficient of performance of 0.836, hence, it can consume all the heat obtainable from combustion engines to produce chilled water. A plate heat exchanger with a rated capacity of 350 kW is installed as a heat killer, i.e., an emergency solution for summer conditions with low consumption of both heat and cold.
According to the trigeneration unit operators, the installation of the heat killer in the past partially helped to solve the problem, but the unit operation is still not optimal. The insufficient heat consumption results in high temperatures of the return water flowing to the CHP, which then results in an emergency shutdown of the CHP. This issue could be solved by decreasing the CHP electricity production, but the plant’s goal is to produce as much electricity as possible. Thus, if the temperature of the return water is too high, the operation of the CHP at full power cannot be guaranteed. As a solution, an emergency air cooler enabling the disposal of all heat produced by the CHP at maximal power production (500 kW) is proposed and designed.
The design procedure was adopted from [11,12] for summer on site conditions: temperature of 32 °C, air pressure of 97 kPa. The associated total investment cost (TIC) estimation proceeded via guidelines provided in [13]. The TIC was converted to current equipment prices by the latest known Chemical Engineering Plant Cost Index (CEPCI) value of 799.1, valid for March 2023 [14]. Hourly profit values obtainable by emergency air cooler operation were determined as the difference in the profit function values, Equation (1), valid for the actual (representative summer period operation data available from 1 July to 11 September) and the maximal power production. A seasonal profit was obtained by summing the hourly profit values over the whole representative summer period. A single payback period was estimated as a ratio of the TIC and the seasonal profit.
The profit function was constructed to define the optimal trigeneration unit operation at various heat and cold demands as shown in Equation (1):
PROFIT = PEE CHP + PEE CHILLER + Cheat + CCO2 technology − CNG − CCO2 CHP
where PROFIT is the calculated profit (EUR.h−1), PEE CHP is the income from electricity produced by the CHP (EUR.h−1), PEE CHILLER is the income from electricity saved in the electric chiller (EUR.h−1) by producing cold in the absorption chiller instead, Cheat is the income from heat produced by the CHP (EUR.h−1) substituting the heat production in a separate gas boiler in the technology, CCO2 technology is the income from CO2 emissions avoided in the separate gas boiler in the technology (EUR.h−1), CNG is the cost of natural gas consumed in the CHP (EUR.h−1), and CCO2 CHP is the cost of CO2 emissions produced by the CHP (EUR.h−1). Individual items in Equation (1) were calculated as the product of calculated production (MWh.h−1, t.h−1) and the unit price (EUR.MWh−1, EUR.t−1) of the given energy or medium. Heat and cold production were estimated as functions of power produced by the combustion engines based on their datasheets. The reduction of the power consumption in the electric chiller, PEE CHILLER, was estimated as the ratio of cold production in the absorption chiller and the energy efficiency ratio of the electric chiller (which, according to the datasheet, equals 3.2). An emission factor of 2.75 t of CO2 per 1 t of natural gas was considered in the calculations. The following price ranges were tested: electricity 100 to 450 EUR.MWh−1, natural gas 25 to 180 EUR.MWh−1, CO2 65 to 105 EUR.t−1.

3. Results

Figure 2 shows values of the profit function for two extreme cases of CCHP operation: a. at the minimum possible power production (130 kW), and b. at the maximum power production (500 kW). The figure was constructed assuming the following model prices: 370 EUR.MWh−1 for electricity, 35 EUR.MWh−1 for NG, and 85 EUR.t−1 for CO2.
As can be seen, the profit of the trigeneration unit increases with both the increasing of the heat production for space heating and technology, and the increasing of heat delivery to the absorption chiller. However, producing cold in the absorption chiller is economically more attractive, regardless of power production. This leads to a defined hierarchy of optimal heat production and use, depicted in the form of a decision diagram for plant operators in Figure 3. This diagram is valid for model prices of energies and media; however, it can be updated based on the profit function analysis for any combination of prices.
The air cooler design yields two identical units with two fans per each unit, a nominal cooling air flow per fan of 15 m3·s−1, and a total nominal power consumption of 8 kW. Anticipated TIC reaches EUR 114,000 and, with the model prices of energies and media, the seasonal profit reaches almost EUR 65,000. The resulting expectable single payback period is around 2 years.

4. Discussion

Figure 2 shows the profit function values for model prices, reflecting the prices currently valid for the industrial site within which the trigeneration unit is located. As can be recognized, the price ratio of electricity and natural gas exceeds the value of 10, which favors power production maximization even with zero heat delivery. This means the unit may operate in a pure power-plant mode as the favorable economics prevails over energy efficiency and environmental issues [15]. This fact is also reflected in Figure 3 which always recommends the cogeneration unit being in operation. Even if the on site power demand is low, the excess power can be exported to the outer grid. The second-in-hierarchy question is whether a fraction of the heat from the internal combustion engines could be used to produce cold in the absorption chiller. This way, the cold produced in the electric chillers in the technology would be replaced and the facility’s power consumption would decrease. The least favorable yet still viable and, therefore, being placed the lowest in the hierarchy, is the option to use the available heat for space heating and in the technology. As a result of this, the heat produced in the hot water boilers in the technology would be replaced and, thereby, a reduction in natural gas consumption would be achieved.
The discussed situation underlines the pressing need to solve the issues coupled with the summer operation of the unit. During this season, only a part-load operation of the unit is often possible. Eventually, it can even become impossible due to insufficient heat consumption. In the most extreme cases, the difference in profit function may reach almost 100 EUR.h−1 when comparing pure electricity production modes (see Figure 2). This explains the significant saving of almost EUR 65,000, which is achievable by air cooler commissioning and operation in summer, as it enables smooth full-load operation of internal combustion engines even in the pure electricity production mode by disposing of all waste heat. Obviously, with significant power and natural gas price changes [16], the situation may become different, i.e., the true trigeneration mode operation may be preferred to pure power production.

5. Conclusions

The presented study aims for the analysis and optimization of a sub-MW-sized trigeneration unit supplying an industrial facility with power, heat, and cold. The current layout of the unit hinders its efficient operation in summer due to the absence of a relevant heat consumer and due to the limited capacity of the “heat killer”. The resulting part-load operation and frequent emergency shutdowns lower the operation profit and reduce the unit’s expected lifetime. Optimal operation conditions are studied based on developed models in the form of a linear profit function. The analysis yields a useful tool for plant operators—a decision diagram—to ensure the most economic plant operation based on a set of hierarchically arranged criteria. Basic design parameters of a new air cooler are obtained and the economics of its installation and summer operation is evaluated; yielding a two-unit design with four air fans in total, an internal power consumption of 8 kW, and an expected seasonal profit of almost EUR 65,000. As a result, an attractive simple payback period of two years can be expected.

Author Contributions

Conceptualization, M.V.; methodology, M.K. and P.F.; software, M.K.; validation, P.F.; investigation, M.K.; resources, M.V.; data curation, M.K.; writing—original draft preparation, M.V. and M.K.; writing—review and editing, P.F.; visualization, M.V and M.K.; supervision, M.V.; funding acquisition, M.V. and P.F. All authors have read and agreed to the published version of the manuscript.

Funding

This study was supported by the Slovak Research and Development Agency under contract nos. APVV-18-0134 and APVV-19-0170, and by the Slovak Scientific Agency, grant no. VEGA 1/0511/21.

Institutional Review Board Statement

Not applicable.

Informed Consent Statement

Not applicable.

Data Availability Statement

All publicly available data are shown in the paper.

Conflicts of Interest

The authors declare no conflict of interest. The funders had no role in the design of the study, in the collection, analyses, or interpretation of data, in the writing of the manuscript, or in the decision to publish the results.

References

  1. Final Energy Consumption in Industry–Detailed Statistics, Eurostat. Available online: https://ec.europa.eu/eurostat/statistics-explained/index.php?title=Final_energy_consumption_in_industry_-_detailed_statistics (accessed on 30 June 2023).
  2. Kavvadias, K.C.; Maroulis, Z.B. Multi-objective optimization of a trigeneration plant. Energy Policy 2010, 38, 945–954. [Google Scholar] [CrossRef]
  3. Ibrahim, D.; Rosen, A.M. Exergy-Related Methods. In Exergy Analysis of Heating, Refrigerating, and Air Conditioning. Methods and Applications; Elsevier: Amsterdam, The Netherlands, 2015; pp. 309–366. ISBN 9780124172036. [Google Scholar] [CrossRef]
  4. Günther, M.; Greller, M.; Fallahnejad, M. Evaluation of Long-Term Scenarios for Power Generation and District Heating at Stadtwerke München. Inform. -Spektrum 2014, 38, 97–102. [Google Scholar] [CrossRef]
  5. Huang, Y.; Hou, W.; Huang, Y.; Li, J.; Li, Q.; Wang, D.; Zhang, Y. Multi-Objective Optimal Operation for Steam Power Scheduling Based on Economic and Exergetic Analysis. Energies 2020, 13, 1886. [Google Scholar] [CrossRef]
  6. 3E Group. Cogeneration vs. Trigeneration. Available online: https://3egroup.com.au/news-insights/cogeneration-vs-trigeneration/ (accessed on 5 September 2023).
  7. Urban, F.; Ridzoň, F.; Malý, S.; Világi, F.; Mlynár, P. Produkcia CO2 pri monovýrobe a kombinovanej výrobe elektriny a tepla (In Slovak, “CO2 production in separate and combined heat and power production”). In Proceedings of the Vykurovanie 2021, Zborník Prednášok z 29. Medzinárodnej Vedecko-Odbornej Konferencie na Tému—Alternatívne Zdroje Energie pre Budovy s Takmer Nulovou Potrebou Energie, Horný Smokovec, Vysoké Tatry, Slovakia, 21–25 June 2021; Slovenská Spoločnosť pre Techniku Prostredia: Bratislava, Slovakia, 2021; pp. 131–138, ISBN 978-80-89878-72-7. [Google Scholar]
  8. Rimár, M.; Fedák, M.; Kulikov, A.; Abrahám, M. Evaluation of Combined Production of Heat and Electricity on the Cogeneration Unit. MM Sci. J. 2021, 5312–5316. [Google Scholar] [CrossRef]
  9. Benelmir, R.; Feidt, M. Energy cogeneration systems and energy management strategy. Energy Convers. Manag. 1998, 39, 1791–1802. [Google Scholar] [CrossRef]
  10. Hamels, S. CO2 Intensities and Primary Energy Factors in the Future European Electricity System. Energies 2021, 14, 2165. [Google Scholar] [CrossRef]
  11. Shortcut Sizing for Air Cooled Heat Exchanger, CheGuide. Available online: https://cheguide.com/air_cooled_exch.html (accessed on 4 August 2023).
  12. Shortcut Sizing for Air Cooled Heat Exchanger, Hudson Products Corporation. Available online: https://online.fliphtml5.com/gktj/zjyb/#p=4 (accessed on 8 August 2023).
  13. Peters, S.M.; Timmerhaus, D.K.; West, E.R. Plant Design and Economics for Chemical Engineers, 5th ed.McGraw-Hill: New York, NY, USA, 2003; pp. 239–249. ISBN 0-07-239266-5. [Google Scholar]
  14. Chemical Engineering Plant Cost Index Values, Monthly Data. Available online: https://toweringskills.com/financial-analysis/cost-indices/#chemical-engineering-plant-cost-index-cepci (accessed on 18 August 2023).
  15. Urban, F.; Ridzoň, F.; Világi, F.; Mlynár, P. Transformácia energie-primárne a sekundárne zdroje energie, nositelia a využitie energie (In Slovak “Energy transformation–primary and secondary energy sources, carriers and energy use”). In Proceedings of the Vykurovanie 2022, Zborník Prednášok z 30. Medzinárodnej Vedecko-Odbornej Konferencie na Tému-Čistá Energia Pre Modrý Vzduch a Zelenú Prírodu, Horný Smokovec, Vysoké Tatry, Slovakia, 14–18 February 2022; Slovenská Spoločnosť Pre Techniku Prostredia: Bratislava, Slovakia, 2022; pp. 179–186, ISBN 978-80-89878-88-8. Available online: https://www.engineering.sk/strojarstvo-extra/28373-transformacia-energie-zdroje-nositelia-a-vyuzitie (accessed on 5 September 2023).
  16. Liptáková, E.; Rimár, M.; Kizek, J.; Šefčíková, Z. The Evolution of Natural Gas Prices in EU Countries and their Impact on the Country’s Macroeconomic Indicators. Civ. Environ. Eng. Rep. 2021, 31, 255–273. [Google Scholar] [CrossRef]
Figure 1. Depiction of the trigeneration unit layout and heat and cold consumers. ABS = absorption, ACC = accumulation, ADMIN BUILDING = offices, CHP = cogeneration unit, EL = electric, K = boiler, SOC = social. Colors: red and pink = hot water pipelines, light blue = fresh chilled water, medium blue = chilled water return, light green = warmed up cooling water, dark green = fresh cooling water, dark blue = natural gas and flue gases, blue-grey (such as between streams 15. and 21.) = pipelines interconnections open in case of need; 1 to 48 = process streams. Source: own elaboration.
Engproc 56 00037 g001
Figure 2. Profit function values as a function of the heat production for space heating (CHS) and technology and the heat consumption in the absorption chiller for (a) minimal (130 kW) and (b) maximal (500 kW) power production. Abs = absorption, CHS = space heating. Source: Own elaboration.
Engproc 56 00037 g002
Figure 3. Decision diagram for optimal trigeneration unit operation valid for model prices of electricity. CHP = cogeneration unit (internal combustion engines). Source: Own elaboration.
Engproc 56 00037 g003
Disclaimer/Publisher’s Note: The statements, opinions and data contained in all publications are solely those of the individual author(s) and contributor(s) and not of MDPI and/or the editor(s). MDPI and/or the editor(s) disclaim responsibility for any injury to people or property resulting from any ideas, methods, instructions or products referred to in the content.

