Abstract
This study assesses the water quality of the Sušanecké Ponds in the Czech Republic post-mining area. Four monitoring profiles were chosen: the Sušanka River inflow into the Sušanecké Ponds, two ponds and the outflow of the Sušanecké Ponds to the Sušanka River. The sampling took place in a 14-day interval from March to October 2022. The monitored parameters were temperature, O2, pH, electrical conductivity, turbidity, nitrate nitrogen, ammoniacal nitrogen, total phosphorus, chlorophyll-a, CODCr, BOD5 and metals—Fe, Mn, Cu, Zn, Ni, Pb, Co, Cd, Cr. The results were evaluated in accordance with the Czech standard ČSN 75 7221 and Government Regulation No. 401/2015 Coll. Based on the evaluation data, it was found that the area of the Sušanecké Ponds does not meet the limits of the government regulation for three out of the twenty parameters. According to the standard, Sušanecké Ponds are mainly classified as highly polluted waters.
1. Introduction
The environmental quality of post-mining cities is slowly improving. On the one hand, these cities are pursuing sustainable development, taking into account the role of blue-green infrastructure. On the other hand, they must perform certain economic and social functions in the places of settlement [1]. The emphasis is on the adequacy of water sources for recreational purposes [2,3], especially in dense urban areas. In particular, these activities relate to water quality issues (water bathing, water sports and fishing) [4]. In addition, post-mining cities face depopulation due to their negative image [5]. Consequently, all actions co-existing with the mitigation of this attitude are welcome. Many cities are thus trying to restore the original function of existing water bodies that were used in the past, focusing on restoring their natural after-use potential in terms of water quality. Finally, efforts are also being made to green densely built areas and improve climate resilience [6,7].
The Ostrava-Karviná District (OKD) is only a small part of the vast Upper Silesia coal basin, most of which is located in neighboring Poland (more than 90% of the area). With regard to the black coal mining industry, the region is one of the most important in Europe. Approximately 90% of all the black coal production in the former Czechoslovakia was extracted from OKD until the late of 1980s, and three quarters of the total was extracted from Karviná region. In the early 1990s, the extraction of black coal in the Ostrava region and other regions of the Czech Republic was reduced after the transformation of the Czech mining industry [8].
The aim of this study was to evaluate the water quality of Sušanecké Ponds in the OKD post-mining city.
2. Materials and Methods
2.1. Study Area
The study area is located in the Havířov City, Horní Suchá district, in the Moravian-Silesian Region of the Czech Republic (Figure 1B). This area is in the OKD post-mining district. The climate in this region is moderately warm, with an average annual temperature of 19 °C in summer and an average annual rainfall of 650 mm [9]. The earliest references to the Sušanecké Ponds date from 1764 to 1768 and 1780 to 1783, documented from military maps [10,11,12]. Previously, the Sušanecké Ponds were composed of ten water bodies fed by the Lučina River, the Sušanka River and the Dolnosušský Stream. Between 1836 and 1852, the number of water areas dropped from ten to five, and from 1869 to 1885, the number of water areas was further reduced from ten to four by dividing the ponds into large units. Subsequently, the water area was again divided, with an increase to seven.
Until the late 1950s, seven ponds were used for fishing and recreational purposes and by the inhabitants of Horní Suchá and its surroundings. The ponds were also the source of water for the Dukla Mine. After they were no longer used as a source of water for the Dukla Mine, in 1959, the Sušanecké Ponds became part of the sludge lagoons in the wastewater treatment system; then the sewage from the surrounding villages was also discharged there. The mine water from the Plant František, Mine Odra, Plant 9th May, Mine Darkov and, in an emergency, also from mines Dukla and Lazy were all pumped into the ponds. The actual construction of the treatment system took place between 1959 and 1966, when the sedimentation tanks were completed [9]. With the decline of mining and after the closure of the wastewater treatment plant, remediation and reclamation work began in 1995. Coal sludge and flotation tailings from the tanks began to be removed in 2000. This process lasted until 2016. As part of the reclamation work, some parts of the tanks were filled in and the remaining areas were flooded with water. Since 2009, dice sneak urchin (Natrix tessellate) has been registered in the area as a specially protected species [13]. It is a critically endangered species in the Czech Republic and its number is being monitored. Since then, all work on the reservoirs is carried out in the period when the viper hibernates. The Dulka Mine was closed in June 2015. Currently, there are six water ponds with a total area of 215,872 m2 (Figure 1A) [9].
2.2. Sampling
The selection of the monitored profiles was determined on the basis of availability and stability throughout the period. A total of four monitoring profiles were selected (see Figure 1A). The first sampling point (SP) was the Sušanka River, more specifically the tributary of the Sušanecké Ponds. The second and third sampling points were two of six ponds. The last sampling point was the Sušanka River, which flows from the last pond. Consequently, the profiles observed in the Sušanka River can show whether the pond cascade has a positive effect on the self-cleaning processes. Water sampling was chosen to meet the minimum number of 12 samples from each sampling point to assess surface water quality in accordance with the standard ČSN 75 7221 [14] between March and October 2022. The sampling was carried out at intervals of 14 days, every time at 7 a.m. If the sampling date fell on a rainy day or after the rain, the sampling was performed at an alternative date in order to avoid results distortion (turbidity, dilution).

Figure 1.
The simplified sketch map of the Sušanecké Ponds (A—sampling points, B—localization in Czech Republic) (adopted by [15]).
Figure 1.
The simplified sketch map of the Sušanecké Ponds (A—sampling points, B—localization in Czech Republic) (adopted by [15]).

Water sampling and filling of the sample bottles were carried out in accordance with the standards ČSN EN ISO 5667-1, ČSN ISO 5667-4, ČSN EN ISO 5667-6, and ČSN EN ISO 5667-6 change A11 in [16,17,18,19]. For sampling, a PP 600 mL beaker connected to an aluminum telescopic sampling rod by a snap-in joint was used. Before the actual sampling, the sampler beaker and the PP and glass sampling bottles were rinsed several times with sampled water in the sample site. For the chlorophyll-a indicator, the samples were collected in dark glass sample bottles with a volume of 0.5 L. For other monitoring indicators, the samples were filled into a PP sample bottle with a volume of 2 L. All sample bottles were properly labelled with the number of samples and date of collection. The handling and storage of samples was carried out in accordance with the standard ČSN EN ISO 5667-3 in [20]. The samples were placed in coolers and transported to the laboratories of the Department of Environmental Engineering at the Faculty of Mining and Geology of the VSB-Technical University of Ostrava.
2.3. Measurements
The 48 water samples were characterized by 20 physicochemical and biological parameters, including temperature, water reaction (pH), dissolved oxygen (DO), electrical conductivity, turbidity, 5-day biochemical oxygen demand (BOD), chemical oxygen demand by dichromate (COD), total phosphorus (PTOT), nitrate nitrogen, ammonia nitrogen, chlorophyll-a and metals (Fe, Mn, Cu, Zn, Ni, Pb, Co, Cd, Cr). Temperature, pH, electrical conductivity and DO values were measured at the sample site. The measurements were performed using multiple WTW pH/Cond multimeter (WTW, Weilheim, Germany) and HQ 30d oximeter (HACH Company, Loveland, CO, USA). Rest analyses were carried out using standard methods in the laboratories of the Department of Environmental Engineering. The UV-VIS spectrometer DR 3900 (HACH Company, Loveland, CO, USA) was used to measure turbidity, PTOT, nitrate nitrogen, ammonia nitrogen and chlorophyll-a. Metals were performed using the AAS VARIAN AA280FS (Agilent, Santa Clara, CA, USA).
2.4. Data Analysis
The resulting values of the monitoring parameters were assessed according to the standard ČSN 75 7221 Classification of surface water quality in [14], Government Regulation No. 401/2015 Coll. on indicators and values of permissible pollution of surface water and wastewater, the requirements for permits for the discharge of wastewater into surface water and sewers and on sensitive areas, as amended, and the Environmental Quality Standards, which are annexed to the No. 401/2015 Coll. for specific pollutants for surface water bodies and the values of permissible pollution of surface water used for water supply purposes. The annual average (AA-EQS) and maximum allowable concentrations (MAX-EQS) were then used for the assessment in [21]. The samples were set up and processed in MS Excel.
The classification of water quality in accordance with ČSN 75 7221 was performed by comparing the calculated characteristic values of the indicator with the corresponding limit valve sets. The characteristic value of the water quality indicator is the value with a probability not exceeding 90%. The characteristic value of chlorophyll-a is the maximum value of a specified number of measured values for the growing season from March to October as prescribed in the standard. Water quality is classified separately for each indicator. The resulting class of the monitoring profile must be determined by the most negative classification found for each selected indicator. In Table 1, a list of monitoring indicators and the intervals of the individual classes of monitored indicators are provided in accordance with ČSN EN 75 7221.

Table 1.
List of water quality indicators for the classification of Sušanecké Ponds (adapted from [14]).
3. Results and Discussion
3.1. Water Quality Assessment in Accordance with GR No. 401/2015 Coll.
The Government Regulation (GR) No. 401/2015 Coll. does not include limit values of permitted pollutants for electrolytic conductivity, turbidity and chlorophyll-a. The trends of monitored water parameters of the Sušanecké Ponds SPs (SP1–SP4) in the monitoring period from March to October 2022 are shown in Figure 2, Figure 3 and Figure 4.
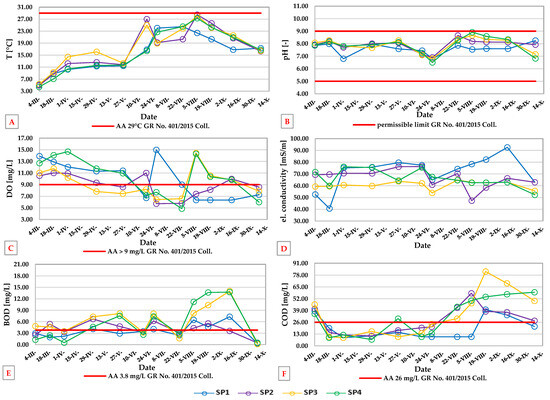
Figure 2.
Water parameter trends at the Sušanecké Ponds sample points during the monitoring period from March to October 2022—part I (A—temperature trend, B—pH trend, C—DO trend, D—el. conductivity trend, E—BOD trend, F—COD trend).
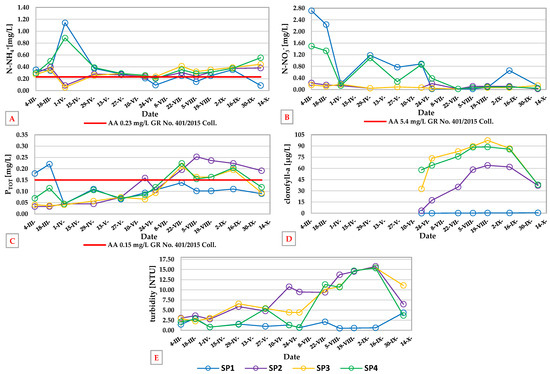
Figure 3.
Water parameter trends at the Sušanecké Ponds sample points during the monitoring period from March to October 2022—part II (A—N-NH4+ trend, B—N-NO3−, C—PTOT trend, D—chlorophyll-a trend, E—turbidity trend).
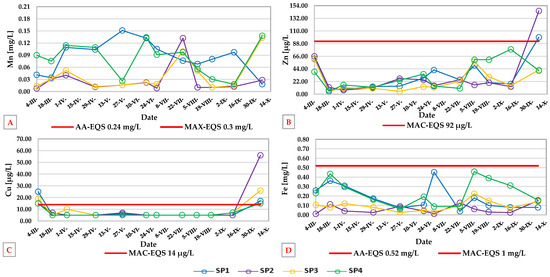
Figure 4.
Water parameter trends at the Sušanecké Ponds sample points during the monitoring period from March to October 2022—part III (A—Mn trend, B—Zn trend, C—Cu trend, D—Fe trend).
Figure 2A shows how the temperature changed throughout the measurement process. At the beginning of the March measurement period, the temperatures rose gradually. In early August, the highest temperatures in the SP2, SP3 and SP4 samples were recorded, with the annual average (AA) temperature not exceeding 29 °C. In contrast, the lowest temperature (4.4 °C) was measured at the beginning of the SP4 growth season.
As shown in Figure 2B, the measured values were within the permissible pH value limit based on the GR, so it can be concluded that the Sušanecké Ponds, its inflow and outflow, meet the government-mandated parameters.
Figure 2C shows the DO pattern during the growing season. The DO values decreased during the measurement period. However, fluctuation was observed during the period from June to July. According to the GR, the annual average DO value should be more than 9 mg/L. All SPs, except for SP2, with an average value of 8.91 mg/L, meet the GR.
The electrical conductivity values (in Figure 2D) remained constant during the study period. The lowest value was 40.6 mS/m in March, and the highest value was 92.6 mS/m in September.
During the monitoring period, most samples showed variations in the BOD values measured (Figure 2E). However, in early August, when the values of the SP3 and SP4 samples gradually reached their maximum values, the biggest change was observed. The next major change occurred in early October, when all values dropped to less than 0.5 mg/L. The GR established an average permitted BOD (five day) value of 3.8 mg/L. After adjusting, the average value was found to be greater than the values of three samples, namely SP2, SP3 and SP4. As a result, the Sušanecké Ponds and its outflow did not comply with the parameters prescribed by the government.
The course of the COD values measured is shown in Figure 2F. COD showed a decrease in the early spring. From May, there was a change in values as they gradually increased. The AA COD value according to the GR was 26 mg/L. After the average, it was found that the three SPs, namely SP2, SP3 and SP4, exceeded this value. Therefore, the Sušanecké Ponds and outflow did not meet the government mandated parameters.
The development of nutrients is shown in Figure 3A–C. The increase in values may be related to the addition of spring fertilizers in agricultural areas and to additional feeding by fishermen during the fishing season. The AA value of ammonia nitrogen (0.23 mg/L) was exceeded at all SPs, so the Sušanecké Ponds, inflow and outflow did not meet the GR parameters. Neither the storage nor the self-cleaning capacity regarding nutrients was confirmed; everything that flows into the ponds flows out. There is evidence of phosphorus release in the ponds, which could be influenced by the anoxic conditions at the bottom of the sediments. This is also reflected in the development of chlorophyll-a.
Figure 3E shows an increase trend of turbidity values from SP2 to SP4. For SP1, the turbidity value was approximately 2 NTU over the entire monitoring period, but this value only increased to 4.34 NTU in October. In September, SP2 achieved the highest turbidity value, 15.75 NTU. Conversely, at the end of June, the lowest value was 0.7 NTU in SP1.
Similarly, the development of metal concentrations is shown in Figure 4. The AA values according to EQS for Mn, Zn, Cu and Fe were not exceeded. Metals—Cd, Cr, Co and Pb—were not evaluated because their concentrations were below the detection limit. Specifically, the concentration of CdTOT was less than 1 µg/L, and the others were less than 10 µg/L. In case further monitoring is required, the ICP-MS method would be more appropriate.
3.2. Water Quality Assessment in Accordance with the Standard ČSN 75 7221
As mentioned in Section 3.1, metals Cd, Cr, Co and Pb were not evaluated because they were below the detection limit. The classification of the individual SPs into water quality classes is shown in Table 2 and Table 3. Because the chlorophyll-a value from March to May was not measurable, only the values from June were included.
Table 2.
Classification of SP1 and SP2 into water quality classes during the monitoring period.
Table 3.
Classification of SP3 and SP4 into water quality classes during the monitoring period.
The water quality of SP1, a Sušanka River tributary, was classified as water quality class III—polluted water, based on the values of the parameters shown in Table 2. This quality class is characterized by the following: water affected by human activity, and water quality indicators do not correspond with values suitable for a balanced and sustainable ecosystem. The water quality of SP2, Pond No. 1, was classified as water quality class IV—highly polluted water, based on the parameters listed in Table 2, when the chlorophyll-a parameter was the worst. This quality class is described as follows: water is heavily influenced by human activity, and water quality indicators indicate values that are not suitable for a balanced and sustainable ecosystem. The water quality of the remaining two SPs (SP3—Pond No. 2 and SP4—outflow to Sušanka River) were also classified as water quality class IV based on the indicators BOD, COD and chlorophyll-a listed in Table 3.
4. Conclusions
According to the evaluation of the data based on the standard ČSN 75 7221 and Government Regulation No. 401/2015 Coll. it was found that the area of Sušanecké Ponds does not meet the GR limit values for three of the parameters, namely for ammonia nitrogen, BOD and COD. According to the standard, the area is largely classified as the water quality class IV. This fact can be attributed to the earlier use of Sušanecké Ponds as waste reservoirs, which served as “wastewater treatment plants”, expanded agricultural activity in the area, abundant population and constantly growing industrial activity. It is obvious that the quality of the water in the ponds and the Sušanka River will be significantly affected by these factors. In conclusion, it can be stated that the water quality indicators of the Sušanecké Ponds reach the values of heavily polluted water. The self-cleaning effect of the Sušanecké Ponds has not been proven; the water quality has deteriorated.
Currently, the City of Havířov is considering the revitalization of the surroundings of Sušanecké Ponds and their use as a water element in a possible urban forest park. Therefore, in future steps it would be advisable to measure flow and runoff conditions.
Author Contributions
P.M. and J.C. were involved in all aspects of the manuscript such as conceptualization, methodology, software, validation, formal analysis, investigation, resources, data curation, writing—original preparation, writing—review and editing, visualization, supervision, and project administration. All authors have read and agreed to the published version of the manuscript.
Funding
This research received no external funding.
Institutional Review Board Statement
Not applicable.
Informed Consent Statement
Not applicable.
Data Availability Statement
Data sets are contained within the article. Further data and materials requests should be addressed to petra.malikova@vsb.cz (P.M.).
Acknowledgments
The authors would like to thank the Department of Environmental Engineering, Faculty of Mining and Geology for technical and material support connected with laboratory analyses. Furthermore, the authors would like to thank the internal materials of the Havířov City Magistrate’s Office and Bardoňovská Sára for the cooperation with the creation of Figure 1A.
Conflicts of Interest
The authors declare no conflict of interest. The funders had no role in the design of the study; in the collection, analyses, or interpretation of data; in the writing of the manuscript; or in the decision to publish the results.
References
- Harfst, J. Utilizing the past: Valorizing post-mining potential in Central Europe. Extr. Ind. Soc. 2015, 2, 217–224. [Google Scholar] [CrossRef]
- Kantor-Pietraga, I.; Krzysztofik, R.; Solarski, M. Planning Recreation around Water Bodies in Two Hard Coal Post-Mining Areas in Southern Poland. Sustainability 2023, 15, 10607. [Google Scholar] [CrossRef]
- Nelson, E.; Rogers, M.; Wood, S.A.; Chung, J.; Keeler, B. Data-driven predictions of summertime visits to lakes across 17 US states. Ecosphere 2023, 14, e4457. [Google Scholar] [CrossRef]
- Keeler, B.L.; Wood, S.A.; Polasky, S.; Kling, C.; Filstrup, C.T.; Downing, J.A. Recreational demand for clean water: Evidence from geotagged photographs by visitors to lakes. Front. Ecol. Environ. 2015, 13, 76–81. [Google Scholar] [CrossRef] [PubMed]
- Sokołowski, J.; Frankowski, J.; Mazurkiewicz, J.; Lewandowski, P. Hard coal phase-out and the labour market transition pathways: The case of Poland. Environ. Innov. Soc. Transit. 2022, 43, 80–98. [Google Scholar] [CrossRef]
- Wagner, I.; Krauze, K.; Zalewski, M. Blue aspects of green infrastructure. Sustain. Dev. Appl. 2013, 4, 145–155. [Google Scholar]
- Bertram, C.; Meyerhoff, J.; Rehdanz, K.; Wüstemann, H. Differences in the recreational value of urban parks between weekdays and weekends: A discrete choice analysis. Landsc. Urban Plan. 2017, 159, 5–14. [Google Scholar] [CrossRef]
- Havrlant, J.; Krtička, L. Reclamation of devastated landscape in the Karviná region (Czech Republic). Environ. Socio-Econ. Stud. 2014, 2, 1–12. [Google Scholar] [CrossRef][Green Version]
- Anonymous. Havířov City, Czech Republic. Internal Documentation. Unpublished, 2023.
- Ist Military Survey—Silesia, Map Sheet No.12. Austrian State Archive/Military Archive, Vienna, Geoinformatics Laboratory at J.E.Purkyně. Available online: http://oldmaps.geolab.cz/map_viewer.pl?lang=en&map_root=1vm&map_region=sl&map_list=s012 (accessed on 18 August 2023).
- IInd Military Survey—Moravia, Map Sheet No. O_5_X. Austrian State Archive/Military Archive, Vienna, Geoinformatics Laboratory at J.E.Purkyně. Available online: http://oldmaps.geolab.cz/map_viewer.pl?lang=en&map_root=2vm&map_region=mo&map_list=O_5_X (accessed on 18 August 2023).
- IIIrd Military Survey—1:25,000, Map Sheet No. 4061_3. Austrian State Archive/Military Archive, Vienna, Geoinformatics Laboratory at J.E.Purkyně. Available online: http://oldmaps.geolab.cz/map_viewer.pl?lang=en&map_root=3vm&map_region=25&map_list=4061_3 (accessed on 18 August 2023).
- Vlček, P.; Zavadil, V.; Jablonski, D.; Mebert, K. Dice Snake (Natrix tessellate) in the Baltic Sea Drainage Basin (Karvinsko District in Silesia, Czech Republic). Merensiella 2011, 18, 177–187. [Google Scholar]
- ČSN 75 7221; Water Quality—Classification of Surface Water Quality. Czech Standard Institute: Prague, Czech Republic, 2017.
- Bardoňová, S. Sušanecké Ponds: Water Sampling Sites in the Area of the Sušanecké Ponds [1:50,000]; Characteristics of the site and description of the Sušanecké Ponds and their proposed use; Department of Urban Development: Havířov City, Czech Republic; Magistrate of the Havířov City, Czech Republic, 2021. [Google Scholar]
- ČSN EN ISO 5667-1; Water Quality—Sampling—Part 1: Guidance on the Design of Sampling Programs and Sampling Techniques. Czech Standard Institute: Prague, Czech Republic, 2023.
- ČSN ISO 5667-4; Water Quality—Sampling—Part 4: Guidance on Sampling from Lakes, Natural and Man-Made. Czech Standard Institute: Prague, Czech Republic, 2018.
- ČSN EN ISO 5667-6; Water Quality—Sampling—Part 6: Guidance on Sampling of Rivers and Streams. Czech Standard Institute: Prague, Czech Republic, 2017.
- ČSN EN ISO 5667-6; Change A11 Water Quality—Sampling—Part 6: Guidance on Sampling of Rivers and Streams. Czech Standard Institute: Prague, Czech Republic, 2020.
- ČSN EN ISO 5667-3; Water Quality—Sampling—Part 3: Preservation and Handling of Water Samples. Czech Standard Institute: Prague, Czech Republic, 2019.
- Czech Republic. The Decree No 401/2015 Coll., on Indicators and Values of Permissible Pollution of Surface Water and Wastewater, the Details of Permits for the Discharge of Wastewater into Surface Water and Sewers and on Sensitive Areas, as Amended. Available online: https://www.psp.cz/sqw/sbirka.sqw?cz=401&r=2015 (accessed on 15 May 2023). (In Czech).


Disclaimer/Publisher’s Note: The statements, opinions and data contained in all publications are solely those of the individual author(s) and contributor(s) and not of MDPI and/or the editor(s). MDPI and/or the editor(s) disclaim responsibility for any injury to people or property resulting from any ideas, methods, instructions or products referred to in the content. |
© 2023 by the authors. Licensee MDPI, Basel, Switzerland. This article is an open access article distributed under the terms and conditions of the Creative Commons Attribution (CC BY) license (https://creativecommons.org/licenses/by/4.0/).