1. Introduction
Lithium batteries are the main power source for all electronic components that are widely used on a daily basis, such as portable computers, smartphones and electric vehicles. They consist of four main components: anode, cathode, electrolyte and separator [
1]. During discharge, lithium ions flow from the anode to the cathode and vice versa while charging. The electrolyte helps this energy trade and the separator protects the two parts of the battery from internal short circuits [
2]. Compared to previous technologies like lead acid they can provide greater energy density with more robust and compact sizing, actively enhancing their adoption in every modern device as storage or renewable plants or electric vehicles which is the latest trend towards a greener environment [
3,
4].
However, all lithium-ion technologies inherit several flaws. The high temperature caused by fast charging or discharging in any situation, creates lithium dendrite, electrolyte decomposition or even cracking inside the cells leading to total breakdown [
5]. This aspect inquires about the need for a monitoring system that is constantly collecting important values like its capacity, voltage, the current drawn or applied to the battery, and most importantly temperatures at the electrodes and of the casing externally [
6].
In order to determine the status and protect the battery from any damage, there are 4 specific values that can be calculated, which include [
7,
8]:
SoC describes the battery’s current charge compared to full, SoH reflects the current capacity after any life cycle and SoP is defined as the peak power that the battery can supply at a certain time period. A variable that can be easily monitored and provide information about battery use and user behavior is the Depth of Discharge, which shows the usage percentage in each case, such as, for example, 100% to 40% equals 60% DoD. Previous research concluded that a high depth of discharge with low SoC at the end of each use stresses the cells and can lead to severe damage and a low State of Health [
9,
10].
It is clear that these four parameters are crucial for the battery status diagnosis. A low State of Charge (below 20%) associated with a high depth of discharge signifies high battery stress. If the temperature of the cells overcomes the safe limit at 40° Celsius, it will cause lithium deposition on the cathode, leading to less available lithium flowing from the anode to the cathode so that the SoH is lowered [
11]. Additionally, if battery health (SoH) is limited, it will be strained to cover the energy demand for the nominal time or any peak loads required, turning to safe mode or even total breakdown [
12]. High SoC for long periods can also damage the battery as being close to full charge adds excessive pressure to the electrolyte and the separator [
13,
14]. Hence, a battery management system protecting the battery with the nominal operational conditions is vital for safe and uninterrupted functioning.
The goal of this paper is to suggest a simple, compact and user-friendly setup based on an Arduino-compatible device. A typical 18,650 battery is employed as the key element for testing with the addition of a current and a voltage sensor for the respective values collection. Moreover, a set of NTC thermistors with different ohmic grades (10k and 100k Ohms) collect the battery temperature at the electrode end while the external temperature and humidity are also collected at a 10 s time frame like the other parameters. Then, all values are transferred to an internet application server with Wi-Fi for real-time monitoring and further processing.
2. Materials and Methods
2.1. Experimental Layout
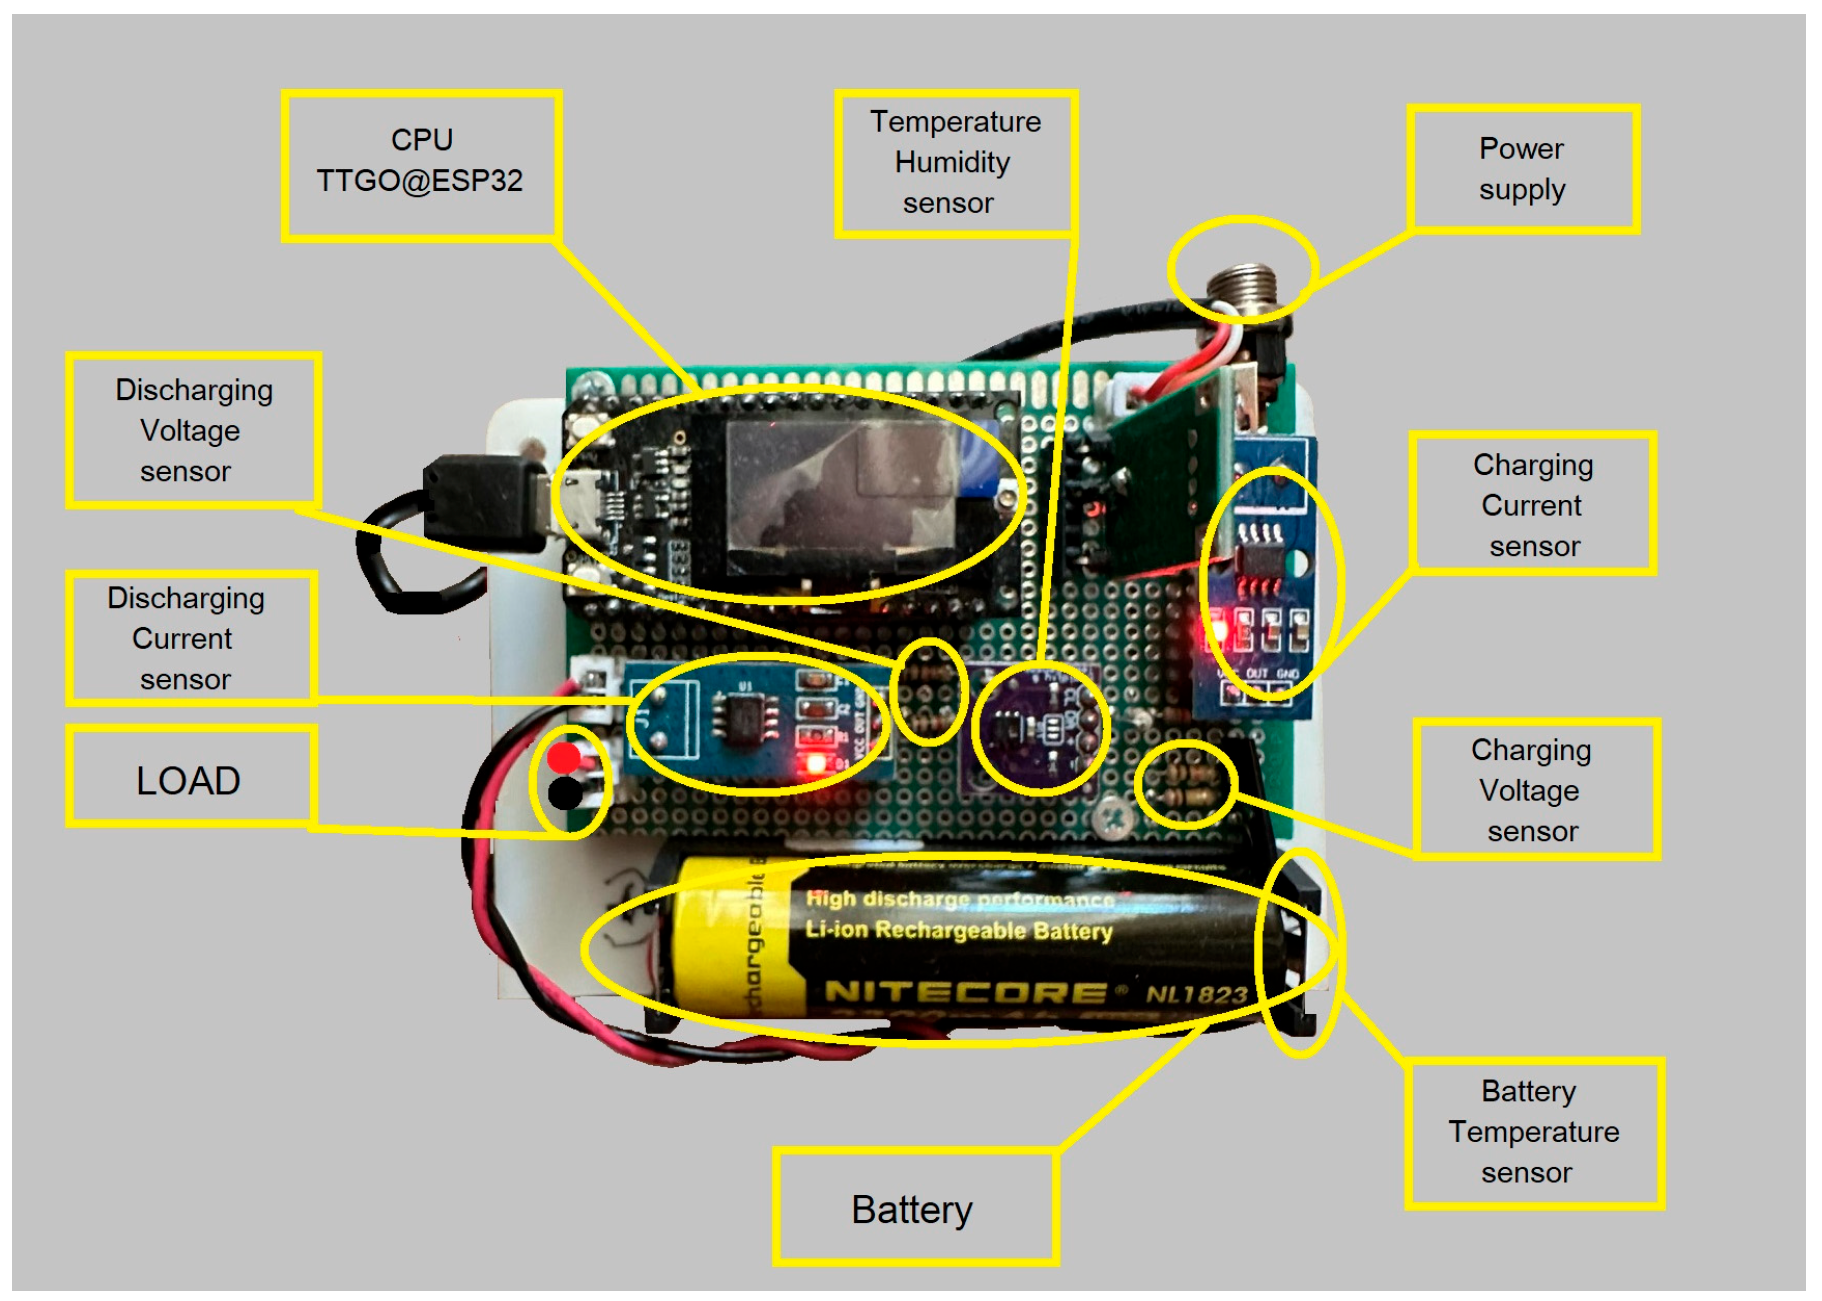
According to the experiment requirements, a battery tester board is developed to monitor and transfer the data to the central application host. The board includes various components, all deployed within an Arduino-compatible device, which can be programmed using the Arduino IDE 2.2.1 user-friendly interface for further adjustments. The TTGO@ESP32, Shenzhen, China) is selected as the main processing unit due to its high affordability and processing power with low power consumption and size. It includes 25 I/O (Inputs/Outputs) and analog ports, with I2C (Inter-integrated Circuit) and SPI (Serial Peripheral Interface) capable of functioning as a communication interface supporting Wi-Fi and LoRa protocols. In addition, the voltage reading of the analog ports is supported by 4095 step positions, resulting in higher measurement accuracy.
The layout includes two current sensors (ACS712-5A) from Allegro microsystems (Shenzhen, China) which can measure up to 5A corresponding to the analog output 185 mV/Amp, while the sensitivity is set and calibrated by the built-in potentiometer. A set of coupled resistors (100 KΩ) is implemented as the voltage divider to monitor both charging and discharging voltage sequences. For the battery temperature value, two thermistors (NTC) with distinct resistances, 10 kΩ and 100 kΩ, were used for further validation regarding the accuracy of the measurement. In addition, the environmental temperature and humidity values were provided by a single and calibrated barometric sensor with product number GY-213V-HTU21D, (Shenzhen, China).
The battery selected is a NiteCore NL1823 Li-Ion (Shenzhen, China) with a capacity of 2.300 mAh and a nominal voltage of 3.7 volts, placed within a socket soldered into the board. This module can be charged internally via a DC adapter or a photovoltaic (PV) panel with a supply of up to 6 volts. An additional plug for external load is provided for testing the battery performance. At the working state, all measurements from the battery are collected every 10 s as a time frame. Then, the board sends the measurements (voltage, current, temperature and humidity) to the internet application server over Wi-Fi using HTTP POST messages. The application platform includes a database for storing data and a web server (Grafana UI) for data visualization or reception.
Figure 1 below displays the layout of the circuit including the CPU, sensors, battery, DC supply plug and the load output.
2.2. Calculation of Selected Parameters
The collected values from the circuit are used for the calculation of the previously mentioned parameters (SoC, SoH, SoP and DoD), whose significance is stated previously in the Introduction. According to the literature [
10,
11,
12], there is a variety of complex equations to obtain these values. For this experiment, the following rules are required:
SoC equals the ratio of current capacity divided by the nominal value;
SoH is defined as the maximum voltage of the battery divided by the nominal;
SoP refers to the maximum current that can be drawn from the battery;
DoD is calculated manually depending on the SoC before and after charging.
Capacity can be identified by subtracting the current drawn from the nominal and multiplying it with hours to convert it into Ampere hours. To simplify the calculations, the State of Voltage (SoV) term is utilized as a SoC alternative that is identical for battery status monitoring [
13]. Therefore, the following equations are utilized to calculate these parameters:
3. Results and Discussion
The values monitored were collected and presented in
Figure 2 at Grafana Interface. Constant monitoring is available through this free web application and data can be extracted for any specific time frame, adding better control and direct data comparison.
Total measurements gathered are 30,000, spread over a month-long period. The comparison between the NTC thermistors to validate the accuracy was fulfilled and presented in
Figure 3. The results show that both NTCs, 10k and 100k (after value correction for the first one) provide the same sensitivity in temperature changes and can be utilized for this work.
Testing is based on the experiment ambient temperature, located in the province of Peristeri in Athens, Greece. As mentioned before, temperature is a key factor in battery performance. As the power voltage increases, battery voltage is enhanced but not in a linear way, due to the increased temperature, affecting its internal resistance, which can be seen in the second graph very clearly. The temperature of the battery is highly affected by the voltage applied and is calculated via the 100k NTC datasheet [
15]. As resistance increases, lithium-ion flow is limited both at charging or discharging phases, and overheating due to high current or ambient temperature causes dendrites to form at the electrodes so fewer lithium-ions are available to flow and capacity is limited [
5,
6,
7]. In this testing, the temperature remains within the operation limits of the cells. After measurement 145, the supply voltage was limited to provide further protection. In the graph, a linear decrease can be seen in both voltages as the source is disconnected, with a simultaneous increase in both temperatures. It can then reach the maximum point when the source voltage is reapplied.
Figure 4 below imprints this sequence.
The variation of battery current corresponding to external and internal temperatures is displayed in
Figure 5. The current and voltage fluctuations are similar while the ambient temperature and current variations are too modest to provide any major outcomes.
The next step is to calculate the battery parameters mentioned in
Section 2.2, hence, the results are summarized in
Table 1. The State of Charge was maintained at 40–80%, hence, a DoD of 40%. If DoD is increased and the battery is dropped below 20% charge, it is susceptible to lithium deposition, causing a reduction in SoH [
9]. By not keeping the battery at 100% charge, the State of Health decreased only by 0.1% after 50 cycles. Batteries are manufactured with over 100% available SoH, typically 102–110%, so the drop is not visible in
Table 1. The State of Power can reach 6x the battery capacity, with a small decrease after testing, as the battery chemically ages. A significant factor was the high ambient temperature, typically 30–35° Celcius due to summer conditions. So, no major stress on the batteries was applied.
4. Conclusions
This work presented a compact, affordable and customizable layout of lithium battery monitoring through a web app monitoring platform. Certain values like ambient and internal temperatures were gathered to calculate important values for the battery like the State of Charge and State of Health. The results show that battery stress is mainly affected by battery current and supply voltage that raises internal temperature causing dendrites at the battery electrodes, reducing total capacity. In this work, it is suggested that SoC should be maintained with an optimal range (20–80%), while low DoD and operating current lead to major cell longevity, as SoH is decreased by only 0.1% after 50 cycles while maintained at safe operating conditions. Future work involves an advanced software tool for calculating more parameters like the State of Life and a bigger setup to be tested in EV modules, mainly focused on battery stress verification with the addition of more sensors and the ability to handle increased currents required within the safe temperature zone.


