Abstract
Degrading air quality is a matter of concern nowadays, and monitoring air quality helps us keep an eye on it. Air pollution is a pressing global issue with far-reaching impacts on public health and the environment. The need for effective and real-time monitoring systems has become increasingly apparent to combat this growing concern. Here, an innovative air pollution surveillance system (APSS) that leverages Internet of Things (IoT) technology to enable comprehensive and dynamic air quality assessment is introduced. The proposed APMS employs a network of Io enabled sensors strategically deployed across urban and industrial areas. These sensors are equipped to measure various pollutants, including particulate matter (PM2.5 and PM10), nitrogen dioxide (NO2), sulfur dioxide (SO2), ozone (O3), carbon monoxide (CO), and volatile organic compounds (VOCs). Here, a regression model is created to forecast air quality using sensor data while taking into account variables including weather information, traffic patterns, and pollutants. Additionally, air quality categories (such as good, moderate, and harmful) are classified using classification algorithms based on preset thresholds. The IoT architecture facilitates seamless data transmission from these sensors to a centralized cloud-based platform. The developed APSS monitors the air quality using an MQ-135 gas sensor, and the data are shared over a web server using the Internet. An alarm will trigger when the air quality goes below a certain level. Also, the air quality, which is measured in parts per million (PPM), is displayed on the unit connected to it. Furthermore, when the PPM goes beyond a certain level, an alert message is sent to the air pollution control board, which takes preventive measures to control the pollution and also alerts the people, which helps each person in that society save their environment from pollution and have a good air quality environment. Additionally, the APSS offers user-friendly interfaces, accessible through web and mobile applications, to empower citizens with real-time air quality information. The effectiveness of the IoT-based air pollution monitoring system has been validated through successful field trials in urban and industrial environments, and it has the ability to provide real-time data insights and empower stakeholders in promoting environmental sustainability and fostering citizen engagement.
1. Introduction
Air pollution is the contamination of the indoor and outdoor environment by any chemical, physical, or biological agent that modifies the natural characteristics of the atmosphere. It has effects on humans, animals, plants, and the environment. It affects long-term health issues like heart disease, lung cancer, and respiratory diseases in humans. It also affects animals and plants, causing some diseases and causing damage to the environment. A device used to measure this polluted air is an air pollution monitoring system, which helps control air pollution. There are some existing approaches that are discussed here: A wireless air pollution monitoring system is created, and when the level of measured pollutants exceeds the acceptable amount, alarms are sent to the user through the Internet. The MQ135 sensor is used, together with a microcontroller, to track indoor pollution [1]. Finally, a model which combines Arduino UNO hardware and software (Arduino IDE 2.2.1) with MQ135 and MQ7 sensors and a dust sensor is used to sense gases like NO2, CO, and PM2.5.
This model also monitors the air quality utilizing Thing Speak and hardware connected to the Internet through a Wi-Fi module [2]. The air-sensing system in [3] monitors the quality over a cloud-based platform and sounds an alarm when the quality goes below a certain level, which shows that there are a number of pollutants present in the surrounding air. The AQI scale becomes higher when the air is more hazardous to human health. The model in [4] combines the Arduino UNO hardware and software with gas sensors such as MQ135 and MQ7 and the dust sensor GP2Y1010AU0F, which aid in detecting gases like NO2, CO, and PM2.5 via accurate measurements. Additionally, the air quality is monitored using an IoT platform. In [5], sensors will collect data on a range and transmit it to a Raspberry Pi, which serves as a base station. On a Raspberry Pi 3-based webserver, the data are collected by sensors. To show these data on websites, a MEAN stack is created. Distribution to all stakeholders is the key component of the proposed task. The systemin [6] forecasts the city’s pollution level and also monitors air contaminants to produce alerts. It is made to accommodate gases produced by vehicle pollution.
A sensor-based hardware module in [7] that can be installed along roads is demonstrated. It can be mounted on lamp posts and send data wirelessly to a remote server, so that traffic can be managed using this information. Through a smartphone application, this system also offers information about air quality, enabling users to choose routes with good quality. Ref. [8] identified that the primary source of air pollution is transportation. To reduce air pollution, electric cars and bicycles can replace other types of transportation. This study shows how crucial it is to predict air pollution levels so that individuals can change their travel routes. An inexpensive, alternative IoT-based air quality monitor is described in [9]. It tracks air pollution in real time and communicates data quickly over a low-power wide-area network. A wide network of these monitors may provide a significant quantity of data, which can be analyzed in the cloud in real time and connected with the time of day, month, year, weather, and other aspects. The microcontroller and sensors communicate through the microcontroller, which collects data from the sensors, processes it, and communicates it to an online server using the IoT [10].
The system uses the IoT to identify the most dangerous airborne contaminants as well as louder noise levels. It also provides real-time updates on the degree of pollution. In summary, an air pollution surveillance system is essential for safeguarding the environment, the public’s health, and advancing sustainable development. It gives individuals and governments the power to make decisions that improve living standards and the quality of the environment. It can be helpful in reducing traffic pollution. Different sensors can be used for different ranges and accuracies. The solution presented here consists of a single air quality monitoring sensor which can sense ammonia, sulfur, benzene, carbon dioxide, smoke, and other similar harmful gases; a Wi-Fi module; and an alert system. This helps in keeping track of air quality, and in the case of excess pollutants, it helps in informing the pollution control board. An air pollution surveillance system can be used for real-time analysis. The Kalman filter was employed to increase the measuring device’s accuracy since it can make predictions even in the event that sensor data are missing. This paper is split into a description of the proposed system, the modeling of the air pollution surveillance system, and experimentation, with validation of the proposed work.
2. Proposed Air Pollution Surveillance System
The proposed air pollution surveillance system is shown in Figure 1. A power supply is connected to the Arduino UNO. The MQ-135 sensor detects ammonia, sulfur, benzene, carbon dioxide, smoke, and other similar harmful gases and sends them to the Arduino UNO. It is connected via the Wi-Fi module, as shown in Figure 1, which sends data when the pollution rate received from the gas sensor is high. Then, the data are sent to the pollution control board through a hybrid cloud that combines both public and private cloud resources, which takes steps and takes action towards reducing pollution in the air. Since the Kalman filter can make predictions even in the case of missing sensor data, it is used to boost the accuracy of the measuring instrument as shown in Figure 2, and the range of pollutants measured is given in Table 1.
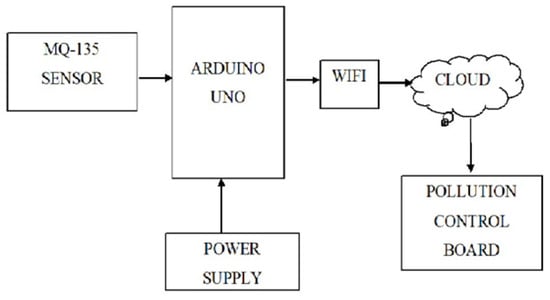
Figure 1.
Air pollution surveillance system.
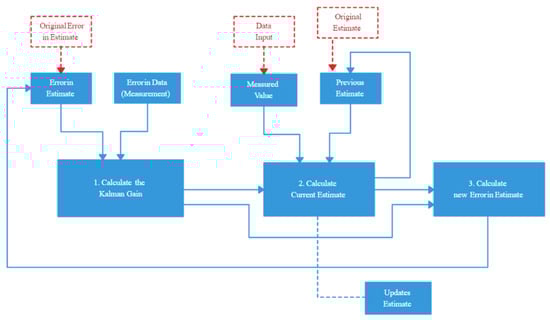
Figure 2.
Process of Kalman filter.

Table 1.
Pollutants measured and their range.
Alarm system algorithm:
Initialize the hardware components and serial communication.
Continuously read the analog value from the sensor.
If the analog value is greater than the threshold:
- Activate the alarm (red LED and buzzer).
- Display “ALERT” and “EVACUATE” on the LCD.
If the analog value is not greater than the threshold:
- Deactivate the alarm (turn off the red LED and buzzer).
- Display nothing or a different message on the LCD.
- Repeat the process in a loop.
3. Modeling of Air Pollution Surveillance System
As shown in Figure 3, connections are provided in accordance with the circuit. Data are sent from the MQ-135 to the alarm system which sounds and shows an alert message on the LCD when the level of smoke or pollution is excessive. The pollution control board receives data on a continuous basis along with the PPM value. The LCD shows a safe message when the pollution level is below the set threshold. When the circuit is closed, the safe green LED illuminates.
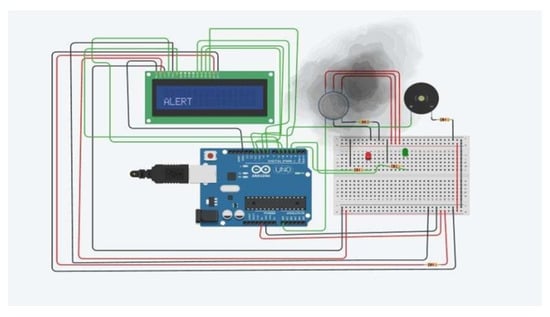
Figure 3.
APSS simulation.
The simulation of the proposed air pollution surveillance system is shown in Figure 3. The air pollution surveillance system, which provides the required alert in the form of an LED and LCD, is shown in Figure 4.
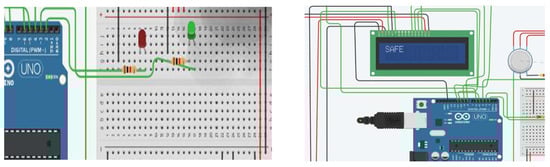
Figure 4.
Result of APSS for LED and LCD.
4. Experimentation of Air Pollution Surveillance System
In the developed APSS shown in Figure 5, components such as the MQ-135 gas sensor, Arduino UNO, Wi-Fi module, LCD display, alert system, and LED lights are used. Gases like CO2, smoke, alcohol, benzene, and NH3 are detected using the MQ-135 gas sensor. The gas sensor continuously monitors the quality of the air at the PPM level. When the PPM is higher than 1000, the LCD shows an alert message; otherwise, the safe message is displayed. The LED is green during the safe message, and the red LED is turned on when the alert message is displayed. The data from the gas sensor are sent through the Wi-Fi module to the pollution control board. The data are shown as PPM to the pollution control board. The alert system gives a sound when the PPM enters the danger level, and an alert message is also sent to the pollution control board. This helps the pollution control board take the required actions to control the pollution.
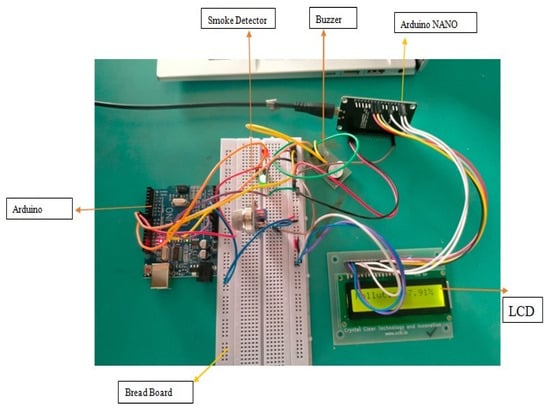
Figure 5.
Result of APSS.
Users can also connect to the Wi-Fi module and see the air quality of their locality, which helps them take the necessary measures. The data are displayed continuously with their PPM levels. There cursive mathematical process known as the Kalman filter determines the state of dynamics from a set of noisy measurements taken over time. It can be used to monitor and forecast pollutant concentrations in the context of air pollution monitoring using sensor data. The Arduino is connected to the LCD display, a bread board fixed with LEDs and an MQ-135 gas sensor, a Wi-Fi module, and an alert system.
On observing the range of each pollutant in the cement or petrochemical industry taken as examples, the measured pollutants and their range of PPM levels are shown in Figure 6. To analyze the data observed via the developed APSS, a regression model is created to forecast air quality using sensor data while taking into account variables including weather information, traffic patterns, and pollutants. Additionally, air quality categories (such as good, moderate, and harmful) are classified using classification algorithms based on preset thresholds. By continuously monitoring the PPM levels, the air quality can be detected, a safe environment can be implemented, and diseases influenced by air pollution such as cancer, asthma, kidney, liver, skin diseases, neurological disorders, etc., can be reduced. The people also receive an alert sound when they are connected through the Wi-Fi module when the PPM level becomes high and are shown the level of PPM and a message such as safe or alert. In such a way, a modern gas sensing unit is developed (Figure 5). By analyzing the model in a industry before and after using the Kalman filter, there is at least a 5% increase in accuracy and it showed a better performance. The results gained during the analysis are shown in Figure 6, which shows a bar graph between the gases sensed by the sensor and their ranges. Figure 7 shows the accuracy changes before and after applying the Kalman filter in the gases CO2 and NO2, respectively.
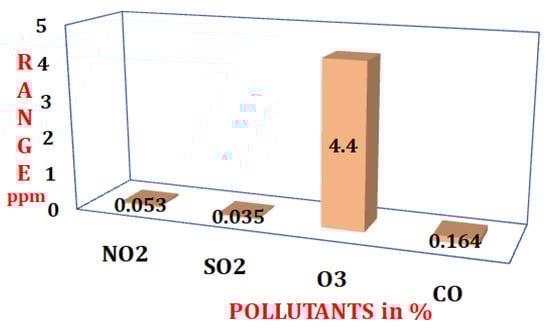
Figure 6.
Pollutants’ range from the cement or petrochemical industry.
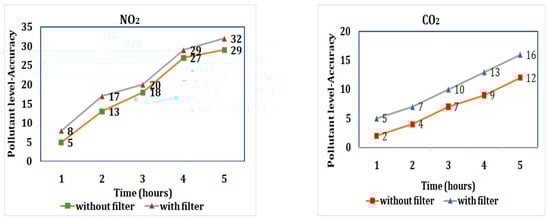
Figure 7.
Accuracy of NO2 and CO2 measurement before and after filter.
5. Conclusions
The proposed APSS is cost-effective and handy. The fascinating feature of the proposed model is that it reports pollution to the pollution control board, which helps to address polluted areas as soon as they become polluted. The following conclusions are presented:
- ○
- A key aspect was to monitor pollution levels to create a profile of a city or region and predict risks at individual levels. This awareness can also lead people to make direct contributions to reduce pollution levels.
- ○
- This system can be upgraded by adding more sensors, so it is portable.
- ○
- There is no need for any application to be installed; the system sends data directly to the pollution control board.
- ○
- The process of the Kalman filter makes the system reliable as it has processing feature based upon previous values.
- ○
- It is found that the accuracy is increased after implementing a Kalman filter.
- ○
- The proposed system was tested successfully, and it is able to sense gases in a range of 10 to 1000 ppm and process them with a Kalman filter. Making the model more reliable and accurate helps in sending air quality data. This system can be used as a warning system when the air quality becomes severe, and measures could be taken to prevent it.
Author Contributions
Conceptualization, V.L. and D.R.; methodology, V.D.; software, U.M.K.; validation, V.L., V.D. and R.K.; investigation, R.K.; writing—original draft preparation, V.L. and V.D.; writing—review and editing, supervision, V.L. and U.M.K. All authors have read and agreed to the published version of the manuscript.
Funding
This research received no external funding.
Institutional Review Board Statement
Not applicable.
Informed Consent Statement
Not applicable.
Data Availability Statement
Data are available in this manuscript.
Conflicts of Interest
The authors declare no conflict of interest.
References
- Kodali, R.K.; Pathuri, S.; Raj Narayanan, S.C. Smart Indoor Air Pollution Monitoring Station. In Proceedings of the International Conference on Computer Communication and Informatics (ICCCI), Coimbatore, India, 22–24 January 2020; pp. 1–5. [Google Scholar]
- Saikumar, C.V.; Reji, M.; Kishoreraja, P.C. IOT based air quality monitoring system. Int. J. Pure Appl. Math. 2017, 117, 53–57. [Google Scholar]
- Sahoo, B.; Maharana, A.; Murali, M.; Shivani, L.; Suganya, G.; Premalatha, M. Low-Cost Air Sensing System. In Proceedings of the 2019 3rd International Conference on Computing and Communications Technologies (ICCCT), Chennai, India, 21–22 February 2019; pp. 258–267. [Google Scholar]
- Jha, R.K. Air Quality Sensing and reporting System Using IoT. In Proceedings of the Second International Conference on Inventive Research in Computing Applications (ICIRCA), Coimbatore, India, 15–17 July 2020; pp. 790–793. [Google Scholar]
- Parmar, G.; Lakhani, S.; Chattopadhyay, M.K. An IoT based low-cost air pollution monitoring system. In Proceedings of the International Conference on Recent Innovations in Signal processing and Embedded Systems (RISE), Bhopal, India, 27–29 October 2017; pp. 524–528. [Google Scholar]
- Kanpur Rani, V.; Vallikanna, A.L. Air Pollution Monitoring System using Internet of Vehicles and Pollution Sensors. In Proceedings of the 4th International Conference on Electronics, Communication and Aerospace Technology (ICECA), Coimbatore, India, 5–7 November 2020; pp. 249–252. [Google Scholar]
- Muthukumar, S.; Sherine Mary, W.; Jayanthi, S.; Kiruthiga, R.; Mahalakshmi, M. IoT Based Air Pollution Monitoring and Control System. In Proceedings of the International Conference on Inventive Research in Computing Applications (ICIRCA), Coimbatore, India, 11–12 July 2018; pp. 1286–1288. [Google Scholar]
- Jiyal, S.; Saini, R.K. Prediction and Monitoring of Air Pollution Using Internet of Things (IoT). In Proceedings of the Sixth International Conference on Parallel, Distributed and Grid Computing (PDGC), Waknaghat, India, 6–8 November 2020; pp. 57–60. [Google Scholar]
- McGrath, S.; Flanagan, C.; Zeng, L.; O’Leary, C. IoT Personal Air Quality Monitor. In Proceedings of the 31st Irish Signals and Systems Conference (ISSC), Letterkenny, Ireland, 11–12 June 2020; pp. 1–4. [Google Scholar]
- Nowshin, N.; Hasan, M.S. Microcontroller Based Environmental Pollution Monitoring System though IoT Implementation. In Proceedings of the 2nd International Conference on Robotics, Electrical and Signal Processing Techniques (ICREST), Dhaka, Bangladesh, 5–7 January 2021; p. 493498. [Google Scholar]
Disclaimer/Publisher’s Note: The statements, opinions and data contained in all publications are solely those of the individual author(s) and contributor(s) and not of MDPI and/or the editor(s). MDPI and/or the editor(s) disclaim responsibility for any injury to people or property resulting from any ideas, methods, instructions or products referred to in the content. |
© 2023 by the authors. Licensee MDPI, Basel, Switzerland. This article is an open access article distributed under the terms and conditions of the Creative Commons Attribution (CC BY) license (https://creativecommons.org/licenses/by/4.0/).