Proceeding Paper

Indoor Air Quality Assessment Using a Low-Cost Sensor: A Case Study in Ikere-Ekiti, Nigeria †

by
Ademola Adamu
1,
Kikelomo Mabinuola Arifalo
1 and
Francis Olawale Abulude
2,*
1
Department of Chemical Sciences, Bamidele Olumilua University of Education, Science and Technology, Ikere-Ekiti 361101, Ekiti State, Nigeria
2
Environmental and Sustainable Research Group (ESRG), Science and Education Development Institute, Akure 340214, Ondo State, Nigeria
*
Author to whom correspondence should be addressed.
Presented at the 10th International Electronic Conference on Sensors and Applications (ECSA-10), 15–30 November 2023; Available online: https://ecsa-10.sciforum.net/.
Eng. Proc. 2023, 58(1), 42; https://doi.org/10.3390/ecsa-10-16021
Published: 15 November 2023

Abstract

:
Individuals who spend most of their time indoors are especially sensitive to indoor air quality (IAQ), which significantly impacts their general well-being and health. Traditional IAQ measurement techniques, however, are frequently pricy, complicated, and labor-intensive. In this study, we used a low-cost, simple-to-use, and handy sensor system to track the levels of carbon dioxide (CO2), nitrogen dioxide (NO2), ozone (O3), particulate matter (PM1.0, PM2.5, and PM10), temperature, and relative humidity (RH) in a laboratory at the Bamidele Olomilua University of Education, Science, and Technology in Ikere-Ekiti for a month. We contrasted the outcomes with other benchmarks and WHO recommendations. However, the NO2 levels (144.00–303.00 ppb) exceeded the suggested levels (National Institute for Occupational Safety and Health (NIOSH)—70 ppb; National Ambient Air Quality Standards (NAAQS)—100 ppb; National Environmental Standards and Regulations Enforcement Agency (NESREA)—120 ppb; and World Health Organization (WHO)—25 ppb), suggesting a possible cause of indoor contaminants. We also noticed that the temperature and humidity varied considerably throughout the day, which impacted the inhabitants’ thermal comfort and ventilation. The principal component analysis (PCA) findings indicate that particulate matter, the weather, photochemical reactions, and combustion processes are the key contributors to fluctuation in the air quality measurements. Based on their quantities and relationships, these elements can have a variety of effects on both the natural environment as well as well-being. Our monitoring device can give immediate information and warnings, assisting in locating and reducing indoor airborne pollutant sources and enhancing indoor air quality (IAQ). This work shows that adopting a low-cost sensor system for IAQ measurement in underdeveloped nations, where such data are sparse and frequently erroneous, is both feasible and beneficial.

1. Introduction

Indoor air quality (IAQ) issues have received a lot of attention recently because of their considerable effects on human health and well-being [1]. A variety of respiratory and cardiovascular problems can develop as a result of the increase of pollutants like carbon dioxide (CO2), nitrogen dioxide (NO2), ozone (O3), and particulate matter (PM) of different sizes (PM1.0, PM2.5, and PM10) in indoor environments, which can lower quality of life [1]. IAQ must be rigorously assessed and monitored in order to overcome these issues. While earlier studies have looked at IAQ in a variety of contexts, this study takes a fresh approach by using inexpensive sensors to thoroughly assess the indoor air quality parameters in Ikere-Ekiti, Nigeria.
This study is innovative in that it uses inexpensive sensors to assess a wide range of indoor air quality parameters, including CO2, NO2, O3, PM1.0, PM2.5, and PM10, in an interior environment and this work is the first of its kind in Ikere-Ekiti. The scope and breadth of IAQ assessments are constrained by traditional research’s frequent reliance on pricy monitoring apparatus [1]. Especially in resource-limited places, this work pioneers the use of accessible sensor technologies, enabling extensive data gathering and creating a more inclusive understanding of IAQ dynamics.
Although earlier IAQ studies [2,3,4] have provided insightful information, they frequently concentrate on certain pollutants or make use of expensive monitoring tools, which limits the breadth and depth of data collection. On the other hand, our study covers a wide range of CO2, NO2, O3, and different PM fractions in addition to single pollutants. Furthermore, the incorporation of low-cost sensors allows for broader spatial coverage and long-term data collection, facilitating a more nuanced analysis of IAQ trends and patterns in Bamidele Olumilua University of Education, Science and Technology, Ikere-Ekiti (BOUESTI).
The primary objectives of this study are to provide a holistic assessment of indoor air quality by measuring CO2, NO2, O3, PM1.0, PM2.5, and PM10 levels in a medical laboratory indoor environment at BOUESTI health center. This multifaceted approach enables a deeper understanding of IAQ variations and potential sources of pollutants and by correlating the IAQ data with established air quality standards and guidelines, the study intends to evaluate the potential health risks posed by indoor pollutants. Lots of anthropogenic activities take place in this laboratory; unfortunately, in the room there is low ventilation (no fan, air conditioner, or fume extractor). This analysis will shed light on the implications for the well-being of its occupants and help formulate recommendations for IAQ improvement strategies.
In conclusion, this paper sets out to advance our understanding of indoor air quality by embracing innovation in sensor technology and adopting a holistic approach. By extending the scope of assessment to encompass multiple IAQ parameters and employing cost-effective sensor solutions, this study seeks to provide actionable insights for policymakers, building managers, and residents to enhance indoor environments and promote public health in BOUESTI and Ikere-Ekiti, Nigeria.

2. Materials and Methods

The study area was located at a medical laboratory at the Bamidele Olomilua University of Education, Science, and Technology Health Center (7.4952° N and 5.1747° E) in Ikere-Ekiti (Latitude: 7.5000° N 5.2333° E), Ekiti State (7.40001° N 5.15000° E), Nigeria, which is situated in the southwest of the nation. In terms of agriculture, transportation, industry, housing, and population, the town and its environs are expanding swiftly. The monitoring was continuous for 24 h during the rainy season period and was performed for a month (19 July–18 August 2023) as a preliminary study using a low-cost sensor (Model: SentinAir S3) developed and designed by a group of researchers from the Italian National Agency for New Technologies, Energy, and the Environment (ENEA), Department of Sustainable Development, Brindisi Research Center, Italy [5]. Following the correct procedures [5], the sensor, which was suspended four meters in the air while fixed on a rack, was able to detect the presence of carbon dioxide (CO2), nitrogen dioxide (NO2), ozone (O3), particulate matter (PM1.0, PM2.5, and PM10), temperature, and relative humidity (RH). The pollutants’ PCA was established. The locations of the sampling sites were located with the aid of a Garmin satellite navigator. The produced data were statistically examined using Minitab and Excel versions.

3. Results and Discussion

The results (Table 1) reveal CO2 concentrations of 537.48 ± 46.91 ppm, which are lower than the results (856.9 ± 400 and 987 ± 400 ppm) reported by Obisesan and Weli [6], 10,000 ppm NIOSH [7] and 1000 ppm WHO [8] (Figure 1). Though the figures might vary slightly depending on measurement methods and locations, this value aligns with the overall upward trend observed in recent decades. A comparative analysis of these studies provides a comprehensive view of how CO2 concentrations have changed over time and across regions. NO2 and O3 concentrations vary thus: 197.91 ± 34.93 ppb, 2.03 (skewness), 2.61 (kurtosis) and 0.16 ± 14.72 ppb, −1.55 (skewness), 0.83 (kurtosis). The PM1, PM2.5, and PM10 levels were measured at 9.59 µg/m3, 14.14 µg/m3, and 15.09 µg/m3, respectively, indicating a gradual increase in particle size. The PM2.5 and PM10 concentrations are higher, reflecting their greater prevalence and potential health risks. A temperature of 32.76 °C can impact particle dynamics. Warmer temperatures may enhance atmospheric turbulence, leading to particle dispersion and dilution, potentially lowering PM concentrations [9]. With a relative humidity of 58.50%, particles could experience hygroscopic growth, causing them to absorb water and become larger. Higher RH might also aid in particle settling, potentially contributing to lower airborne PM levels. Understanding the intricate interplay between PM sizes, temperature, and relative humidity is crucial for accurate air quality assessments and effective pollution management strategies [10].
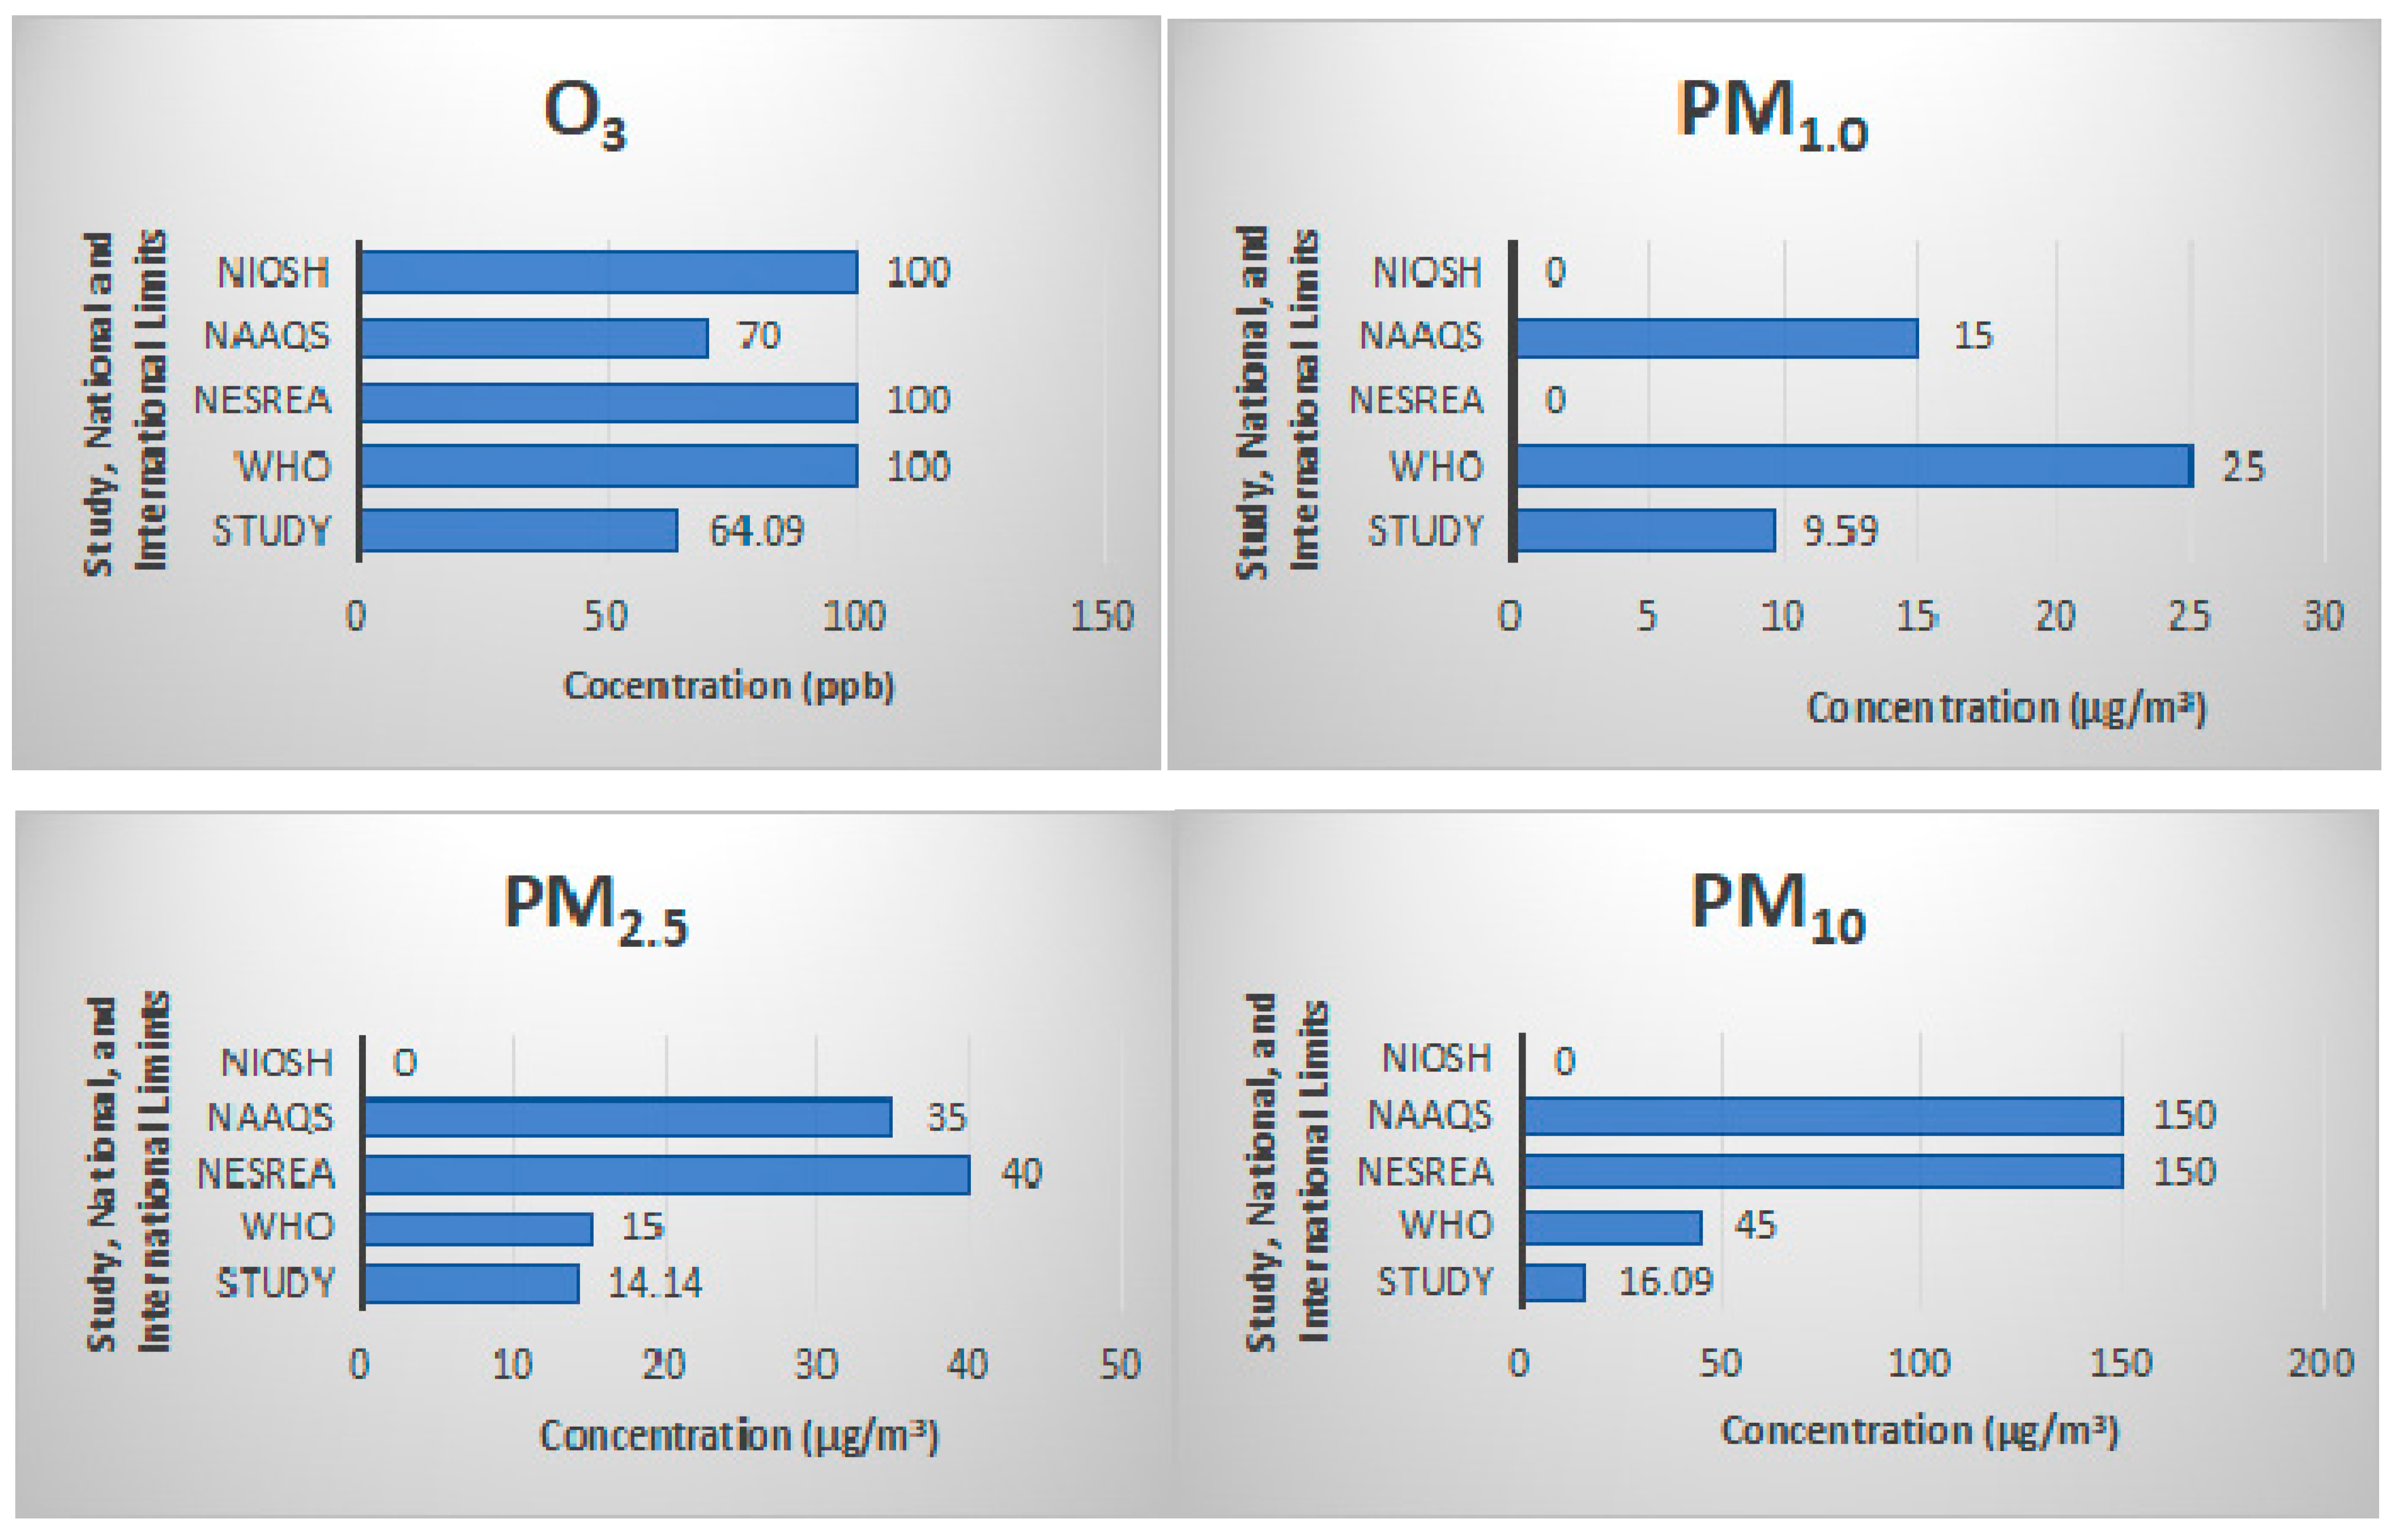
Figure 1 shows the NO2 concentration of 197.91 ppb and contrasts it with daily international guidelines set by NIOSH, NAAQS, NESERA, and the WHO. The observed NO2 concentration surpasses the 70 ppb [7], 100 ppb [11], 120 NESERA [12] 120 ppb, and 25 ppb WHO [8] limits. This discrepancy is attributed to excessive NO2 emission due to heavy vehicular movement within the study area. Effective pollution control measures and collaborative efforts are essential to curb NO2 levels and ensure a healthier and cleaner environment. The recorded O3 concentration falls below NIOSH’s 100 ppb, NAAQS’s 70 ppb, NESERA’s 100 ppb, and the WHO’s 100 ppb limits. While it adheres to most standards, its proximity to these thresholds necessitates vigilant monitoring. Ozone at elevated levels can exacerbate respiratory conditions and harm vegetation. While the observed concentration meets many standards, the closeness to limit values still implies potential health and ecological risks. The impacts of this pollutant can lead to complex health outcomes. The PM1.0 concentration of 9.59 µg/m3 falling below international standards is due to the low volume of vehicular and human activities because the institution is not in session. Maintaining this trend requires efforts to minimize emissions, improve air quality, and safeguard both human health and the environment. The recorded PM2.5 concentration is below NAAQS’s 35 µg/m3, and NESERA’s 40 µg/m3, but comparable to the WHO’s 15 µg/m3 standard. The differences in standards emphasize the need for harmonization and stringent measures to curb PM2.5 pollution. The recorded PM10 concentration is below NAAQS’s 150 µg/m3, NESERA’s 150 µg/m3, and the WHO’s 45 µg/m3 standards. The reasons for these differences could be due to the location of the monitoring station, meteorological parameters, time of day (especially rush hour), and season [13]. Also, the temperature and humidity did not have much effect due to the presence of standing and ceiling fans working and window ventilation.
According to the study’s PCA results, particulate matter (PM1, PM2.5, and PM10) showed substantial loading in PC1 (0.515, 0.524, and 0.522, respectively). High positive loadings show that PM concentrations tend to rise concurrently, which points to a general source of air pollution that affects a range of particle sizes, like vehicle emissions. The primary causes of variation in the air quality measurements are photochemical reactions and combustion processes, which are connected to atmospheric variables (temperature (−0.549) and relative humidity (0.544)) captured via PC2. Nitrogen dioxide (−0.689) and ozone (0.676) concentration fluctuation was recorded via PC3. This is a sign of intricate interactions in atmospheric chemistry or frequent sources of pollution, such as exhaust from moving vehicles.

4. Conclusions

This study assessed the indoor air quality of a BOUSTI by measuring CO2, NO2, O3, PM1.0, PM2.5, and PM10 levels in a laboratory at the BOUESTI health center. The results obtained were compared to international and national IAQ data established standards and guidelines. Based on the recorded PM1 (9.59 µg/m3), PM2.5 (14.14 µg/m3), and PM10 (15.09 µg/m3) concentrations, the air quality is within the safe limits of NAAQS’s 150 µg/m3, NESERA’s 150 µg/m3, and the WHO’s 45 µg/m3 standards. The simple fact is that the institution is on holiday, so there are minimal vehicular and human movements that could have caused elevated pollutants. The temperature and humidity did not have much effect due to the presence of standing and ceiling fans working and window ventilation.

Author Contributions

Conceptualization, A.A., K.M.A. and F.O.A.; methodology, F.O.A.; software, A.A.; validation, K.M.A. and F.O.A.; formal analysis, A.A.; investigation, A.A. K.M.A.; resources, F.O.A.; data curation, K.M.A.; writing—original draft preparation, F.O.A.; writing—review and editing, A.A. and K.M.A.; visualization, A.A., K.M.A. and F.O.A.; project administration, A.A.; funding acquisition, K.M.A. All authors have read and agreed to the published version of the manuscript.

Funding

This research was funded by the Tertiary Education Trust Fund (TETFUND), Nigeria, grant number TETF/RD&D/UNI/IKERE/IBR/2021/VOL.1.

Institutional Review Board Statement

Not applicable.

Informed Consent Statement

Not applicable.

Data Availability Statement

Data are unavailable due to privacy.

Acknowledgments

The authors are grateful to TETFUND, Nigeria for providing the funds used in this study. Also, the authors thank Adeoluwa, O.V and Faloye, B.O. (Centre for Research and Development (CERAD)), Bamidele Olumilua University of Education, Science, and Technology, Ikere-Ekiti, Ekiti State, Nigeria for approving the funds. Lastly, the authors appreciate the individuals who hosted the sensors deployed in their residents and offices.

Conflicts of Interest

The authors declare no conflicts of interest.

References

  1. Abulude, F.O. Right and Cheap Information on Air Quality: The Cases of Real-time Air Quality Index Monitors (Satellite and Phone apps). Acad. Lett. 2021, 2, 3401. [Google Scholar] [CrossRef]
  2. Schibuola, L.; Tambani, C. Indoor environmental quality classification of school environments by monitoring PM and CO2 concentration levels. Atmos. Pollut. Res. 2020, 11, 332–342. [Google Scholar] [CrossRef]
  3. Cordell, R.L.; Panchal, R.; Bernard, E.; Gatari, M.; Waiguru, E.; Ng’ang’a, M.; Nyang’aya, J.; Ogot, M.; Wilde, M.J.; Wyche, K.P.; et al. Volatile Organic Compound Composition of Urban Air in Nairobi, Kenya and Lagos, Nigeria. Atmosphere 2021, 12, 1329. [Google Scholar] [CrossRef]
  4. Feng, Y.; Yang, C.; Cao, X. Intermediate volatile organic compounds in Canadian residential air in winter: Implication to indoor air quality. Chemosphere 2023, 328, 138567. [Google Scholar] [CrossRef] [PubMed]
  5. Suriano, D. Users Guide Version (v. 1.3) Refers to the SentinAir system Version 1.3 Available at the Github SentinAir Repository. 2021. Available online: https://github.com/domenico-suriano/SentinAir (accessed on 10 October 2022).
  6. Obisesan, A.; Weli, V.E. Assessment of Air Quality Characteristics across Various Land-Uses in Port-Harcourt Metropolis. J. Environ. Pollut. Manag. 2019, 2, 106. [Google Scholar]
  7. NIOSH Pocket Guide to Chemical Hazards; U.S. Department of Health and Human Services, Public Health Service, Centers for Disease Control, National Institute for Occupational Safety and Health: Cincinnati, OH, USA, 1994; DHHS (NIOSH) Publication No. 94–116.
  8. WHO. Global air quality guidelines. In Particulate Matter (PM2.5 and PM10), Ozone, Nitrogen Dioxide, Sulfur Dioxide and Carbon Monoxide; World Health Organization: Geneva, Switzerland, 2021. [Google Scholar]
  9. Wang, J.; Xie, X.; Fang, C. Temporal and Spatial Distribution Characteristics of Atmospheric Particulate Matter (PM10 and PM2.5) in Changchun and Analysis of Its Influencing Factors. Atmosphere 2019, 10, 651. [Google Scholar] [CrossRef]
  10. Manisalidis, I.; Stavropoulou, E. Stavropoulos, A.; Bezirtzoglou, E. Environmental and Health Impacts of Air Pollution: A Review. Front. Public Health. 2020, 8, 14. [Google Scholar] [CrossRef] [PubMed]
  11. NAAQS. Reviewing National Ambient Air Quality Standards (NAAQS): Scientific and Technical Information; US EPA: Washington, DC, USA, 22 May 2023.
  12. National Environmental Standards and Regulations Enforcement Agency (Establishment) (Amended) Act, 2018; National Environmental (Air Quality Control); Federal Government Printer: Lagos, Nigeria, 2021; pp. B 3364–B 3374.
  13. Giemsa, E.; Soentgen, J.; Kuschi, T.; Beck, C.; Munkel, C.; Cyrys, J.; Pitz, M. Influence of Local Sources and Meteorological Parameters on the Spatial and Temporal Distribution of Ultrafine Particles in Augsburg, Germany. Front. Environ. Sci. 2021, 8, 609846. [Google Scholar] [CrossRef]
Figure 1. The comparisons of the results with the national and international standards.
Engproc 58 00042 g001aEngproc 58 00042 g001b
Table 1. Description of the results of the pollutants and weather parameters.
ParameterMeanStDevCoefVarMinQ1Q3Maxskewnesskurtosis
CO2 (ppm)537.4846.918.7357.60511.67557.501505.902.6037.62
NO2 (ppb)197.9134.9317.65144.00180.00193.00303.002.032.61
O3 (ppb)0.1614.7222.9612.0068.0072.0077.00−1.550.83
PM1.0 (µg/m3)9.595.8360.780.005.0014.0064.001.295.92
PM2.5 (µg/m3)14.148.8862.800.008.0020.00124.001.9311.92
PM10 (µg/m3)15.0910.1967.520.008.0020.00196.002.8223.49
Temp (oC)32.761.454.4423.9031.0033.8035.90−0.732.46
RH (%)58.503.936.7249.5056.5060.0091.902.7414.74
Disclaimer/Publisher’s Note: The statements, opinions and data contained in all publications are solely those of the individual author(s) and contributor(s) and not of MDPI and/or the editor(s). MDPI and/or the editor(s) disclaim responsibility for any injury to people or property resulting from any ideas, methods, instructions or products referred to in the content.