Proceeding Paper

The Detection of E. coli and S. aureus on Sensors without Immobilization by Using Impedance Spectroscopy †

1
Physics Department, Faculty of Electrical Engineering, Czech Technical University in Prague, 16227 Prague, Czech Republic
2
Biological Physics and Medical Informatics Department, Bukovinian State Medical University, 58000 Chernivtsi, Ukraine
3
Electronics and Energy Department, Applied-Physics and Computer Sciences Institute, Yuriy Fedkovich Chernivtsi National University, 58012 Chernivtsi, Ukraine
*
Author to whom correspondence should be addressed.
Presented at the 10th International Electronic Conference on Sensors and Applications (ECSA-10), 15–30 November 2023; Available online: https://ecsa-10.sciforum.net/.
Eng. Proc. 2023, 58(1), 79; https://doi.org/10.3390/ecsa-10-16073
Published: 15 November 2023

Abstract

:
The impedance spectroscopy method (AC f = 4–8 MHz at a constant amplitude of 1 V) and Pt-IDE sensors were used to detect and monitor different concentrations (103, 106, and 109 CFU/mL) of both live and dead bacteria cells (Escherichia coli and Staphylococcus aureus). The analysis of the impedance spectra shows the differences in resistance with increasing concentrations for both types of bacteria and the presence of characteristic changes in the frequency range 10–100 kHz. The presence of live bacteria led to a decrease in the impedance value compared to dead cells, and the value of Rs + Rct decreased about two times.

1. Introduction

The detection of bacteria is important in various fields, including healthcare, food safety, and environmental monitoring. The rapid and accurate identification of bacterial pathogens such as Escherichia coli (E. coli) and Staphylococcus aureus (S. aureus) is essential for public health and safety. Traditional methods of bacterial detection often involve time-consuming sample preparation steps, specialist personnel, and equipment that involves complex analyses. In the last decade, more innovative methods have been developed that greatly simplify the approach to the real-time detection of bacteria [1,2,3,4], such as electrical impedance spectroscopy (EIS).
Electrical impedance spectroscopy (EIS) is used to study various biological samples in suspension and is capable of characterizing their properties [5,6,7,8]. The native negative surface charge on live bacterial cells enables their detection and characterization using electrical impedance measurements. The impedance Z is the ratio of the applied voltage to the measured current and is a function of resistance (R), capacitance (C), and the applied frequency: Z = V/I = R + 1/j ω C [7,9].
The metabolic activity of bacteria can be controlled by changes in the conductivity of the nutrient medium [10,11,12]. EIS has successfully been used to monitor changes related to adhesion, the growth of bacteria, and their behavior in real time [1,2,3]. The impedance-based detection of bacteria has several advantages over more traditional detection methods, such as low cost, versatility, and ease of implementation [5,6]. However, very few works have been devoted to the direct detection of bacteria by impedance spectroscopy on interdigitated electrode (IDE) sensors without bacterial immobilization [1,6,13]. Modern biosensors typically require the immobilization of specific antibodies onto the surface of the sensor to offer high specificity but have a low sensitivity mainly due to low capture efficiency (<35%), even after careful optimization [2,14]. Therefore, the search for alternative methods of bacteria detection that do not depend on the immobilization of the electrode surface is still relevant.
In this paper, we introduce the principle, methodology, and application of direct detection of E. coli and S. aureus on IDE sensors using immobilization-free impedance spectroscopy. We propose an approach for the direct detection of bacteria on IDE sensors by measuring the change in impedance. This method avoids complex surface modification and immobilization stages, simplifying the detection process while maintaining high measurement sensitivity [6,9,11,13,15]. The presented method is capable of detecting bacterial concentration (103–109 CFU/mL) in a short time (30 s) across a wide frequency range (4–8 MHz) and demonstrates selectivity for two different types of bacterial cells (E. coli and S. aureus). We also demonstrate the ability to distinguish between live and dead cells. At the same time, the processes for preparing the sensor surface are simplified, thereby increasing the economic efficiency of this method and reducing the need for specialized personnel. There is an obvious prospect of practical application of this method for selective detection of various types of bacteria.

2. Materials and Methods

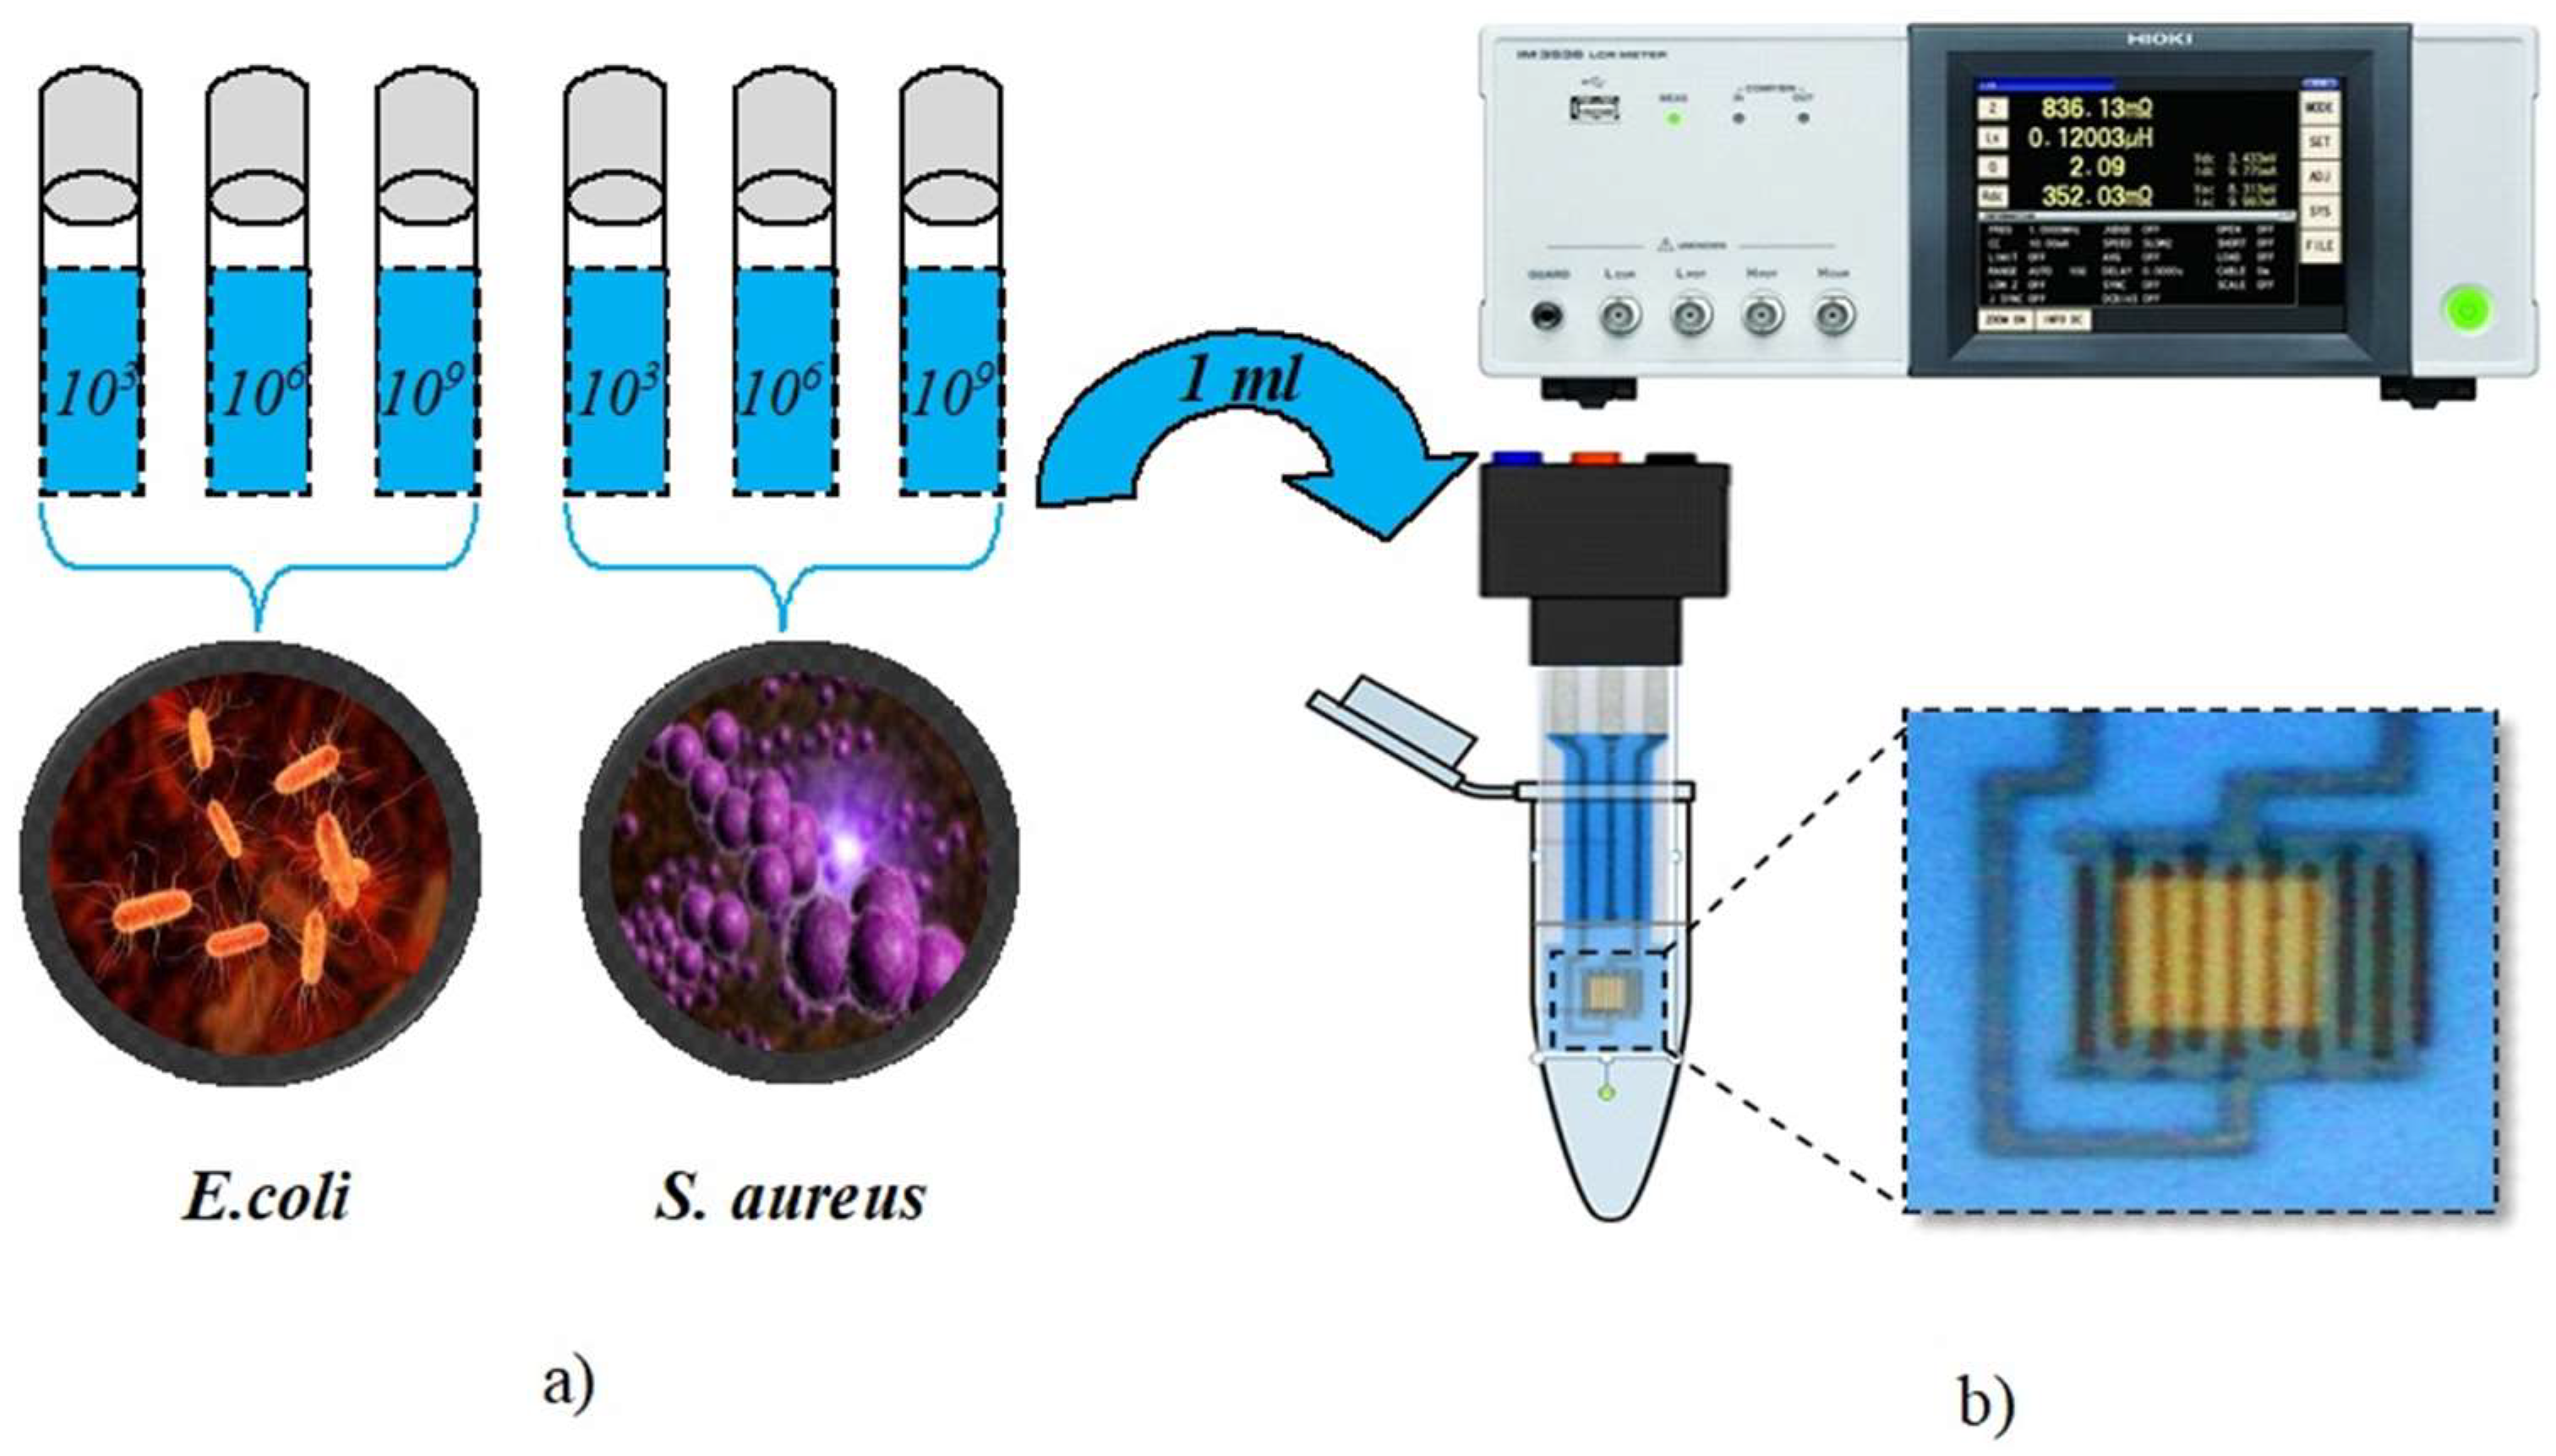
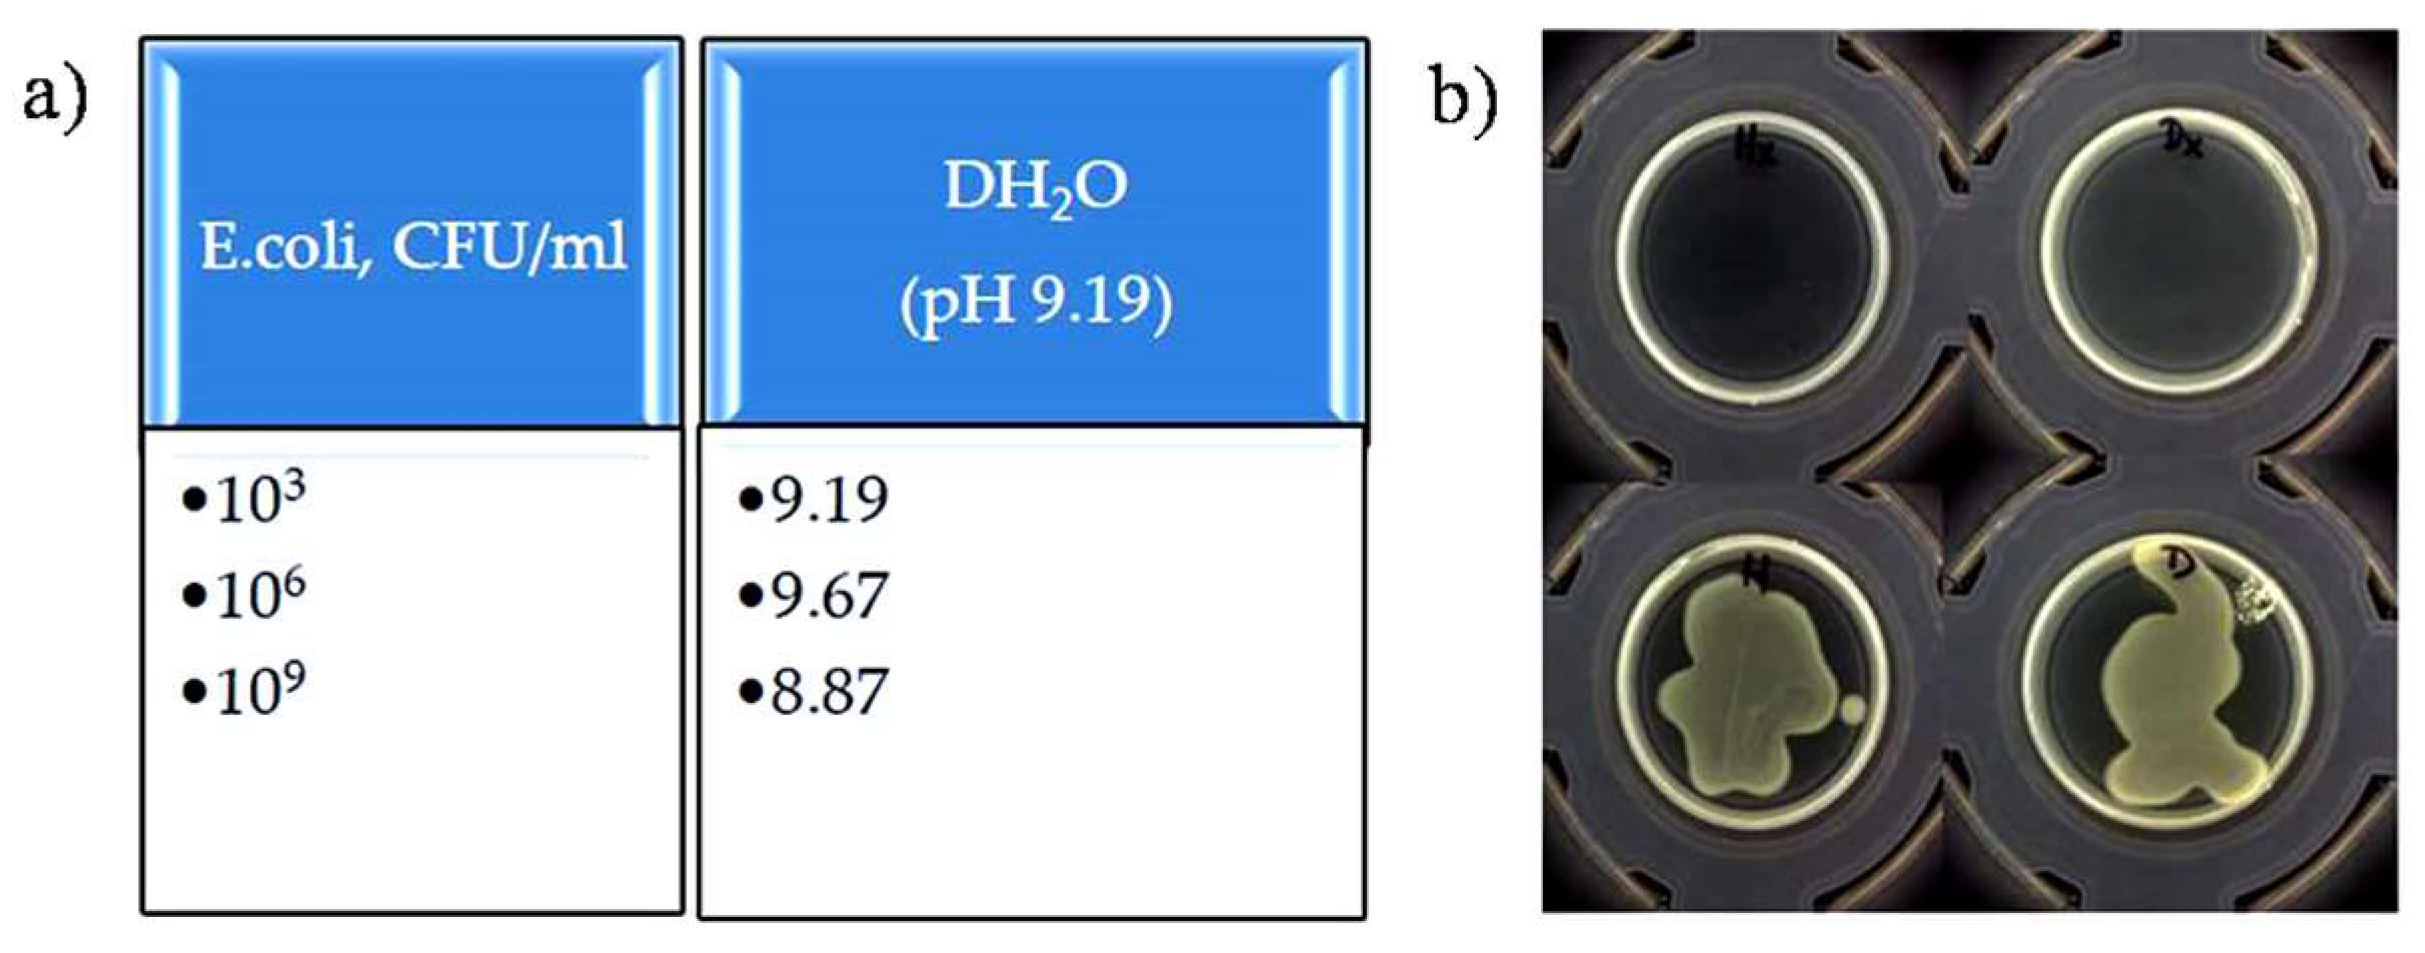
2.1. Preparation of the Biological Samples (Gram-Positive S. aureus and Gram-Negative E. coli)

Gram-negative E. coli (CCM3954) and Gram-positive S. aureus (CCM 3953) were stored at −20 °C in single-use vials and thawed at room temperature before use. A 1-in-10 dilution series was performed from the stock vial using sterile 0.9% NaCl (Penta), and 500 µL of each dilution was added to Petri dishes containing Mueller Hinton (MH) agar that were placed overnight in an incubator (37 °C). The following day, a single colony was removed from the MH agar plate and reconstituted in 5 mL MH broth and grown overnight at 37 °C in an orbital shaker (150 rpm). After culturing, the bacteria were centrifuged (13,000 rpm at 10 min) to separate bacterial cells from MH broth and resuspended in sterile deionized water (DH2O, (σ) = 0.1 μS/cm). This process was repeated additionally two times to remove any residual MH broth. To obtain dead bacteria, the first wash step was preceded by an additional wash using 99.9% ethanol and the absence of live bacteria was confirmed by the absence of growth on MH agar. The bacteria were then adjusted to McFarland’s density 6.0, which is equivalent to 1.8 × 10⁹ colony forming units per milliliter(CFU/mL) before sequential dilution using DH2O to the desired concentrations (103, 106, and 109 CFU/mL).

2.2. Preparation of the IDE Sensor Surface

Prior to use, the surface of the IDE sensor platform was cleaned with isopropanol then rinsed with deionized water and dried under a stream of nitrogen.

2.3. Electrical Impedance Measurements

The electrical impedance spectroscopy (EIS) measurements with IDE sensors type CC1.Au and CC1.Pt (BVT Technologies, Czech Republic) were made by using an IM 3536 LCR meter and application software (V1.40 Hioki, Nagano, Japan) in the frequency range from 4 Hz up to 8 MHz. The sample was placed in a Faraday cage. The electrodes were fixed using a clamp and connected to the LCR meter. Experimental Nyquist plots of the impedance −Zim = f(Zrel) were constructed to analyze the electron transport processes occurring at the interface of the Pt-IDE sensor and two types of bacteria cells (E. coli and S. aureus). All measurements were conducted at a temperature of 24 ± 1 °C, the immersion sample volume was 1 mL. The general scheme of the proposed method for the detection of bacteria using impedance spectroscopy on IDE sensors is shown in Figure 1.

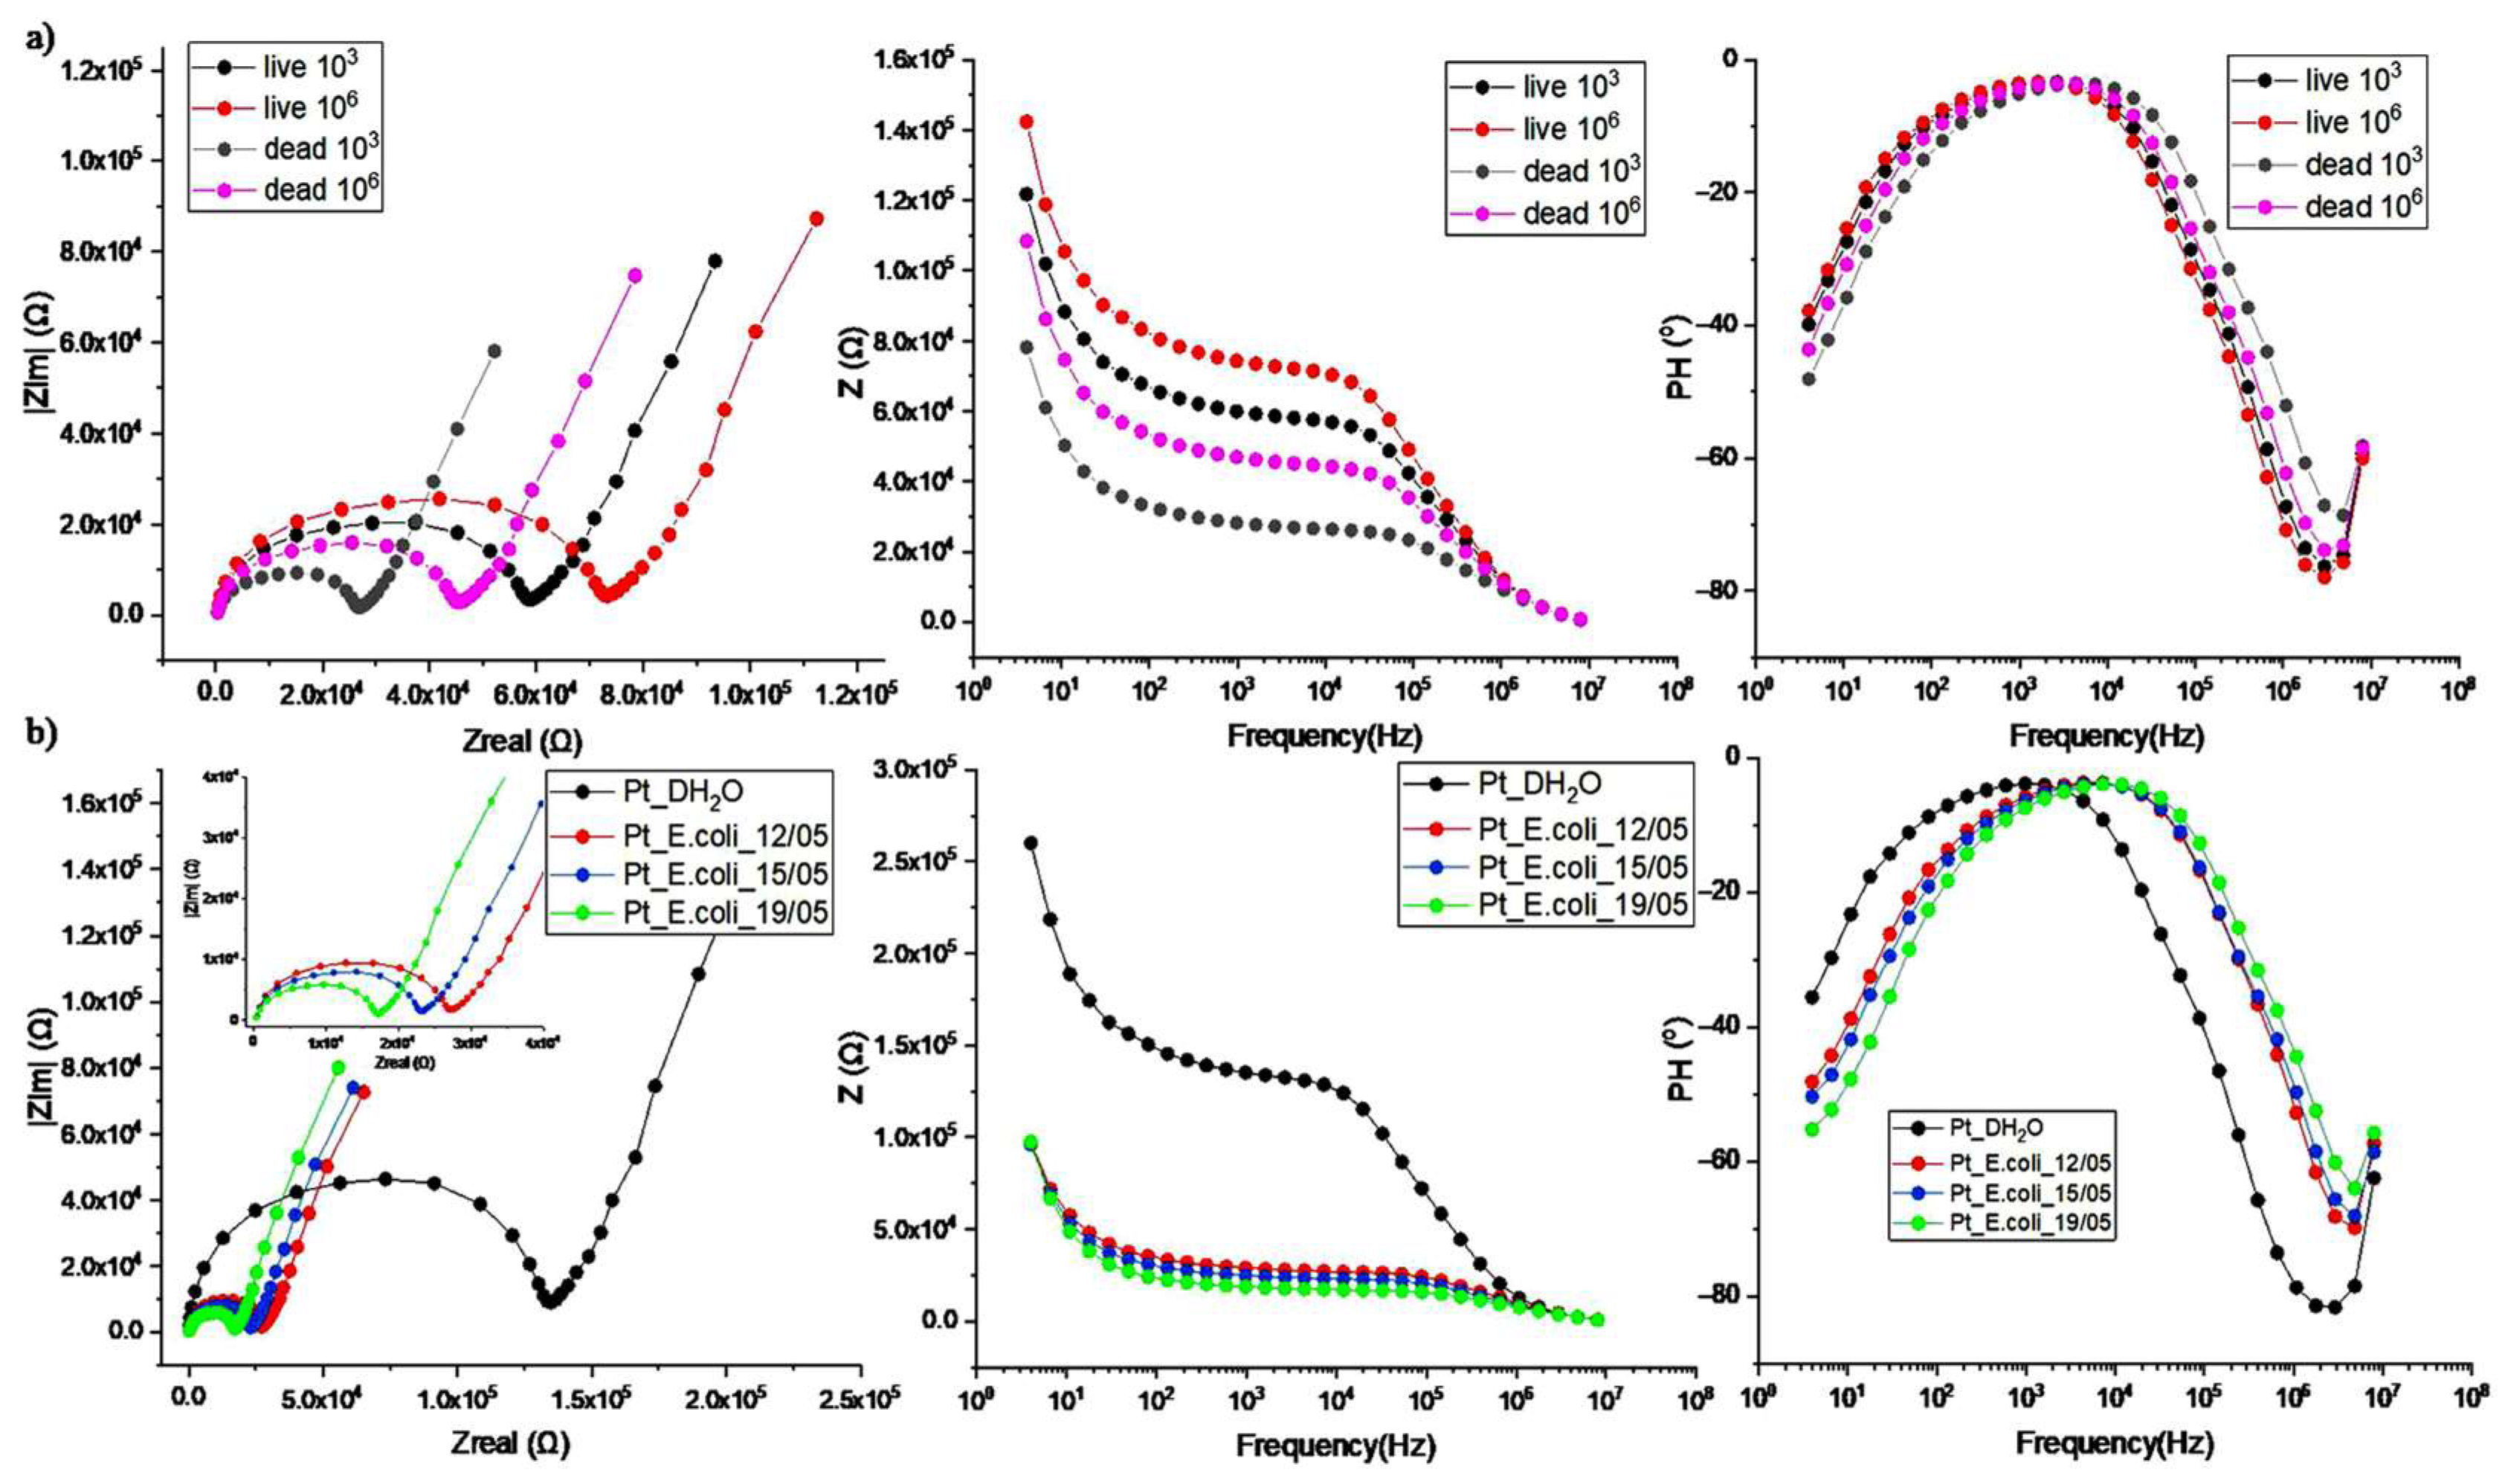
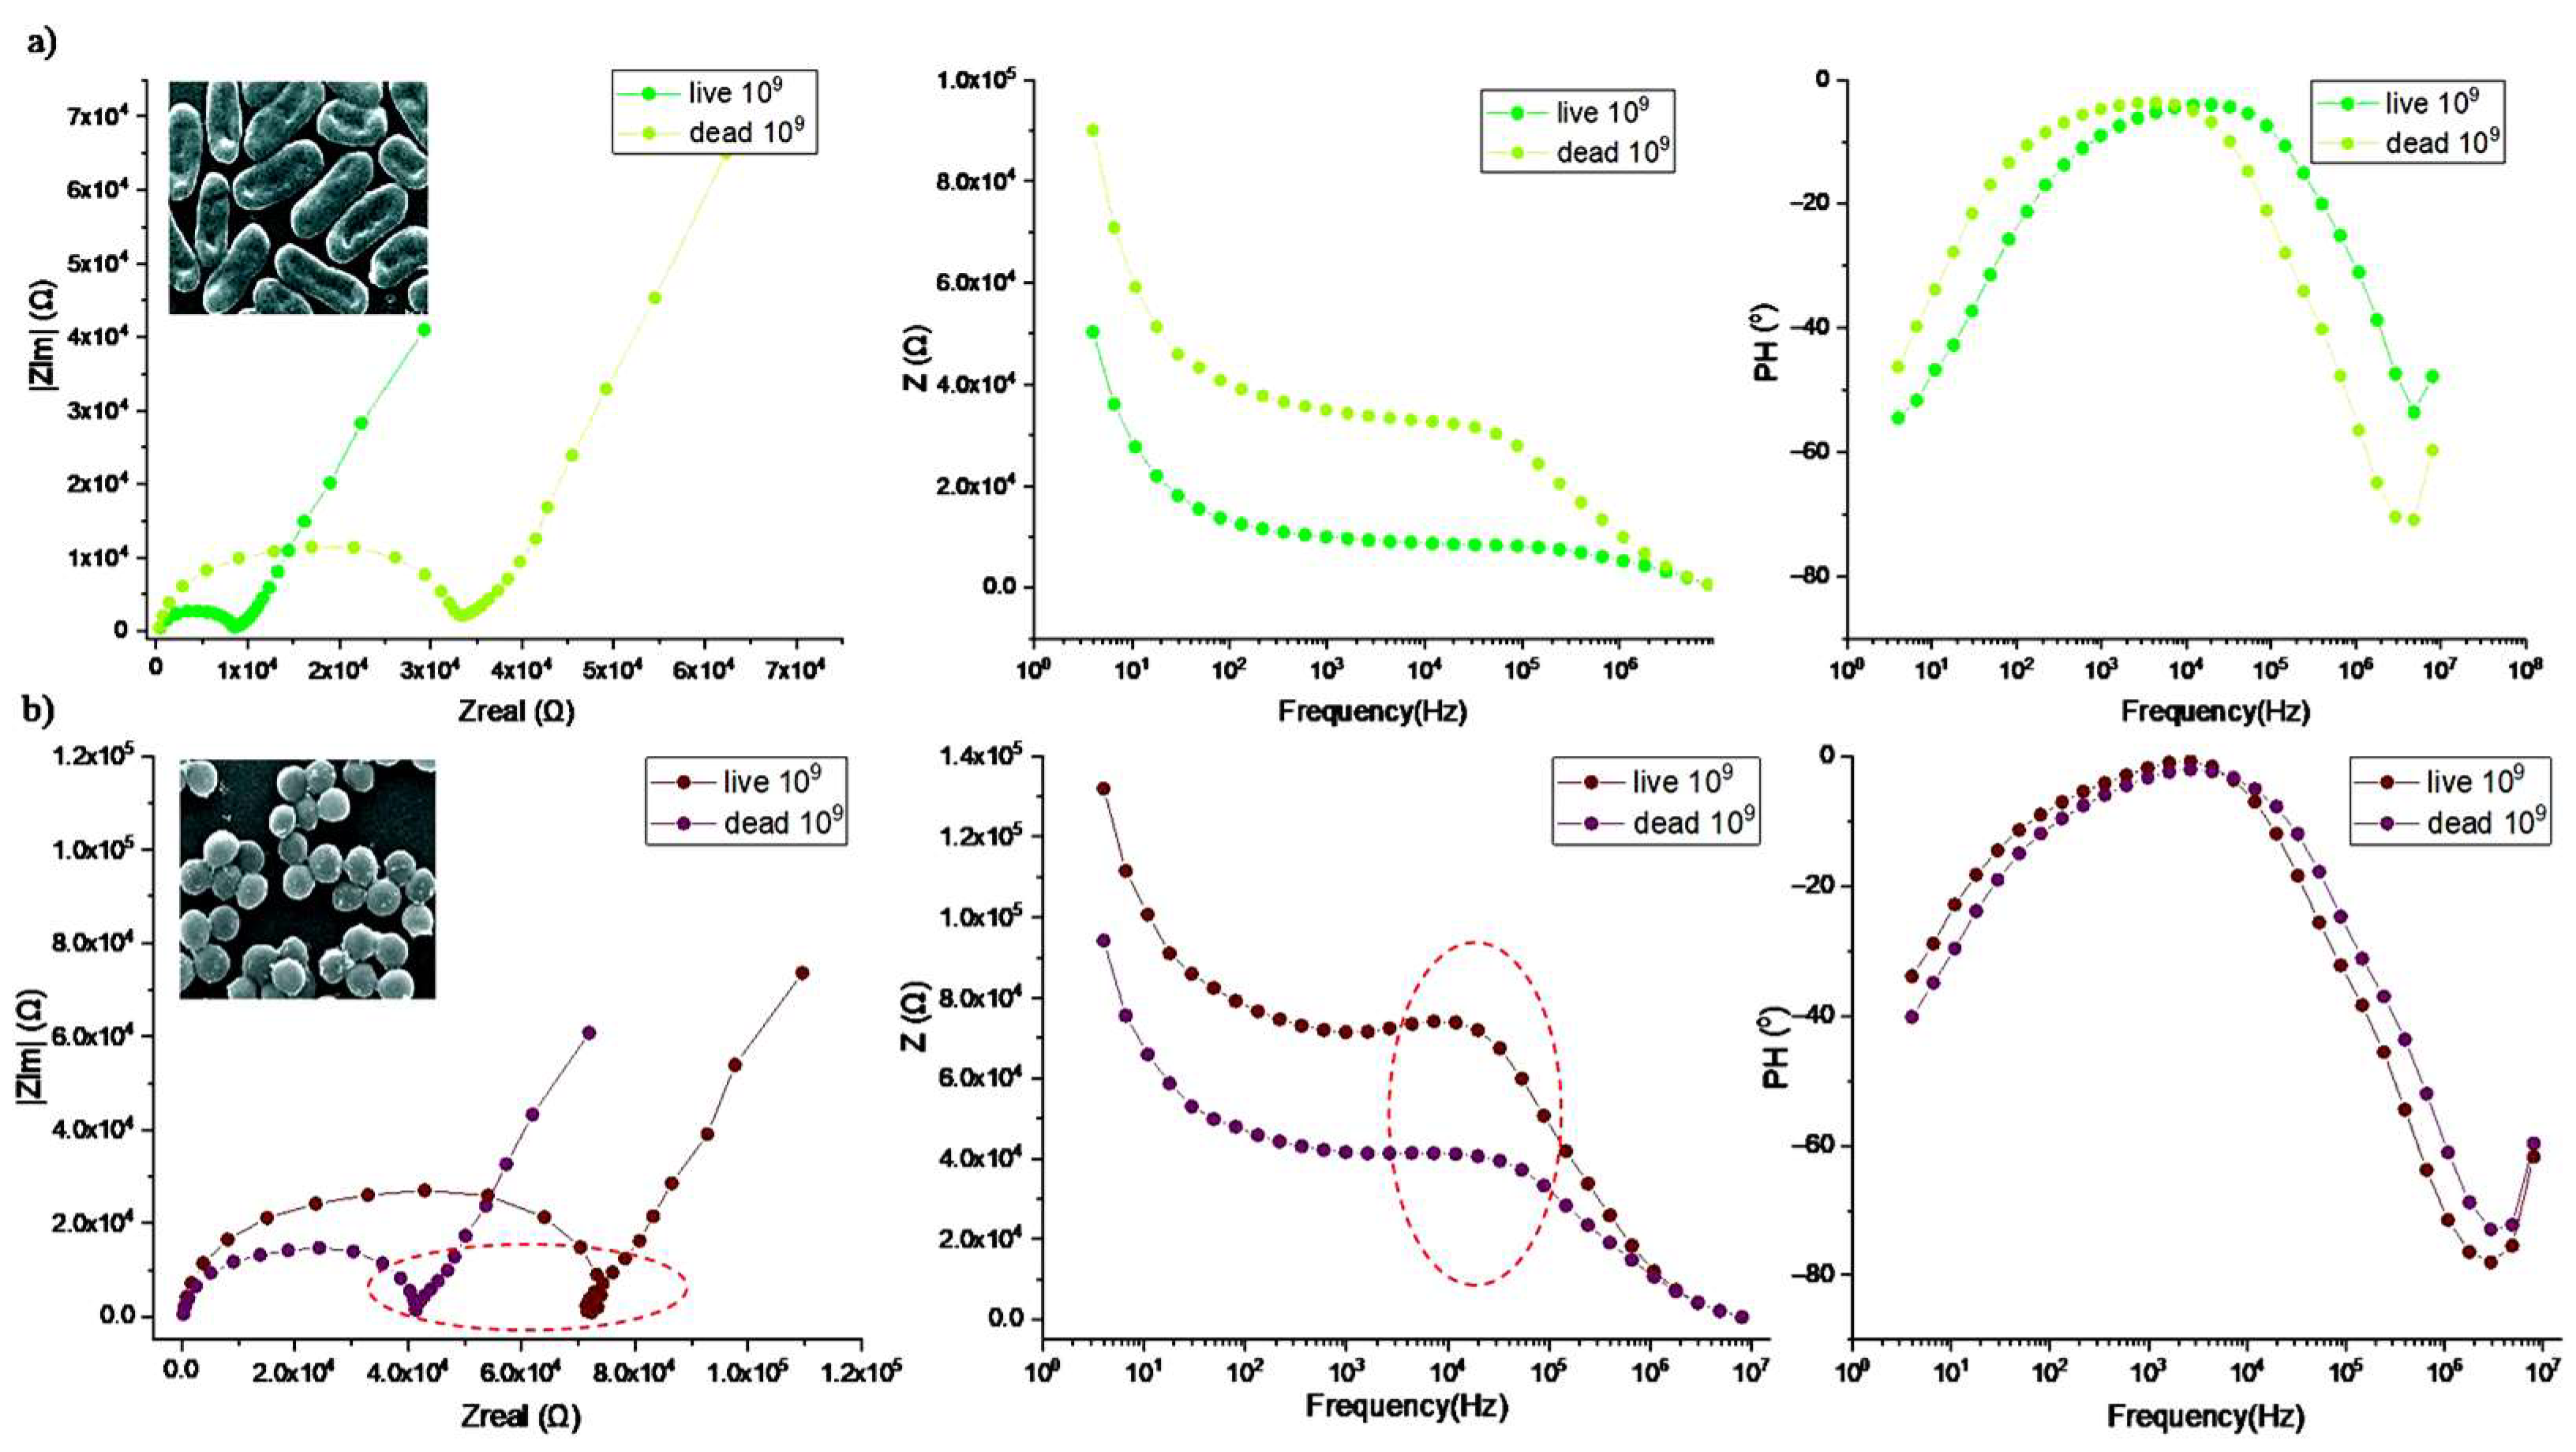
3. Results and Discussion

Detection of Bacteria Cells—Characterization of Impedance Spectrum Data

Impedance spectroscopy was performed in deionized water (DH2O) (non-Faraday EIS) with increasing E. coli concentrations (103, 106, and 109 CFU/mL) in a frequency range between 4 Hz and 8 MHz at a formal voltage of 1 V. The effect of different concentrations of E. coli bacteria cells on DH2O pH was previously measured (Figure 2a). The growth of live and dead cells was monitored using agar plates for 24 h at 37 °C (Figure 2b).
The Nyquist plots (Figure 3) were fitted with an equivalent circuit (the inset of Figure 3), showing that the Rct is a relevant parameter that depends on the bacterial cell concentration. The Nyquist curves were fitted using the EIS analyzer software, and the best results were obtained with the equivalent circuit (inset of Figure 3), where CPE is a constant phase element included in the circuit in parallel and in series with the charge transfer resistance Rct. Rs is the solution resistance. A decrease in the charge transfer resistance Rct was observed with an increase in the concentration of bacterial cells, both live (Figure 3a) and dead (Figure 3b), in deionized water.
The semicircle-shaped portion of the Nyquist plots obtained at high frequencies corresponds to the faradic transfer of electrons on the electrodes, while the spectrum obtained at low frequencies provides information on the diffusion process of transferring bacterial waste products in solution to the electrode surface. For dead E. coli bacteria, characteristic changes were observed at frequencies of 10–100 kHz, which were absent in the impedance spectra for live cells, which can serve as an identifier for distinguishing live cells from dead ones.
The obtained estimated parameters of charge transfer resistance, series resistance, and for series and parallel CPE are shown in Table 1.
For dead cells, a decrease in the CPE values by an order of magnitude is observed (Table 1). Moreover, the value of CPE1 decreases by an order of magnitude, which is associated with a change in the capacitive properties of the membranes of dead cells. CPE2, responsible for the change in mass transfer in solution, increases by an order of magnitude, indicating an increase in ion diffusion in solution due to changes in osmotic pressure inside and outside the dead cells. There is a significant decrease in resistance for suspensions with dead E. coli cells. For comparison, the impedance spectra for live and dead cells with a concentration of 103 and 106 CFU/mL are shown below in one plot (Figure 4a).
Impedance measurements were also performed for live E. coli 108 CFU/mL cells in DH2O on the 1st, 4th, and 8th day after suspension preparation. There was a tendency to decrease the charge transfer resistance with increasing storage time of the suspension, which is associated with an increase in bacteria waste products. For comparison, the impedance spectrum for pure DH2O is shown (Figure 4b–black curve). It is obvious that the increase in the electrical conductivity of the suspension is due to the presence of bacterial cells.
To compare the impedance spectra of E. coli and S. aureus in DH2O, suspensions with a concentration of 109 CFU/mL were chosen. The Nyquist and Bode curves are shown in Figure 5a,b.
The obtained estimated parameters of the charge transfer resistance Rct and series resistance Rs, as well as the values of the CPEs included in parallel and in series with the charge transfer resistance Rct, are given below in Table 2.
Opposite dependencies of the change in charge transfer resistance and the obtained values of the total impedance for live and dead cells for the two types of bacteria are observed. This difference can be related to the structural features of these types of bacteria and their size. S. aureus are spherical cells that tend to form larger agglomerates, whereas E. coli are rod-shaped cells and preferentially exist as individual cells. For S. aureus, increased CPE1 (the capacity of the double layer Cdl) is due to the difference in bacterial membrane structure.

4. Conclusions

The proposed method of selective detection of bacterial cells can be used to differentiate between two types of bacteria, specifically E. coli and S. aureus, as well asqualitatively characterize their physiological state, i.e., dead or alive, and to estimate their concentration in samples with an unknown number of bacteria per unit volume.

Author Contributions

Conceptualization, O.G. and V.S.; methodology, O.G. and V.S.; software, O.G.; validation, B.R., V.S. and D.R.; formal analysis, O.G, V.S., D.R. and M.B.; investigation, O.G., D.R. and M.B.; writing—original draft preparation, O.G.; writing—review and editing, B.R.; visualization, O.G. and V.S.; supervision, B.R.; project administration, B.R.; funding acquisition, B.R. All authors have read and agreed to the published version of the manuscript.

Funding

This research was financially supported by the TACR project TM03000033 (TACOM) and by the MEYS project CZ.02.1.01/0.0/0.0/16_019/0000778 (CAAS).

Institutional Review Board Statement

Not applicable.

Informed Consent Statement

Not applicable.

Data Availability Statement

All data is available upon request to the corresponding author.

Conflicts of Interest

The authors have no financial/commercial conflicts of interest.

References

  1. Mallén-Alberdi, M.; Mas, J.; Fernández-Sánchez, C.; Baldi, A. Impedance spectral fingerprint of E. coli cells on interdigitated electrodes: A new approach for label free and selective detection. Sens. Bio-Sens. Res. 2016, 7, 100–106. [Google Scholar] [CrossRef]
  2. Wang, R.; Lum, J.; Callaway, Z.; Lin, J.; Bottje, W.; Li, Y. A Label-Free Impedance Immunosensor Using Screen-Printed Interdigitated Electrodes and Magnetic Nanobeads for the Detection of E. coli O157:H7. Biosensors 2015, 5, 791–803. [Google Scholar] [CrossRef] [PubMed]
  3. Yang, H.; Zhou, H.; Hao, H.; Gong, Q.; Nie, K. Detection of Escherichia coli with a label-free impedimetric biosensor based on lectin functionalized mixed self-assembled monolayer. Sens. Actuators B Chem. 2016, 229, 297–304. [Google Scholar] [CrossRef]
  4. Ahmed, A.; Rushworth, J.V.; Hirst, N.A.; Millner, P.A. Biosensors for Whole-Cell Bacterial Detection. Clin. Microbiol. Rev. 2014, 27, 631–646. [Google Scholar] [CrossRef] [PubMed]
  5. Santos, M.B.D.; Sporer, C.; Sanvicens, N.; Pascual, N.; Errachid, A.; Martinez, E.; Marco, M.-P.; Teixeira, V.; Samiter, J. Detection of pathogenic Bacteria by Electrochemical Impedance Spectroscopy: Influence of the immobilization strategies on the sensor performance. Procedia Chem. 2009, 1, 1291–1294. [Google Scholar] [CrossRef]
  6. Brosel-Oliu, S.; Abramova, N.; Uria, N.; Bratov, A. Impedimetric transducers based on interdigitated electrode arrays for bacterial detection—A review. Anal. Chim. Acta 2019, 1088, 1–19. [Google Scholar] [CrossRef] [PubMed]
  7. Swami, P.; Sharma, A.; Anand, S.; Gupta, S. DEPIS: A combined dielectrophoresis and impedance spectroscopy platform for rapid cell viability and antimicrobial susceptibility analysis. Biosens. Bioelectron. 2021, 182, 113190. [Google Scholar] [CrossRef] [PubMed]
  8. Jira, J.; Rezek, B.; Kriha, V.; Artemenko, A.; Matolínová, I.; Skakalova, V.; Stenclova, P.; Kromka, A. Inhibition of E. coli Growth by Nanodiamond and Graphene Oxide Enhanced by Luria-Bertani Medium. Nanomaterials 2018, 8, 140. [Google Scholar] [CrossRef] [PubMed]
  9. Kivirand, K.; Min, M.; Rinken, T. Challenges and Applications of Impedance-Based Biosensors in Water Analysis. In Biosensors for Environmental Monitoring; Rinken, T., Kivirand, K., Eds.; IntechOpen: London, UK, 2019. [Google Scholar] [CrossRef]
  10. Lanzoni, M.G.M. Data Transformation Algorithm for Reliable Bacterial Concentration Detection Using the Impedance Method. J. Electr. Eng. Electron. Technol. 2014, 3, 1–5. [Google Scholar] [CrossRef]
  11. Cimafonte, M.; Fulgione, A.; Gaglione, R.; Papaianni, M.; Capparelli, R.; Arciello, A.; Censi, S.B.; Borriello, G.; Velotta, R.; Della Ventura, B. Screen Printed Based Impedimetric Immunosensor for Rapid Detection of Escherichia coli in Drinking Water. Sensors 2020, 20, 274. [Google Scholar] [CrossRef] [PubMed]
  12. Kundu, A.; Ausaf, T.; Rajasekaran, P.; Rajaraman, S. Multimodal Microfluidic Biosensor with Interdigitated Electrodes (IDE) and Microelectrode Array (MEA) for Bacterial Detection and Identification. In Proceedings of the 2019 20th International Conference on Solid-State Sensors, Actuators and Microsystems & Eurosensors XXXIII (TRANSDUCERS & EUROSENSORS XXXIII), Berlin, Germany, 23–27 June 2019; pp. 1199–1202. [Google Scholar] [CrossRef]
  13. Singh, V.; Rawal, V.; Lakhanpal, S.; Jain, P.; Dahiya, S.; Tripathi, C.C. Immobilized bacteriophage used for specific detection of E. coli using electrochemical impedance sensing. Int. J. Pharm. Sci. Res. 2015, 6, 3913–3919. [Google Scholar]
  14. Gehring, A.G.; Albin, D.M.; Bhunia, A.K.; Reed, S.A.; Tu, S.-I.; Uknalis, J. Antibody Microarray Detection of Escherichiacoli O157:H7: Quantification, Assay Limitations, and Capture Efficiency. Anal. Chem. 2006, 78, 6601–6607. [Google Scholar] [CrossRef] [PubMed]
  15. Al-Jumaili, A.; Zafar, M.A.; Bazaka, K.; Weerasinghe, J.; Jacob, M.V. Bactericidal vertically aligned graphene networks derived from renewable precursor. Carbon Trends 2022, 7, 100157. [Google Scholar] [CrossRef]
Figure 1. Schematic image of bacteria detection by EIS on IDE sensor: (a) preparation of different concentrations of bacteria; (b) IM 3536 LCR and IDE sensor (overall view and zoomed image of the IDE measurement part).
Engproc 58 00079 g001
Figure 2. E. coli in DH2O: (a) pH of E. coli for different CFU/mL; (b) recultivated E. coli colonies (108 CFU/mL) (live (H/D) and dead (Hx/Dx) with HPLC (H) and DH2O (D) on LB agar plate after incubation).
Engproc 58 00079 g002
Figure 3. Impedance spectra (Nyquist and Bode plots) of E. coli (103, 106, and 109 CFU/mL): (a) live and (b) dead bacteria.
Engproc 58 00079 g003
Figure 4. Comparison of impedance spectra of E. coli (Nyquist and Bode plots): (a) E. coli live and dead; (b) E. coli 108 CFU/mL (during 1st, 4th, and 8th day) and DH2O.
Engproc 58 00079 g004
Figure 5. Nyquist and Bode plots of impedance spectra live/dead: (a) E. coli; (b) S. aureus.
Engproc 58 00079 g005
Table 1. Evaluated parameters for E. coli EIS (live and dead cells).
CFU/mLLive
Rs, Ω
(×10−14)
Rct, kΩCPE1
(×10−10)
n1CPE2
(×10−7)
n2
1039.311665.55 0.745.860.69
1069.0180.537.040.747.590.71
1098.7941.088.860.739.560.72
CFU/mLDead
Rs, Ω
(×10−14)
Rct, kΩCPE1
(×10−11)
n1CPE2
(×10−6)
n2
1038.6970.241.370.991.880,60
1068.6450.524.050.931.850.61
1097.2622.671.331.004.080.50
Table 2. Evaluated parameters for live and dead bacterial cells.
109 CFU/mLRs, Ω (×10−14)Rct, kΩCPE1n1CPE2 (×10−6)n2
E. coli
Live1.609.218.86 × 10−090.702.260.70
Dead1.6232.705.39 × 10−100.771.350.72
S. aureus
Live9.5973.461.36 × 10−100.851.230.70
Dead9.5858.371.73 × 10−100.831.400.67
Disclaimer/Publisher’s Note: The statements, opinions and data contained in all publications are solely those of the individual author(s) and contributor(s) and not of MDPI and/or the editor(s). MDPI and/or the editor(s) disclaim responsibility for any injury to people or property resulting from any ideas, methods, instructions or products referred to in the content.

