
Current Measurement and Fault Detection Based on the Non-Invasive Smart Internet of Things Technique †


Abstract
1. Introduction
2. Related Works
- Whole house meters;
- Energy harvesting and non-harvesting;
- Plug-load meters;
- Non-contact meters.
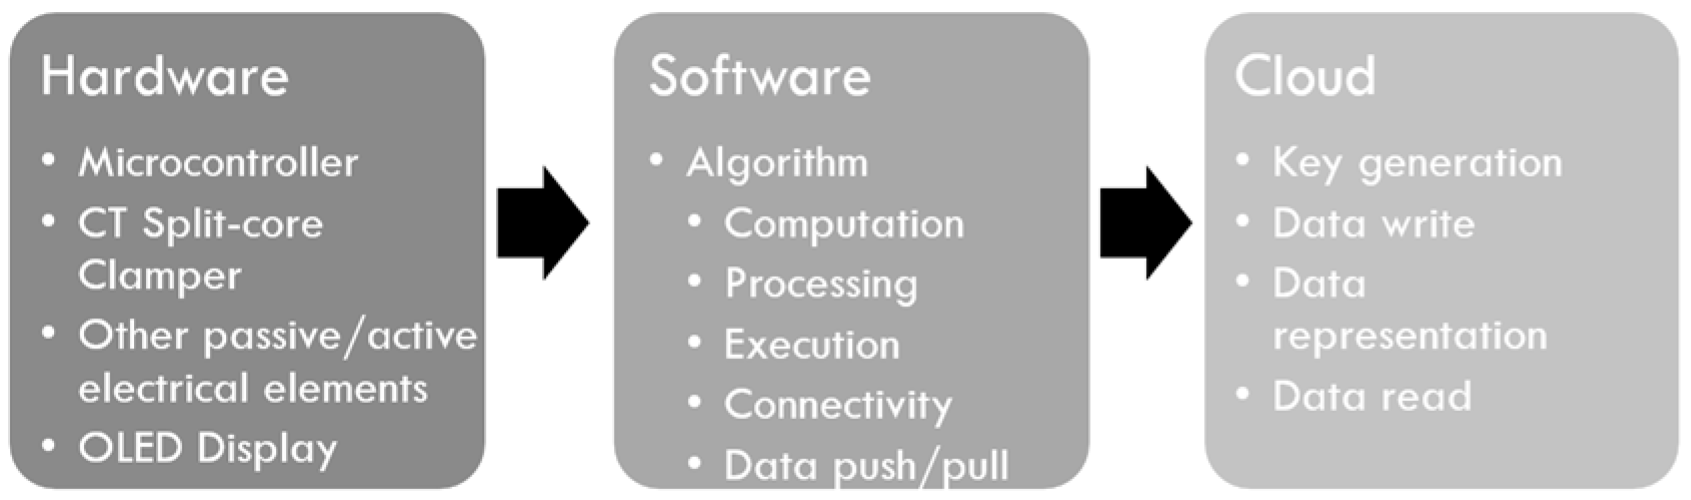
3. System Overview
4. Design
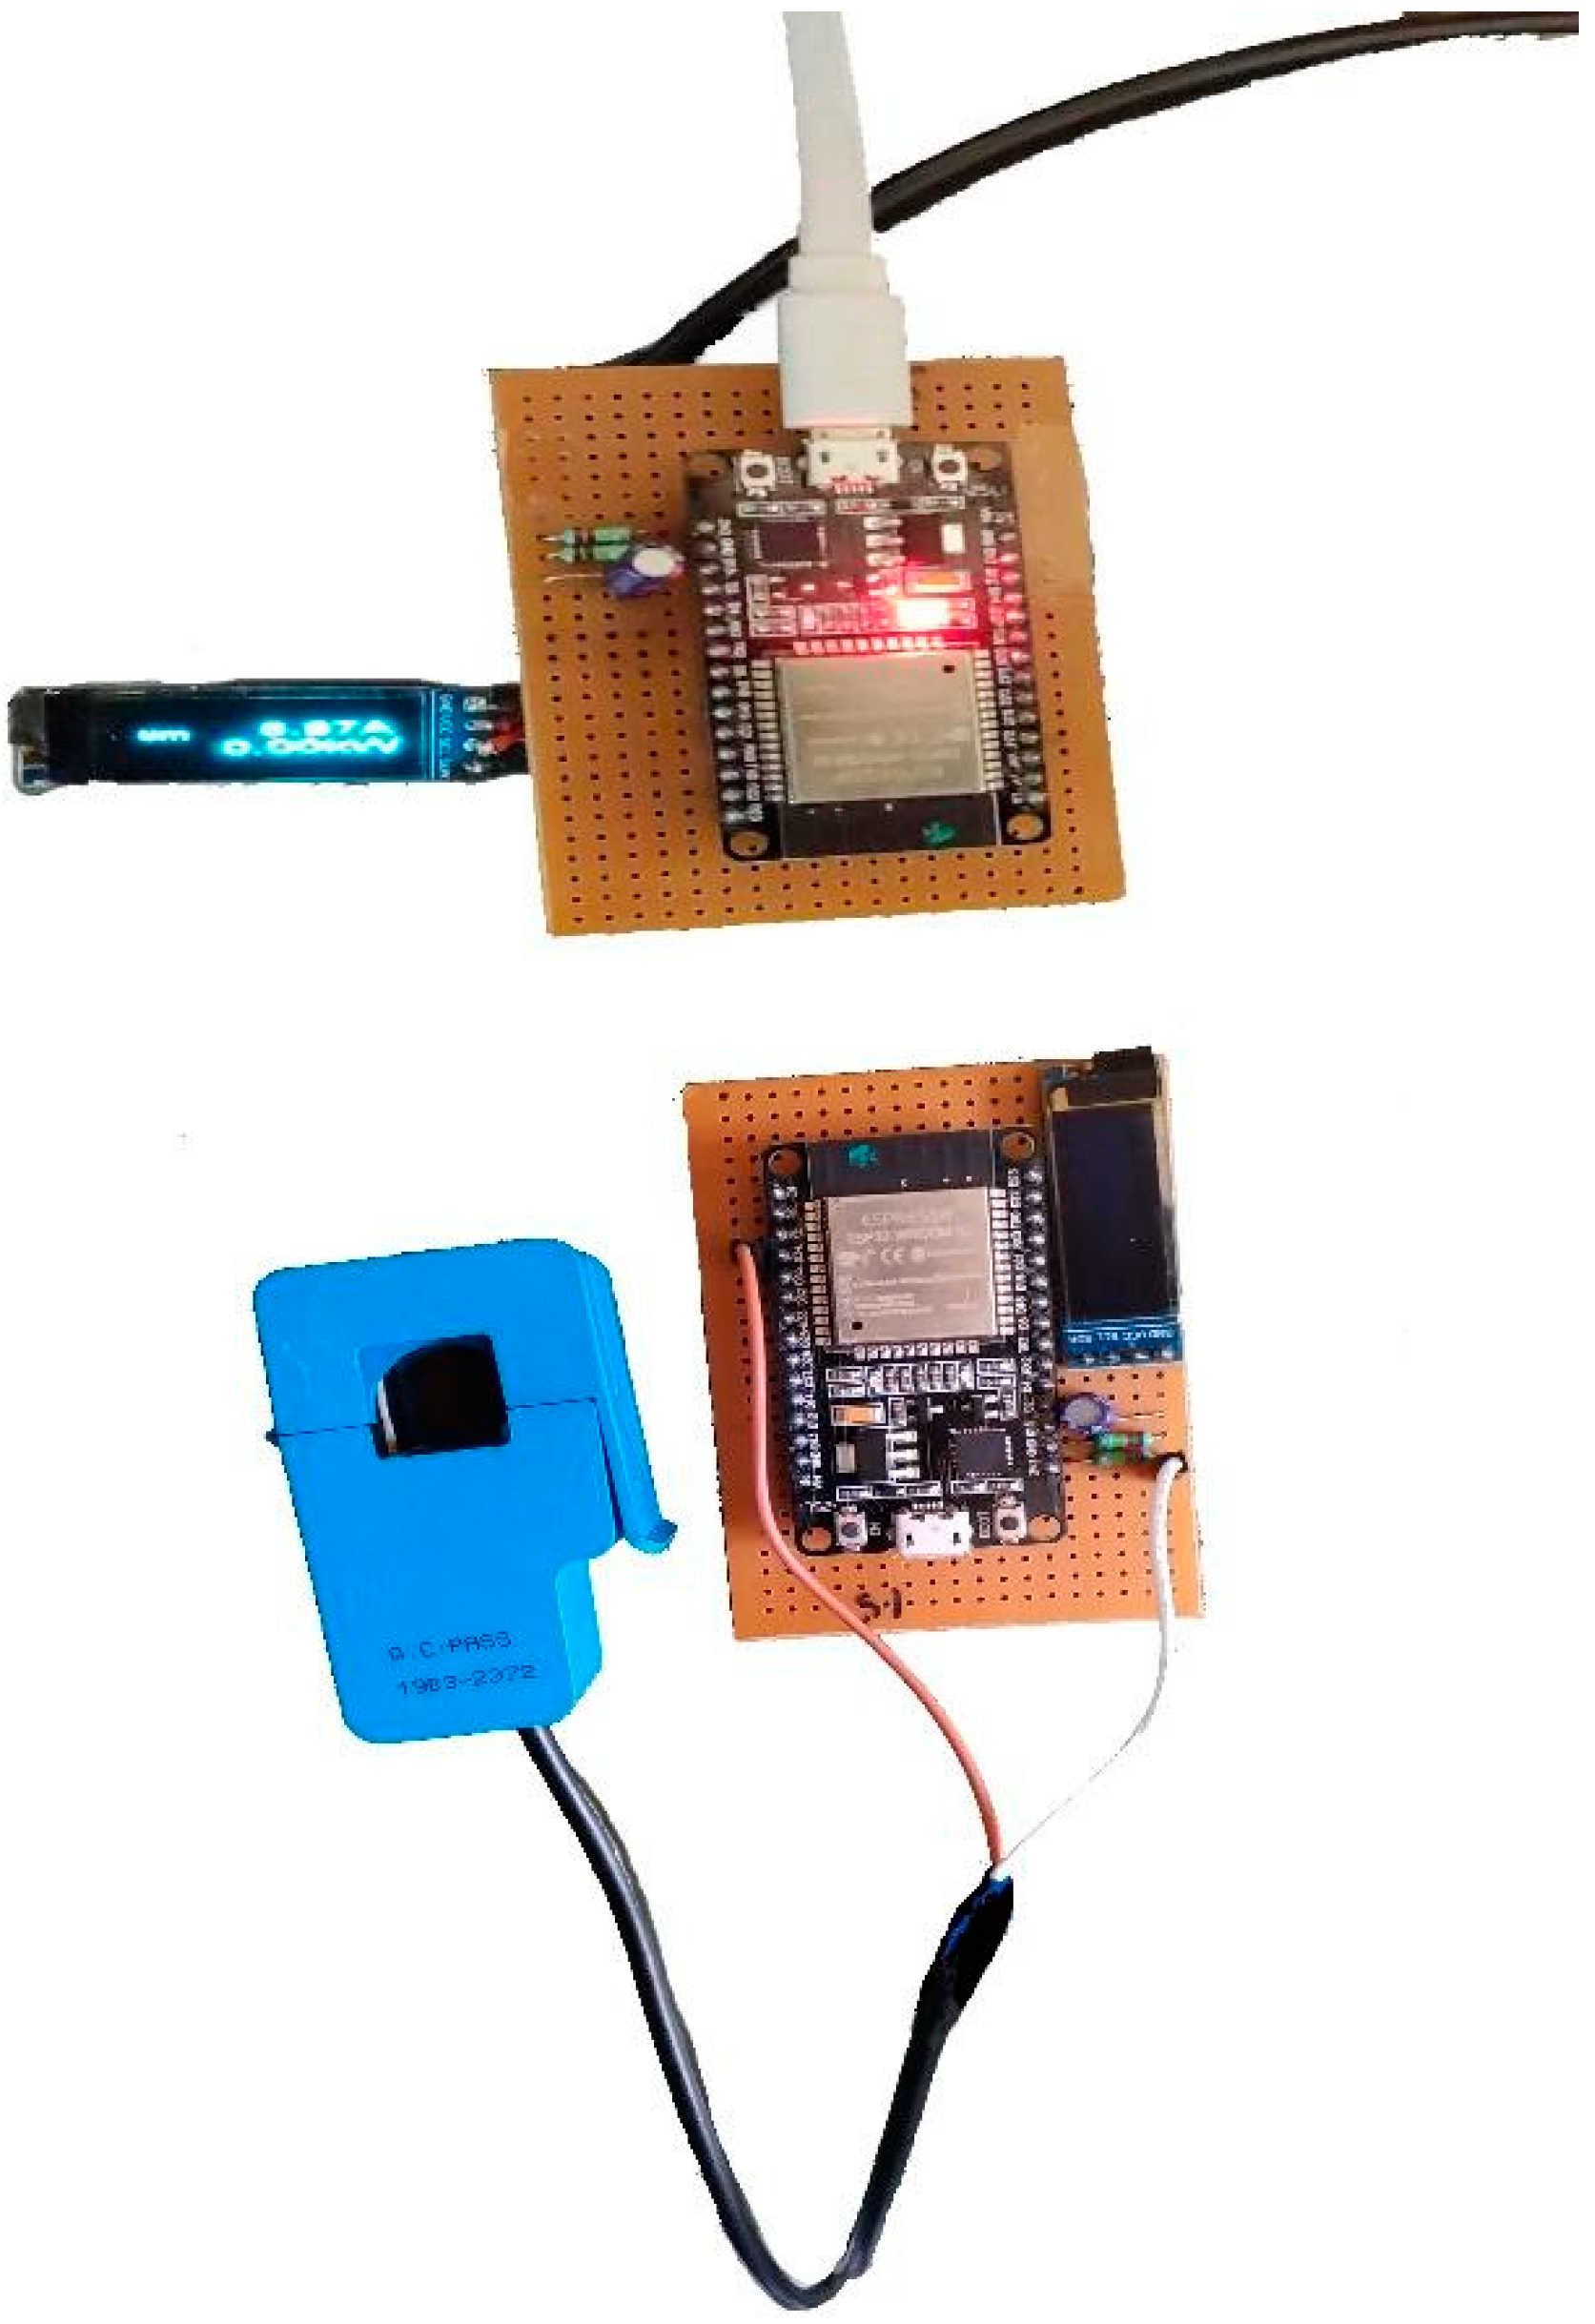
5. Implementation and Results
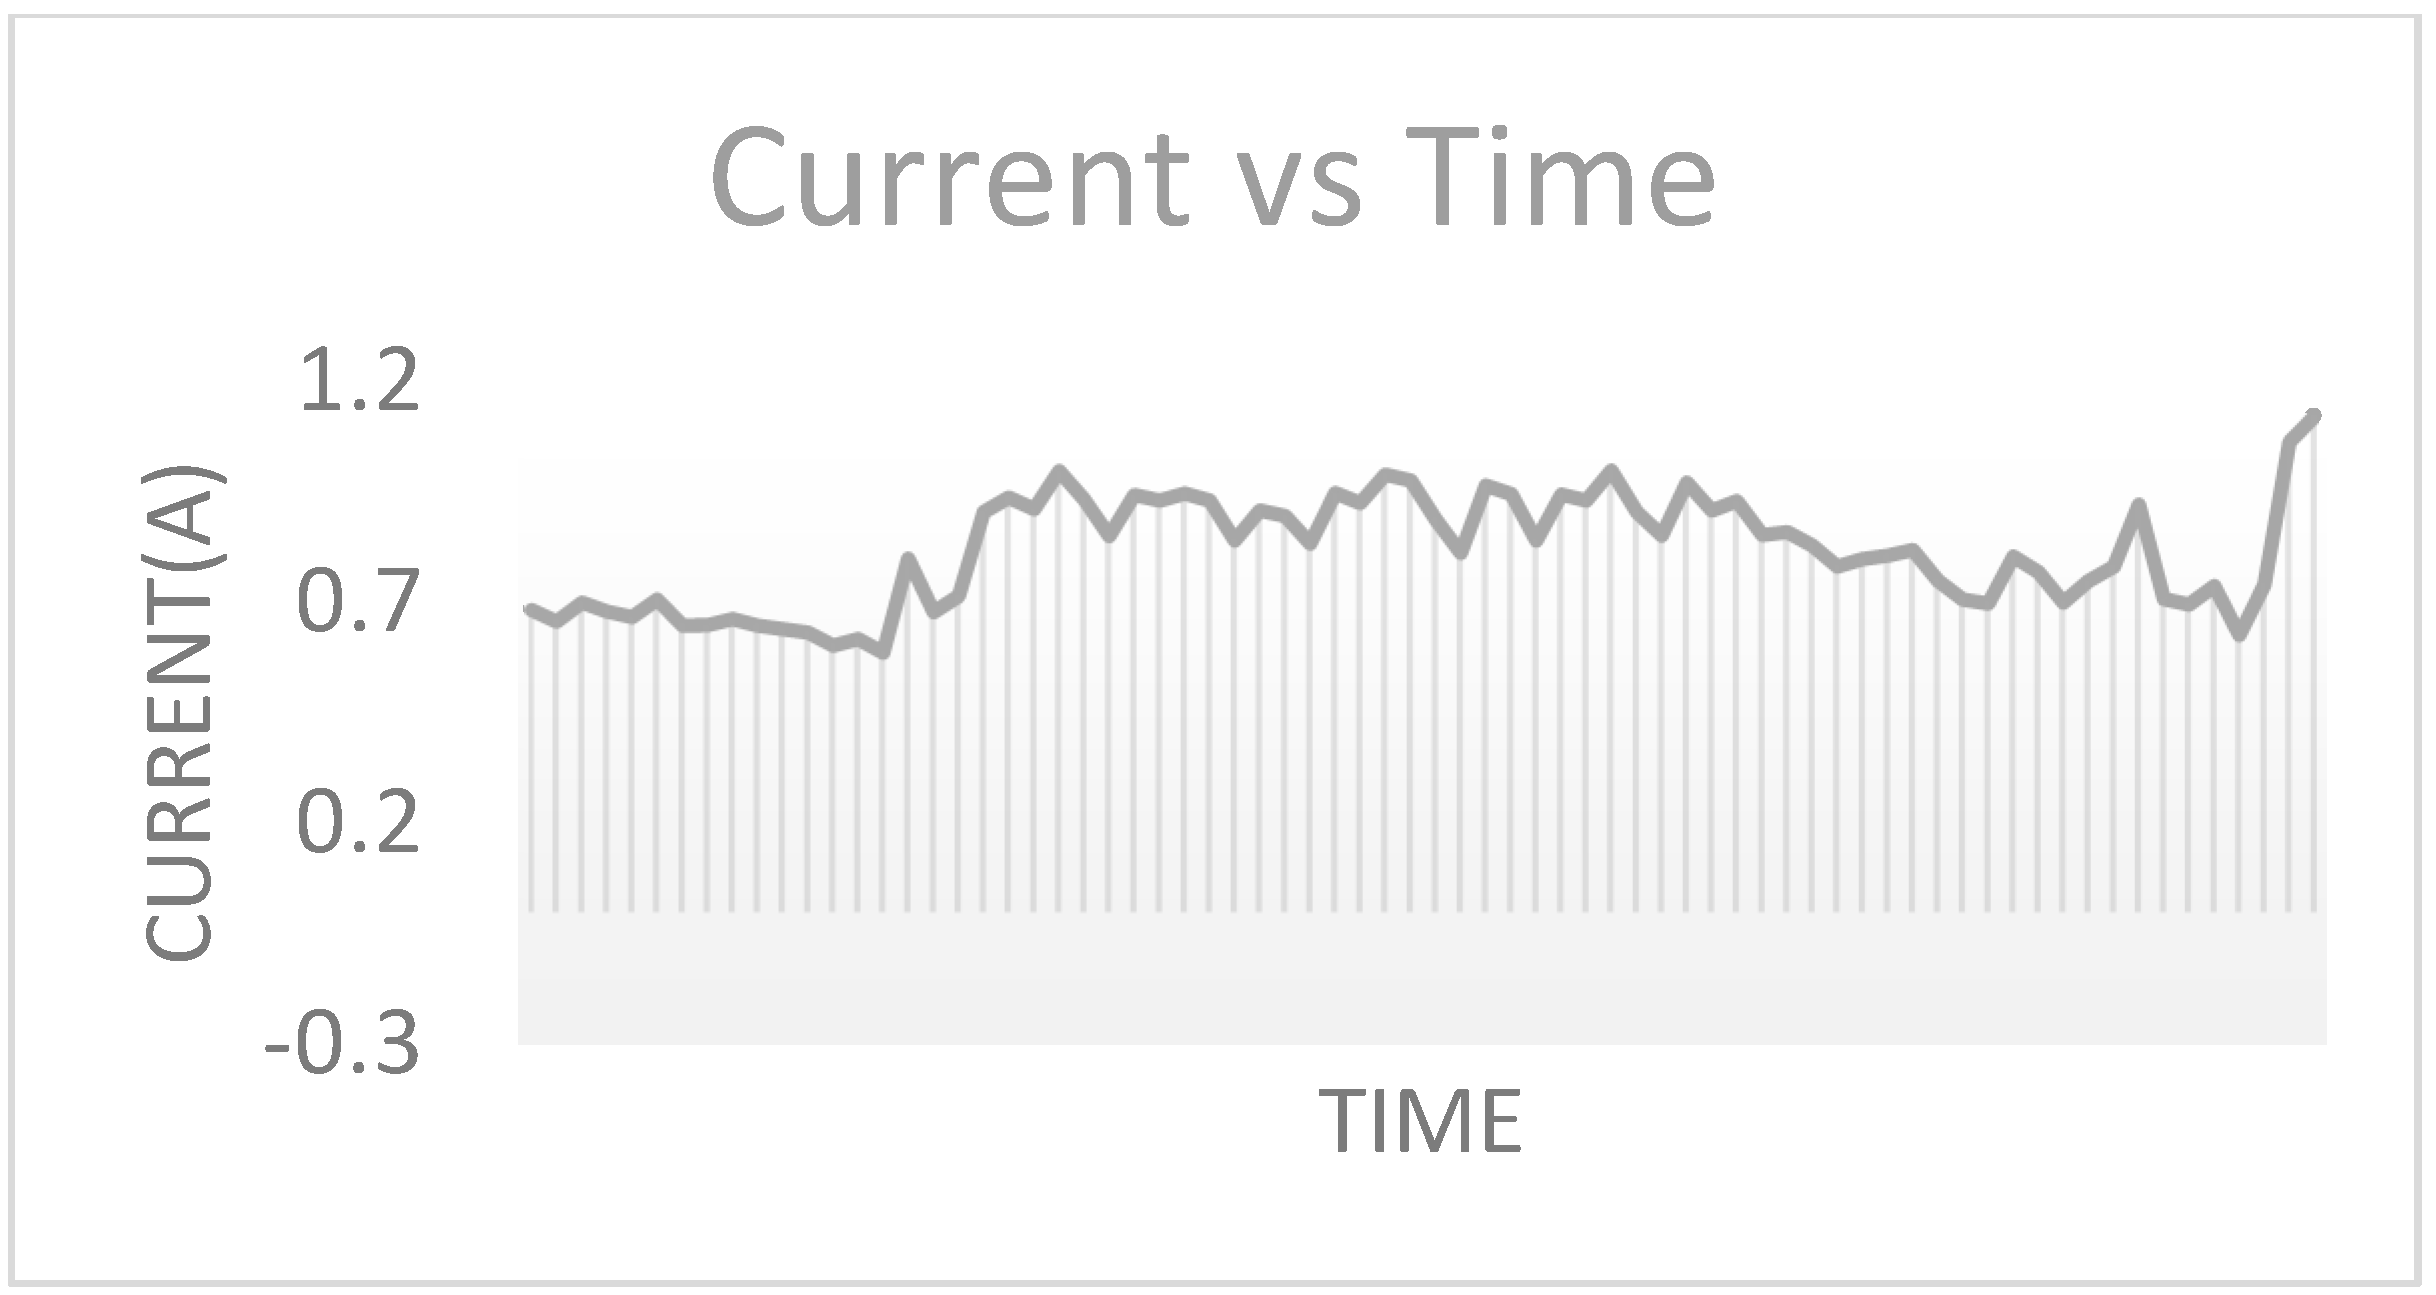
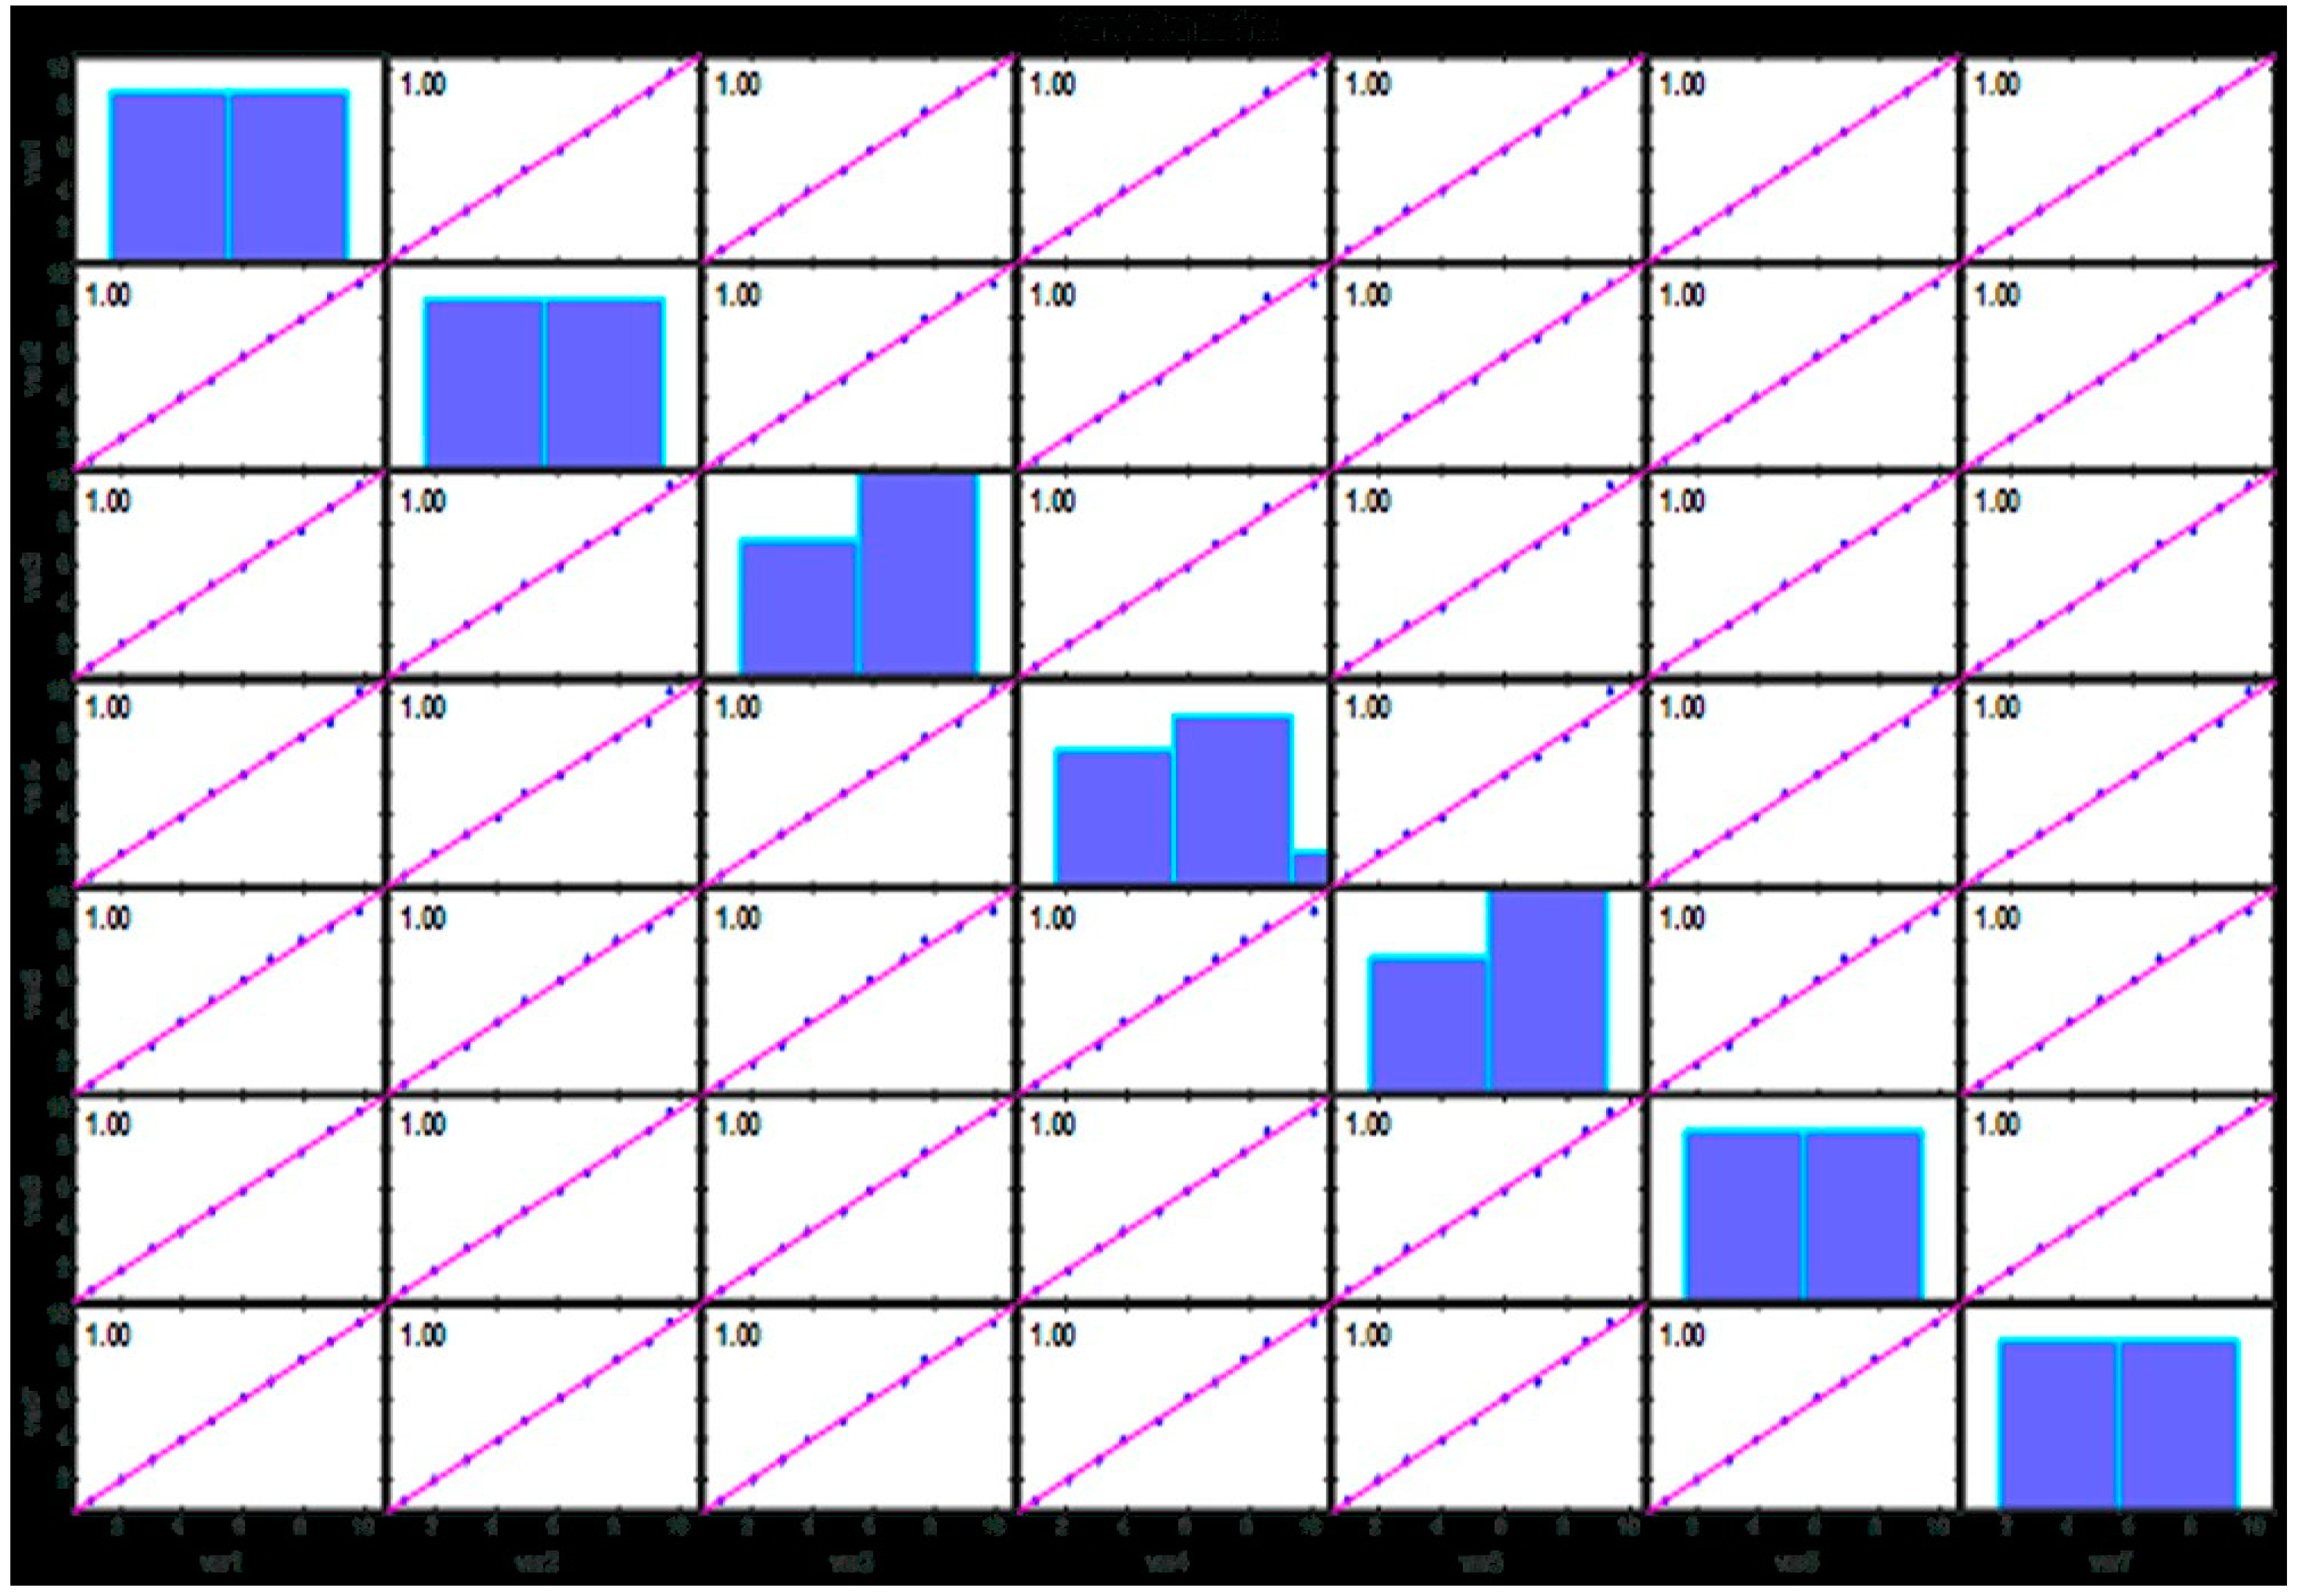
6. Algorithm and Fault Detection
7. Conclusions
8. Future Work
Author Contributions
Funding
Institutional Review Board Statement
Informed Consent Statement
Data Availability Statement
Conflicts of Interest
References
- Hoddie, P.; Prader, L. IoT Development for ESP32 and ESP8266 with JavaScript: A Practical Guide to XS and the Moddable SDK; Apress: Berkeley, CA, USA, 2020. [Google Scholar]
- Viciana, E.; Arrabal-Campos, F.M.; Alcayde, A.; Baños, R.; Montoya, F.G. All-in-one three-phase smart meter and power quality analyzer with extended IoT capabilities. Measurement 2023, 206, 112309. [Google Scholar] [CrossRef]
- Sen, V.; Dimothe, V. Perception towards time of use (TOU) electricity pricing amongst residential consumers in Maharashtra. In Proceedings of the AIP Conference Proceedings, Provo, UT, USA, 16–21 July 2017; AIP Publishing LLC: Melville, NY, USA, 2023; Volume 2523, p. 030009. [Google Scholar]
- Kirmani, S.; Mazid, A.; Khan, I.A.; Abid, M. A Survey on IoT-Enabled Smart Grids: Technologies, Architectures, Applications, and Challenges. Sustainability 2023, 15, 717. [Google Scholar]
- Belsare, K.; Rodriguez, A.C.; Sánchez, P.G.; Hierro, J.; Kołcon, T.; Lange, R.; Lütkebohle, I.; Malki, A.; Losa, J.M.; Melendez, F.; et al. Micro-ROS. In Robot Operating System (ROS) the Complete Reference; Springer International Publishing: Cham, Switzerland, 2023; Volume 7, pp. 3–55. [Google Scholar]
- Campbell, B.; Dutta, P. Gemini: A non-invasive, energy-harvesting true power meter. In Proceedings of the 2014 IEEE Real-Time Systems Symposium, Rome, Italy, 2–5 December 2014; IEEE: Piscataway, NJ, USA, 2014; pp. 324–333. [Google Scholar]
- Haghani, S.; Rahimi, M.A. The design and Implementation of a Smart Switch Outlet Adapter. In Proceedings of the 2018 ASEE Mid-Atlantic Section Spring Conference, Washington, DC, USA, 6–7 April 2018. [Google Scholar]
- Yan, W.; Ma, C.; Cai, X.; Sun, Y.; Zhang, G.; Song, W. Self-powered and wireless physiological monitoring system with integrated power supply and sensors. Nano Energy 2023, 108, 108203. [Google Scholar]
- Australian Energy Statistics. Australian Energy Update. In Department of the Environment and Energy; Commonwealth of Australia Canberra: Canberra, Australia, 2019; p. 36. [Google Scholar]
- DeBruin, S.; Ghena, B.; Kuo, Y.-S.; Dutta, P. Powerblade: A low-profile, true-power, plug-through energy meter. In Proceedings of the 13th ACM Conference on Embedded Networked Sensor Systems, Seoul, Republic of Korea, 1–4 November 2015; pp. 17–29. [Google Scholar]
- Stusek, M.; Pokorny, J.; Masek, P.; Hajny, J.; Hosek, J. A non-invasive electricity measurement within the smart grid landscape: Arduino-based visualization platform for IoT. In Proceedings of the 2017 9th International Congress on Ultra Modern Telecommunications and Control Systems and Workshops (ICUMT), Munich, Germany, 6–8 November 2017; IEEE: Piscataway, NJ, USA, 2017; pp. 423–429. [Google Scholar]
- Quindai, R.; Almeida, C.M.P.; Ramos, H.S.; Rodrigues, J.J.P.; Aquino, A.L.L. A non intrusive low cost arduino-based three phase sensor kit for electric power measuring. In Proceedings of the 2017 2nd International Multidisciplinary Conference on Computer and Energy Science (SpliTech), Split, Croatia, 12–14 July 2017; IEEE: Piscataway, NJ, USA, 2017; pp. 1–6. [Google Scholar]
- Xu, Q.R.; Paprotny, I.; Seidel, M.; White, R.M.; Wright, P.K. Stick-on piezoelectromagnetic AC current monitoring of circuit breaker panels. IEEE Sens. J. 2012, 13, 1055–1064. [Google Scholar] [CrossRef]
- Geng, G.; Yang, X.; Gao, Y.; Hammond, W.; Xu, W. Noninvasive current sensor for multicore cables. IEEE Trans. Power Deliv. 2018, 33, 2335–2343. [Google Scholar] [CrossRef]
- Wille, K.F.; Fitzgibbon, K. Non-invasive current measurement pulsed electron system and measurement techniques. In Proceedings of the IEEE AUTOTESTCON, Huntsville, AL, USA, 17 October 2002; IEEE: Piscataway, NJ, USA, 2002; pp. 541–550. [Google Scholar]
- Sinha, A.; Kaur, S. Different Methods of Differentiating Inrush Current from Internal Fault Current in Transformer. Int. J. Comput. Appl. 2016, 975, 8887. [Google Scholar]
- Al-Turjman, F.; Abujubbeh, M. IoT-enabled smart grid via SM: An overview. Future Gener. Comput. Syst. 2019, 96, 579–590. [Google Scholar] [CrossRef]
- Goudarzi, A.; Ghayoor, F.; Waseem, M.; Fahad, S.; Traore, I. A Survey on IoT-Enabled Smart Grids: Emerging, Applications, Challenges, and Outlook. Energies 2022, 15, 6984. [Google Scholar]
- Fadlullah, Z.M.; Pathan, A.-S.K.; Singh, K. Smart grid internet of things. Mob. Netw. Appl. 2018, 23, 879–880. [Google Scholar]
- Minh, Q.N.; Nguyen, V.-H.; Quy, V.K.; Ngoc, L.A.; Chehri, A.; Jeon, G. Edge Computing for IoT-Enabled Smart Grid: The Future of Energy. Energies 2022, 15, 6140. [Google Scholar]
- Kabalci, Y.; Kabalci, E.; Padmanaban, S.; Holm-Nielsen, J.B.; Blaabjerg, F. Internet of things applications as energy internet in smart grids and smart environments. Electronics 2019, 8, 972. [Google Scholar] [CrossRef]


| Actual (A) | Device Reading (A) | |||||
|---|---|---|---|---|---|---|
| 1 | 0.97 | 1 | 1.03 | 1.02 | 0.95 | 0.99 |
| 2 | 1.97 | 2.04 | 2 | 1.98 | 1.99 | 1.98 |
| 3 | 3.02 | 2.99 | 3.06 | 2.95 | 3.04 | 2.96 |
| 3.95 | 4 | 3.89 | 3.92 | 3.94 | 3.9 | 3.94 |
| 4.95 | 4.91 | 4.94 | 5.02 | 4.98 | 4.95 | 4.93 |
| 6 | 5.99 | 5.96 | 5.95 | 6 | 5.94 | 6.04 |
| 6.9 | 6.93 | 6.89 | 6.88 | 6.84 | 6.9 | 6.87 |
| 7.9 | 7.93 | 7.88 | 7.85 | 7.94 | 7.84 | 7.93 |
| 8.85 | 8.9 | 8.86 | 8.84 | 8.81 | 8.89 | 8.83 |
| 9.8 | 9.75 | 9.8 | 9.77 | 9.84 | 9.83 | 9.78 |
Disclaimer/Publisher’s Note: The statements, opinions and data contained in all publications are solely those of the individual author(s) and contributor(s) and not of MDPI and/or the editor(s). MDPI and/or the editor(s) disclaim responsibility for any injury to people or property resulting from any ideas, methods, instructions or products referred to in the content. |
© 2024 by the authors. Licensee MDPI, Basel, Switzerland. This article is an open access article distributed under the terms and conditions of the Creative Commons Attribution (CC BY) license (https://creativecommons.org/licenses/by/4.0/).
Share and Cite
Chanda, A.; Gudipalli, A. Current Measurement and Fault Detection Based on the Non-Invasive Smart Internet of Things Technique. Eng. Proc. 2023, 59, 174. https://doi.org/10.3390/engproc2023059174
Chanda A, Gudipalli A. Current Measurement and Fault Detection Based on the Non-Invasive Smart Internet of Things Technique. Engineering Proceedings. 2023; 59(1):174. https://doi.org/10.3390/engproc2023059174
Chicago/Turabian StyleChanda, Abhrodeep, and Abhishek Gudipalli. 2023. "Current Measurement and Fault Detection Based on the Non-Invasive Smart Internet of Things Technique" Engineering Proceedings 59, no. 1: 174. https://doi.org/10.3390/engproc2023059174
APA StyleChanda, A., & Gudipalli, A. (2023). Current Measurement and Fault Detection Based on the Non-Invasive Smart Internet of Things Technique. Engineering Proceedings, 59(1), 174. https://doi.org/10.3390/engproc2023059174