Proceeding Paper

Intraocular Pressure Monitoring System for Glaucoma Patients Using IoT and Machine Learning †

by
Sivamani Chinnaswamy
1,
Vigneshwari Natarajan
1,
Selvi Samiappan
2 and
Revathy Gurumurthy
3,*
1
Department of Biomedical Engineering, KIT-KalaignarKarunanidhi Institute of Technology, Coimbatore 641402, Tamil Nadu, India
2
Department of Artificial intelligence and Data Science, Builders Engineering College, Tiruppur 638108, Tamil Nadu, India
3
Department of Computer Science, SRC, SASTRA Deemed University, Kumbakonam 613401, Tamil Nadu, India
*
Author to whom correspondence should be addressed.
Presented at the International Conference on Recent Advances in Science and Engineering, Dubai, United Arab Emirates, 4–5 October 2023.
Eng. Proc. 2023, 59(1), 179; https://doi.org/10.3390/engproc2023059179
Published: 18 January 2024
(This article belongs to the Proceedings of Eng. Proc., 2023, RAiSE-2023)

Abstract

:
Glaucoma is a condition characterized by unwarranted aqueous humor in the eye, leading to elevated intraocular pressure that can cause damage to the optic nerve. Current treatments for glaucoma are not highly effective and may have significant side effects. Monitoring intraocular pressure in real-time and with accuracy is crucial, particularly for patients with severe glaucoma. Therefore, the development of wearable devices for continuous and precise intraocular pressure monitoring is a promising approach for diagnosing and treating glaucoma. However, existing intraocular pressure measurement and monitoring technologies face challenges in terms of scope, exactness, power feasting, and astuteness, which limit their suitability for glaucoma patients. To address these needs, this study focuses on the design and fabrication of an implantable, flexible intraocular pressure sensor capable of long-term continuous monitoring. This research investigates the working principle, structural design, fabrication process, measurement and control system, characterization, and performance testing of the intraocular pressure sensor. This research holds significant importance regarding achieving personalized and accurate treatment for glaucoma patients. Predictions are undertaken using Random forest, and results are obtained. Random forest has the highest accuracy when compared with other state-of-the-art models.

1. Introduction

Glaucoma is a severe and unalterable lingering eye ailment that leads to sightlessness due to damage to the optic nerve and forfeiture of visual function, which is caused by elevated intraocular pressure (IOP). Glaucoma is one of the leading causes of blindness worldwide, with over 60 million individuals affected. By 2022, it was estimated that the number of glaucoma patients would reach 85 million, with China having a significant portion of these cases. Early prevention and timely treatment are crucial for patients and society, although a complete cure is currently not possible. The primary factor contributing to optic nerve damage in glaucoma is intraocular pressure, which refers to the pressure within the eyeball and on its inner wall [1,2,3,4,5,6,7,8,9,10,11]. The balance of intraocular fluid circulation significantly impacts the fluctuation of intraocular pressure. Therefore, real-time and accurate data on intraocular pressure are essential in determining personalized treatment strategies such as dosage and timing of medication for glaucoma patients. The continuous and precise monitoring of intraocular pressure holds great significance for the diagnosis and treatment of glaucoma, particularly in severe cases. The measurement of intraocular pressure serves as an important indicator in the diagnosis and treatment of various eye conditions.
In today’s modern world, eye conditions are diagnosed using a variety of methods in hospitals. However, it can be difficult for patients to make regular visits to healthcare facilities due to their busy schedules. To overcome this challenge and improve patient outcomes, there is a need to develop a system that enables continuous monitoring. This is especially important for individuals with conditions such as glaucoma [12,13,14]. The system should provide real-time monitoring of intraocular pressure, which can be conveniently accessed through a web application or an Android application. This allows for the continuous tracking of intraocular pressure at specific intervals or whenever monitoring is necessary.

2. Literature Survey

This is a comprehensive literature survey of relevant papers that discuss previously used techniques in the field. The significance and limitations of these techniques are examined, shedding light on their effectiveness and areas for improvement. Additionally, this chapter includes a review of various papers that serve as references for the proposed techniques, highlighting their advantages. The ultimate goal is to design an efficient intraocular pressure monitoring system that can be utilized both in hospitals and at home.
Xiangwen Yuan and Jiabin Zhang presented a novel wearable mobile medicine device that utilizes the micro nano contact structure method to measure and monitor intraocular pressure in individuals with glaucoma. This device offers real-time monitoring capabilities, allowing for continuous and immediate assessment of intraocular pressure levels. This technology provides valuable insights that can greatly contribute to the effective management and treatment of glaucoma [14,15,16,17,18,19,20,21].

2.1. Existing Systems

Various methods have been developed to measure intraocular pressure (IOP) in patients.
Cavity Pressure-Sensitive Structure Method: This method utilizes the cavity pressure within the eye to estimate IOP. It involves measuring the pressure within the anterior chamber or vitreous cavity, which can provide an indirect indication of IOP levels. This method is often employed using non-invasive devices that rely on tonometry or pneumotonometry techniques.
Packaging Method of Implantable Intraocular Pressure Sensors: In this method, a permanent lens with an embedded pressure sensor is surgically implanted into the eye. The sensor is designed to directly quantify IOP and transmit the data to an external monitoring device. This approach allows for continuous and accurate monitoring of IOP over extended periods.
Micro Nano Contact Structure Method: This method involves the use of a wearable contact lens that incorporates micro or nanostructures capable of detecting changes in IOP. These structures act as sensors, detecting the subtle deformations of the eyeball caused by variations in IOP. The contact lens can transmit the measured data wirelessly to an external monitoring device, enabling real-time and continuous monitoring of IOP.
Each of these methods offers advantages and may be suitable for different clinical scenarios. The choice of method depends on factors such as the patient’s condition, the need for invasiveness, and the desired duration of monitoring.

2.2. Problems in Existing Systems

Based on the current investigation of intraocular pressure monitors at home and abroad, significant progress has been made in the development of implantable intraocular pressure sensors and flexible pressure sensors based on the micro nano contact-sensitivity mechanism.
Regarding the micro nano contact structure-based sensors, they offer advantages such as high sensitivity and fast responses. However, their application in biomedical and implantable settings still has certain limitations. These limitations need to be addressed to expand their potential use in these fields, particularly in terms of biocompatibility, long-term stability, and integration with implantable devices.
Furthermore, the development of a multifunctional and rheostat scheme specifically designed to find analog intraocular pressure-related gestures has not yet been perfected. Research in this area is ongoing to develop comprehensive systems that can accurately and efficiently detect and analyze intraocular pressure signals. Improving the performance, functionality, and integration of such systems will contribute to more effective monitoring and management of glaucoma and other related conditions. The amount of intraocular pressure is a grave parameter in the analysis and treatment of various eye conditions, particularly in the case of glaucoma. However, different measurement principles and methods can lead to variations in the measured values of intraocular pressure. Currently, several instruments are used for measuring intraocular pressure in clinical settings. These include flattening-type, indentation-type, and non-contact-type intraocular pressure meters. One commonly used instrument is the Goldmann applanation tonometer (GAT), which can achieve a measurement accuracy of 0.5 mmHg. However, the measurement results can be significantly predisposed by features such as changes in central corneal breadth and corneal curvature. Moreover, GAT can only provide measurements from an explicit period through the day. In summary, while different methods exist for measuring intraocular pressure, each has its advantages and limitations. It is essential to consider these factors when selecting the appropriate instrument for accurate and reliable intraocular pressure measurement, taking into account the specific needs and conditions of the patient.

3. Methods/Methodology

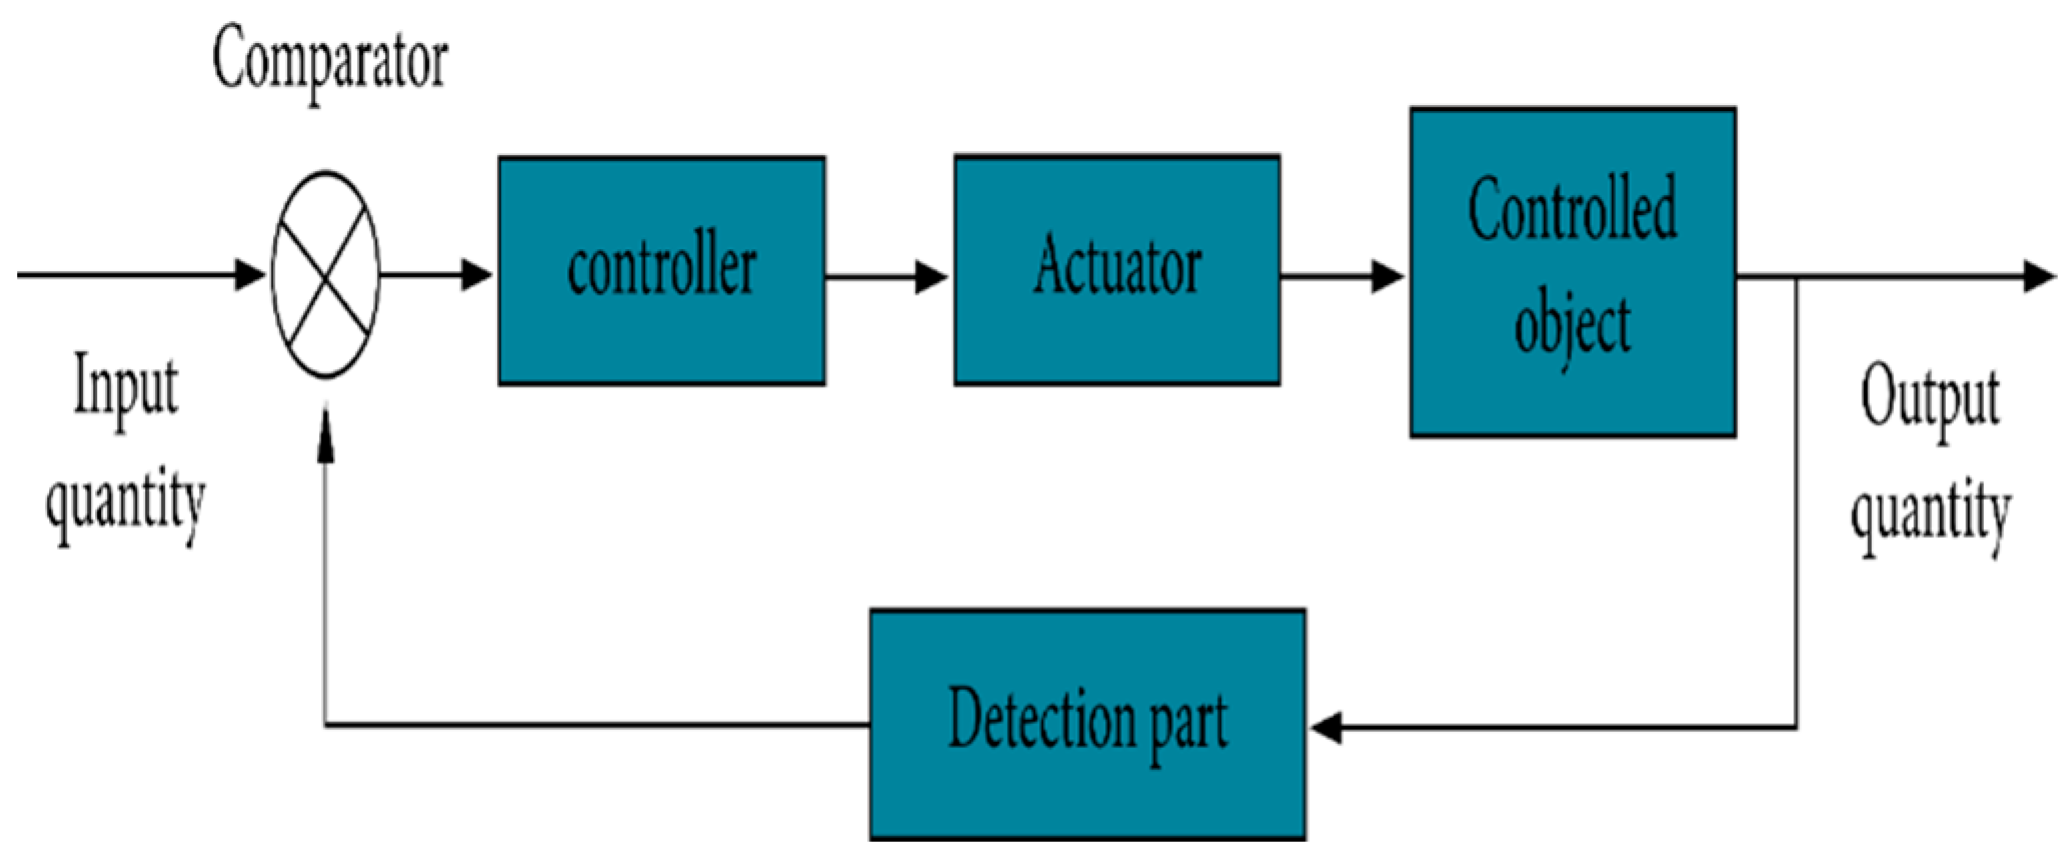
3.1. Proposed System

This is a detailed explanation of the proposed model for an intraocular pressure monitoring system. Besides the existing approaches, our project aims to provide a simple and efficient method that minimizes the time required for measurement. Compared to other methods, our proposed model offers advantages in terms of hardware cost, making it a more accessible and cost-effective option. The primary goal of our system is to detect and monitor the intraocular pressure of the eye accurately. By doing so, it enables the identification of any defects or abnormalities in the eye that may be indicative of underlying eye conditions. Through the implementation of our proposed method, we aim to streamline the process of measuring intraocular pressure, making it more convenient and efficient for both patients and healthcare professionals.
An intraocular pressure monitoring system comprises several key blocks, each serving a specific function. These blocks include the input module, microcontroller, sensor, and output module. In the following sub-sections, we will explain each block in detail.
  • Input Module: The input module is responsible for receiving input signals related to intraocular pressure. This may involve capturing data from external devices or sensors that measure the pressure within the eye. The input signals are then forwarded to the Microcontroller for further processing.
  • Microcontroller: It may include data processing algorithms, calibration routines, and decision-making capabilities. The microcontroller plays a crucial role in managing and controlling the overall functioning of the system.
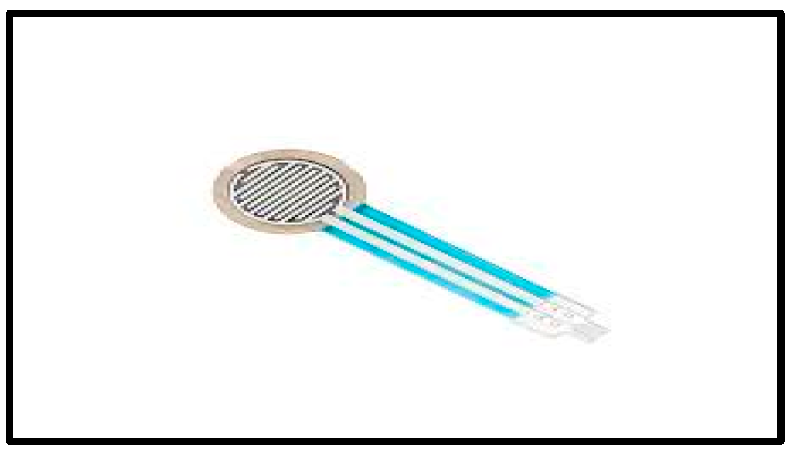
  • Sensor: The sensor utilizes various technologies, such as strain gauges, capacitive sensors, or optical sensors, to detect and quantify the pressure within the eye. The sensor converts the physical pressure into an electrical signal, which is then transmitted to the microcontroller for analysis.
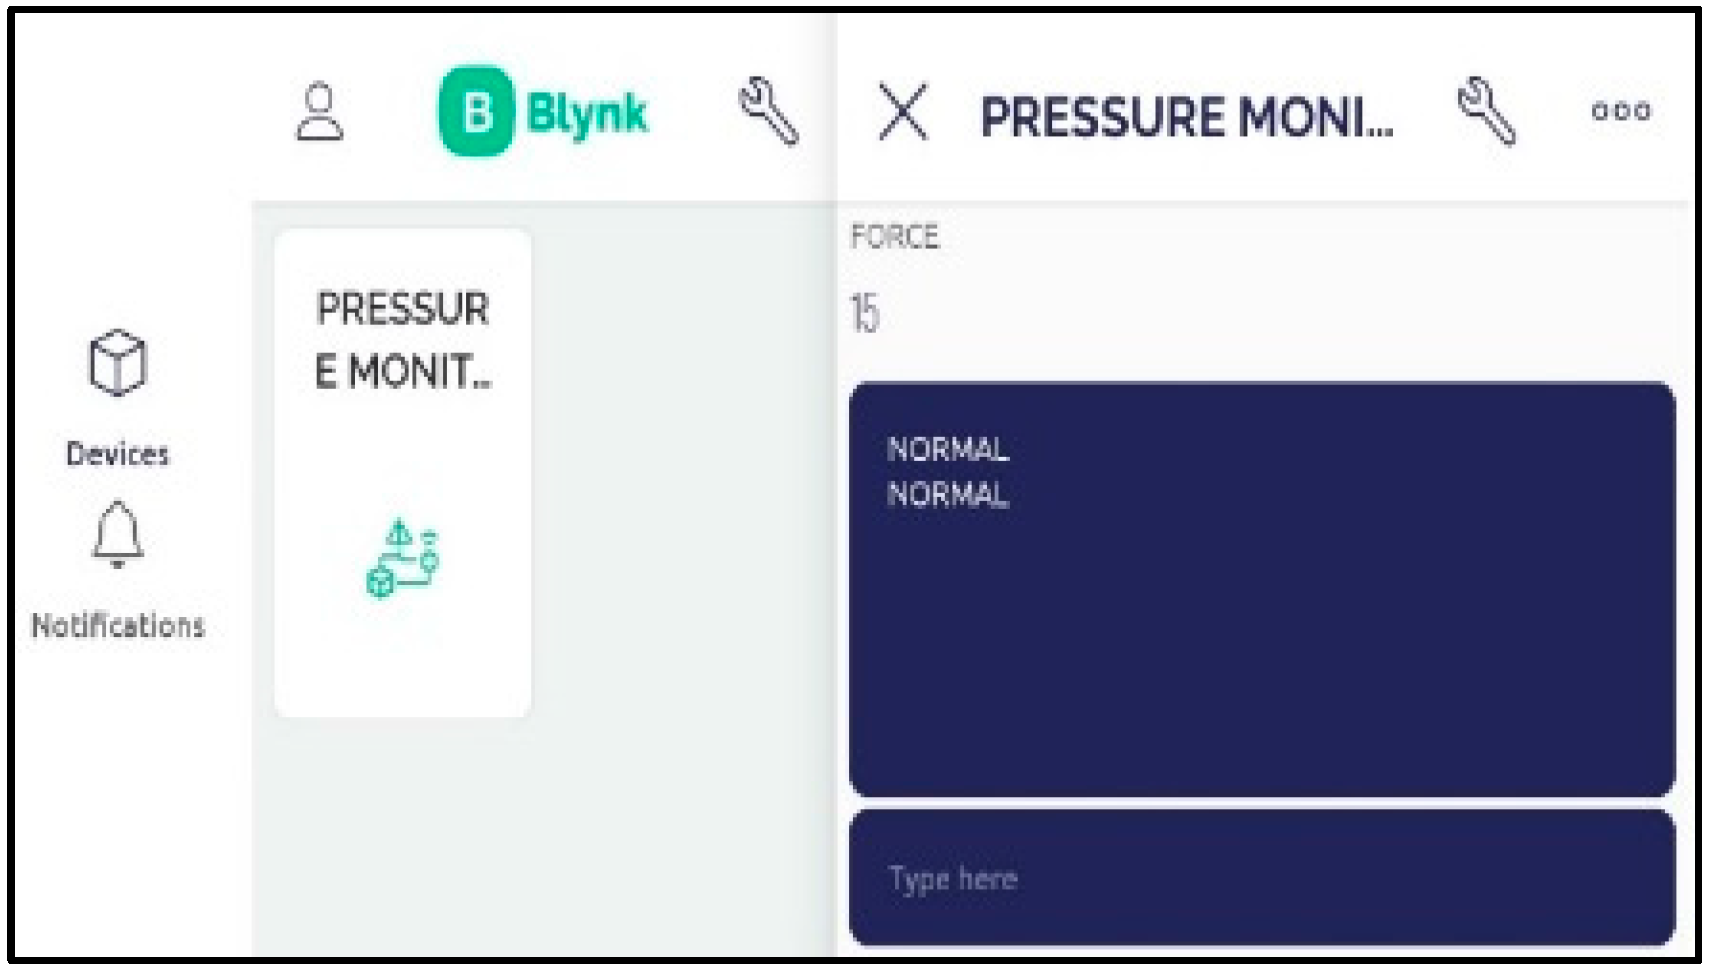
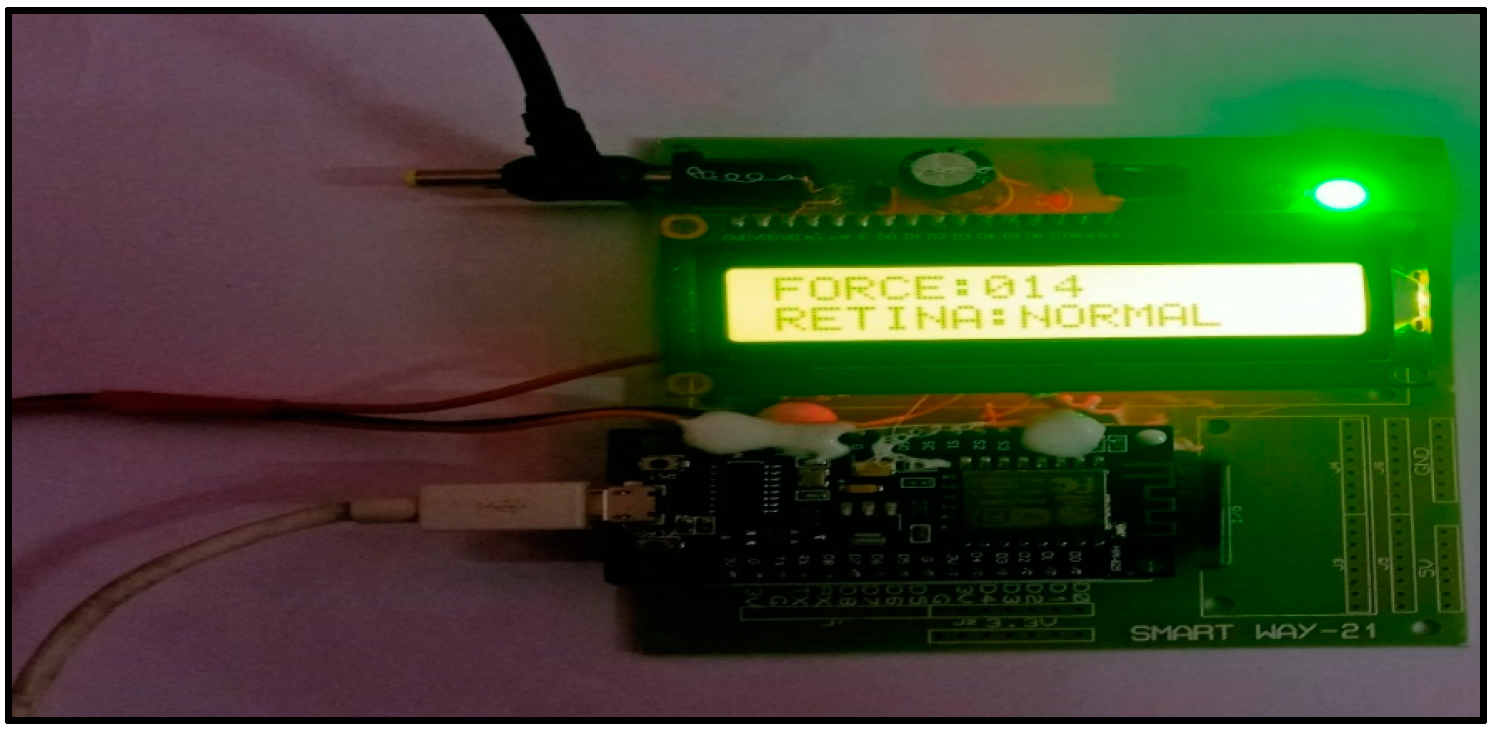
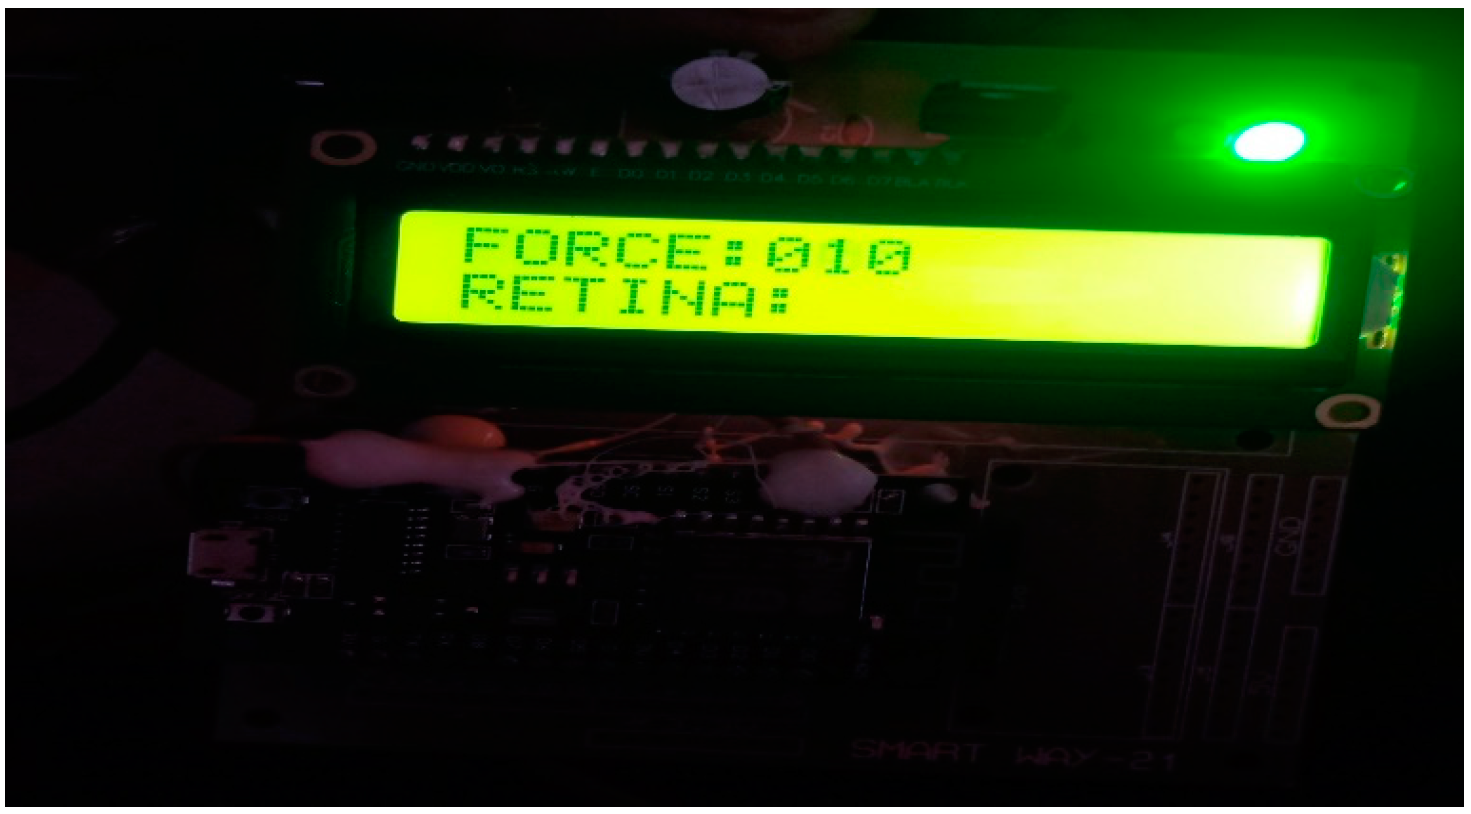
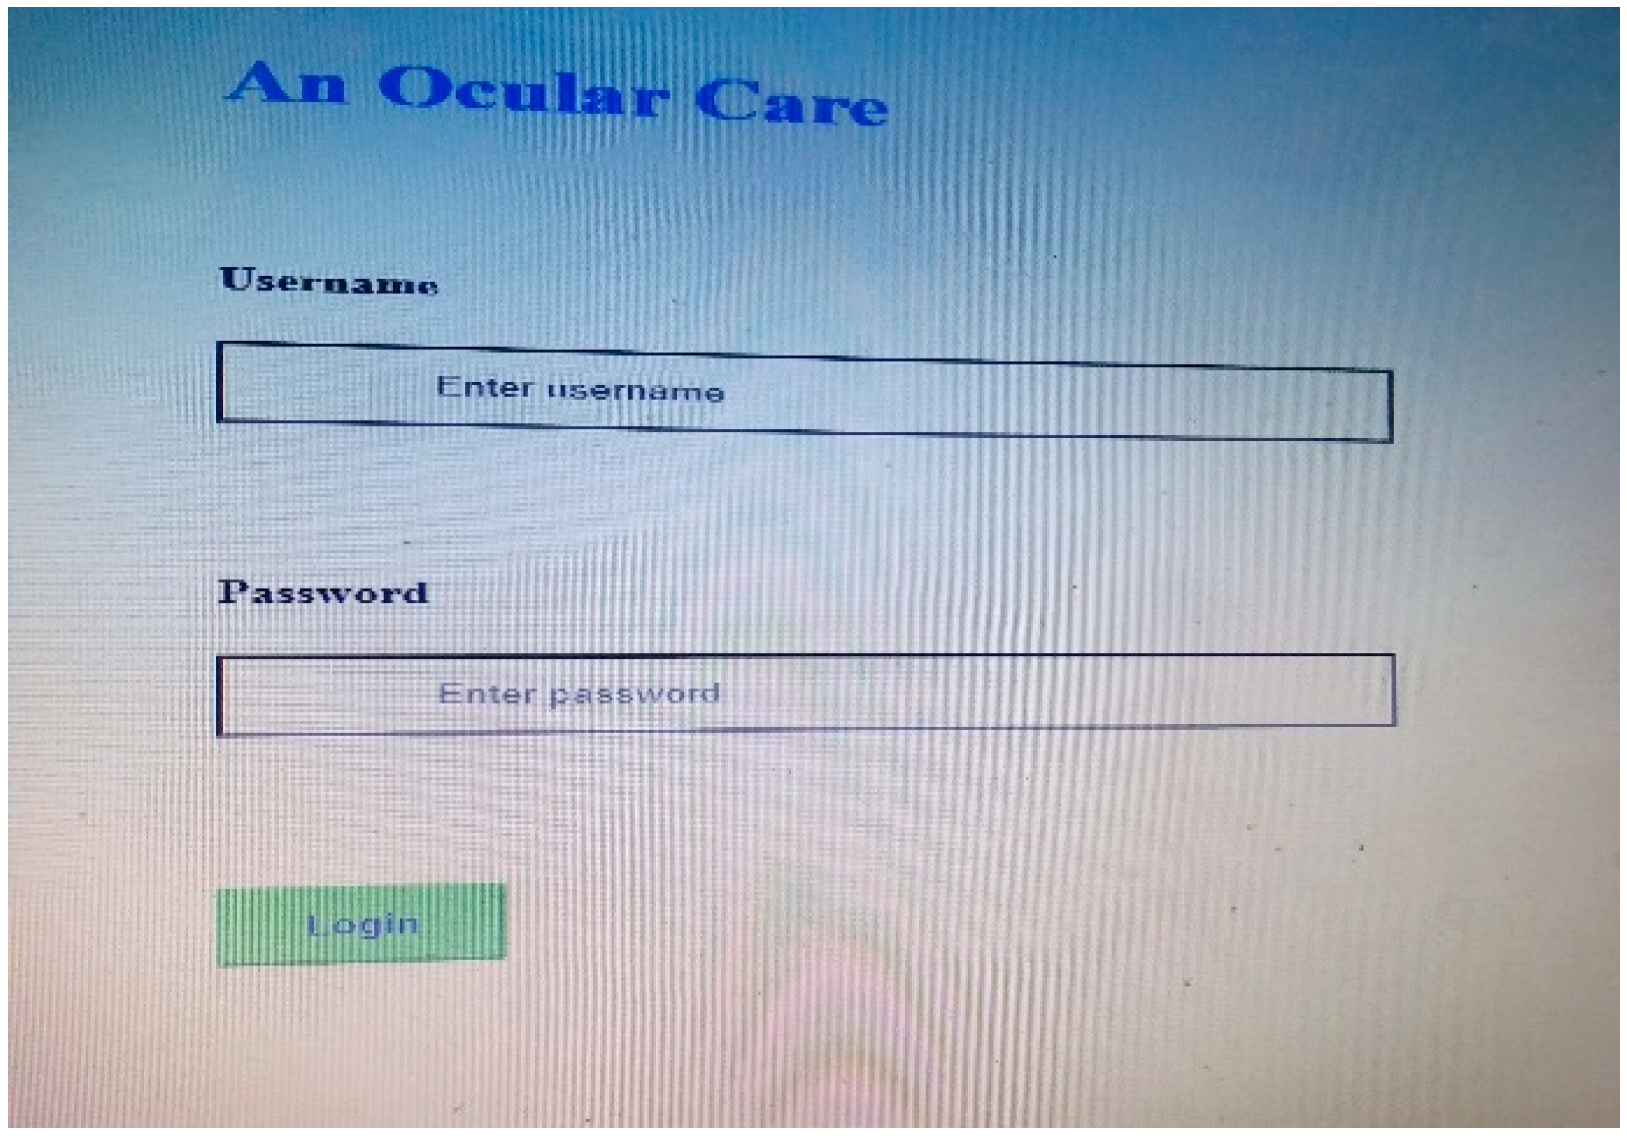
  • Output Module: The output module is responsible for presenting the results or information derived from the measurement of intraocular pressure. This can be in the form of visual displays, audio signals, or data transmission to external devices or systems. The output module enables healthcare professionals or users to interpret and utilize the measured intraocular pressure data effectively.
Each block in the proposed block diagram plays a crucial role in the overall functioning of the intraocular pressure monitoring system. The input module captures the intraocular pressure signals, which are processed by the microcontroller using appropriate algorithms. The sensor ensures accurate measurement of intraocular pressure, while the output module provides meaningful feedback or output to users or healthcare professionals.
The system described in this context primarily comprises three main components. Each of these components serves a specific purpose in the overall functioning of the system. Here is a detailed explanation of each component in Figure 1.
Environmental Control Module: The environmental control module is responsible for managing and controlling the environmental factors that can potentially influence the measurement of intraocular pressure. These factors may include temperature, humidity, and atmospheric pressure. By regulating these parameters, the module ensures a stable and controlled environment for accurate intraocular pressure measurement.
Sealed Chamber: The sealed chamber is a specially designed container that provides an airtight and secure space for placing the intraocular pressure sensor. It is constructed to withstand a certain level of pressure and prevent any external influences from affecting the sensor’s measurements. The sealed chamber helps isolate the sensor from external disturbances, ensuring accurate and reliable readings.
Signal Processing Module: The signal processing module is responsible for processing the signals detected by the intraocular pressure sensor. It entails two important gears: the detection circuit and the signal transmission module. The detection circuit amplifies and filters the weak signals sensed by the sensor, enhancing their strength and quality. The signal transmission module then transmits the processed signals to the subsequent stages of the system for further analysis and interpretation. The environmental control module ensures stable conditions, while the sealed chamber provides a protected space for the sensor. The signal processing module amplifies and transmits the detected signals, enabling further analysis and interpretation of the intraocular pressure measurements.

3.2. Microcontroller

3.2.1. NODE MCU ESP8266

The NodeMCU is an open-source platform that utilizes the ESP8266 microcontroller. It offers the ability to connect various objects and enables data transfer using a Wi-Fi protocol. The GPIO pins allow the NodeMCU to interface with external devices, such as sensors or actuators, through digital input and output signals. This enables communication and control between the NodeMCU and the connected devices. The PWM feature of NodeMCU enables the generation of analog-like signals by varying the duty cycles of the output waveform. This is particularly useful for applications involving dimming LEDs, controlling motor speeds, or generating audio tones. The ADC functionality allows the NodeMCU to convert analog signals from sensors or other analog sources into digital values. This enables the microcontroller to process and analyze real-world analog data. By incorporating these features, the NodeMCU provides a versatile and powerful platform for building internet of things (IoT) projects and connecting them to the digital world via Wi-Fi connectivity.

3.2.2. Force Sensor

A force sensor (Figure 2) is utilized as one of the electronic components. A force sensor is designed to detect and measure changes in pressure or force applied to it. It converts the physical force into an electrical signal that can be processed by a microcontroller or another electronic component.
The working principle of force sensors, specifically force-sensing resistors (FSRs), is based on the concept of contact resistance. FSRs consist of a conductive polymer film that exhibits changes in resistance when a force is applied to its surface. Here is a breakdown of the general working principles.
Conductive Polymer Film: The force sensor incorporates a thin conductive polymer film that acts as the sensing element. This film is made of a material that exhibits a change in electrical resistance when pressure or force is applied. Contact Resistance: When no force is applied to the sensor, the conductive polymer film has a relatively high resistance. As force is exerted on the sensor’s surface, the conductive particles within the film move closer together, reducing the contact resistance. Resistance Variation: The change in contact resistance directly correlates with the applied force. As the force increases, the contact resistance decreases, leading to a proportional change in the overall resistance of the sensor.
Measurable Quantity: The resistance variation can be measured using appropriate circuitry and techniques. Typically, the sensor is connected to a circuit that measures the electrical resistance across the conductive film. This resistance value can then be correlated with the applied force using a calibration curve or equation. By monitoring the resistance changes in the conductive polymer film, force sensors can provide an electrical output that is proportional to the applied force. This allows for the quantification and measurement of force, enabling their use in various applications, including measuring pressure, touch sensing, and force feedback systems.

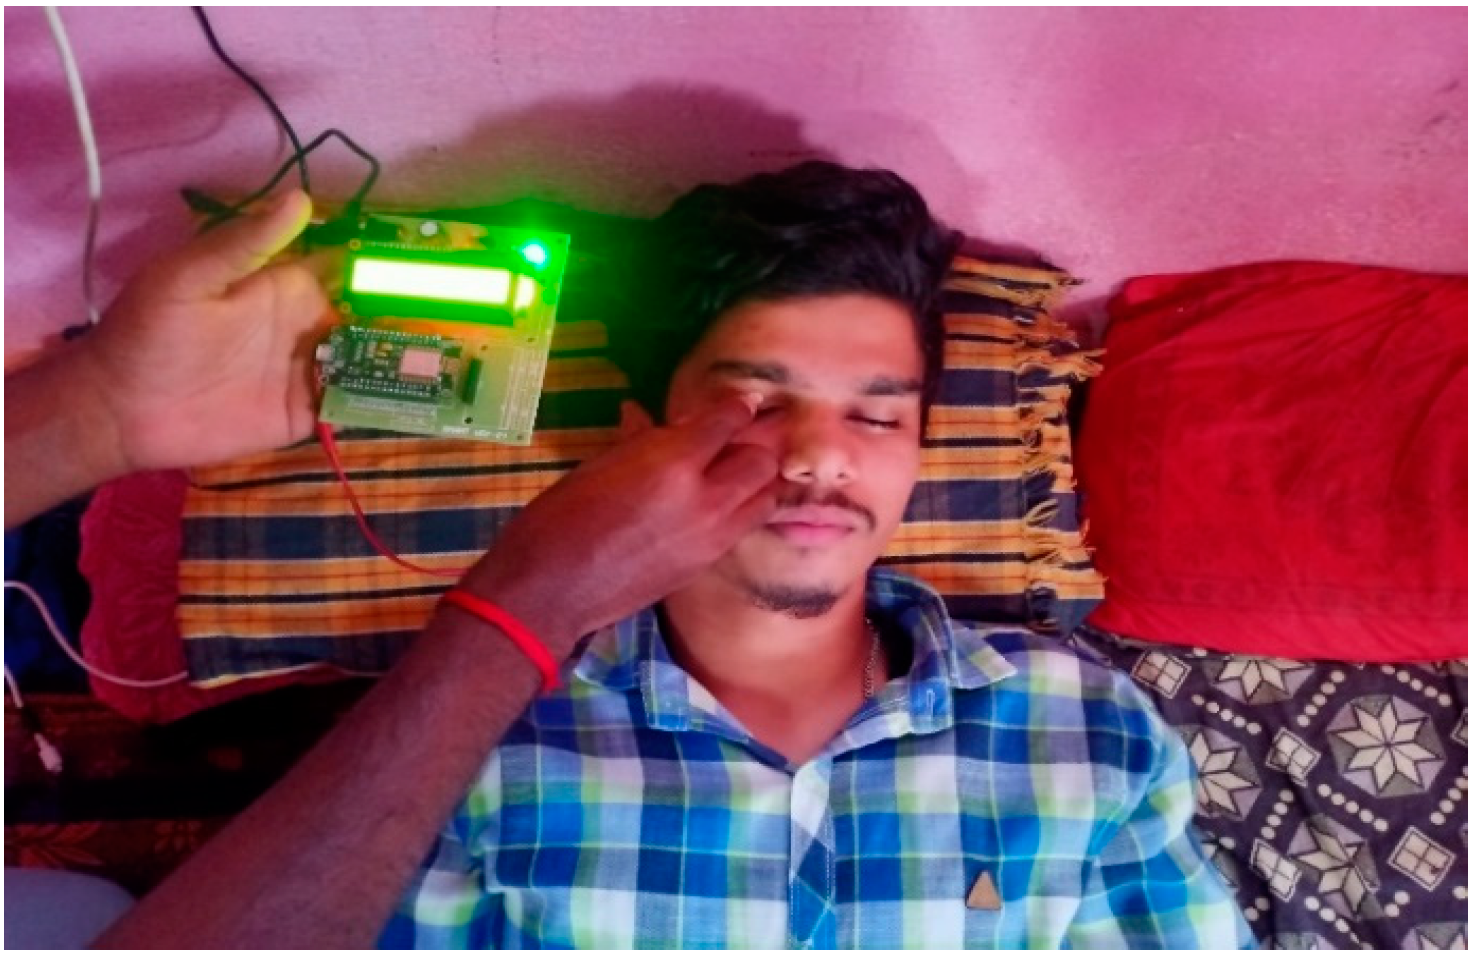
3.2.3. Principle: Fingertip-Test Method

Detecting intraocular pressure (IOP) using fingertips is a technique known as digital palpation or digital tonometry. While it can provide some indication of high IOP, it is imperative to note that this method is not as accurate or reliable as a specialized instrument. Here are a few points to consider:
Technique and Sensation: The described technique involves applying gentle pressure through the closed upper eyelid using the index fingers. The sensation felt during this procedure can vary, but a normal eye may feel somewhat similar to a ripe tomato—not excessively firm or overly soft. However, it is important to note that this is a subjective assessment and can be influenced by individual variations and examiner perception in Figure 3.
Limitations: Digital palpation is a subjective and qualitative method for assessing IOP. It lacks the precision and accuracy of specialized instruments like tonometers that provide quantitative measurements. Additionally, IOP can vary throughout the day and may be affected by factors such as eye conditions and patient characteristics.
Screening Purpose: Digital palpation may serve as a basic screening tool to detect significantly elevated IOP. If there is a noticeable difference in firmness or if the eye feels unusually hard or soft, it may raise the suspicion of high IOP. However, it should not be solely relied upon for a definitive diagnosis or management decisions.
Comprehensive Evaluation: For the accurate assessment and diagnosis of IOP, it is important to refer patients to an eye care professional or specialized center for a comprehensive evaluation. They will use appropriate instruments and techniques to measure IOP accurately, such as applanation tonometry or non-contact tonometry.
Importance of Regular Eye Exams: Routine eye exams performed by eye care professionals are crucial for the early detection and management of conditions such as glaucoma. These exams typically include accurate measurements of IOP using specialized instruments.
In summary, while digital palpation may provide a basic indication of IOP, it is subjective and qualitative in nature. For the accurate assessment and management of IOP, it is essential to seek professional evaluation through comprehensive eye exams conducted by qualified eye care specialists.
Parameters to be Identified: a. intraocular pressure of the eye; b. defects in the retina.
Importance of IOP Management: Given the potential risks associated with abnormal IOP levels, monitoring and managing IOP is essential for preserving ocular health. Regular eye examinations, including IOP measurement, can aid in the early detection and treatment of conditions that may be influenced by IOP.
Overall, maintaining a balanced intraocular pressure is critical for the well-being of the eye and the prevention of vision-threatening conditions. Regular eye care and appropriate management strategies can help ensure the stability of IOP and minimize the risk of associated pathologies.
Defects of retina
Retinal Tear: A retinal tear occurs when the vitreous, the gel-like substance in the center of the eye, pulls on the thin retinal tissue, causing a break. This condition is often accompanied by symptoms like floaters (small specks or spots) and flashing lights.

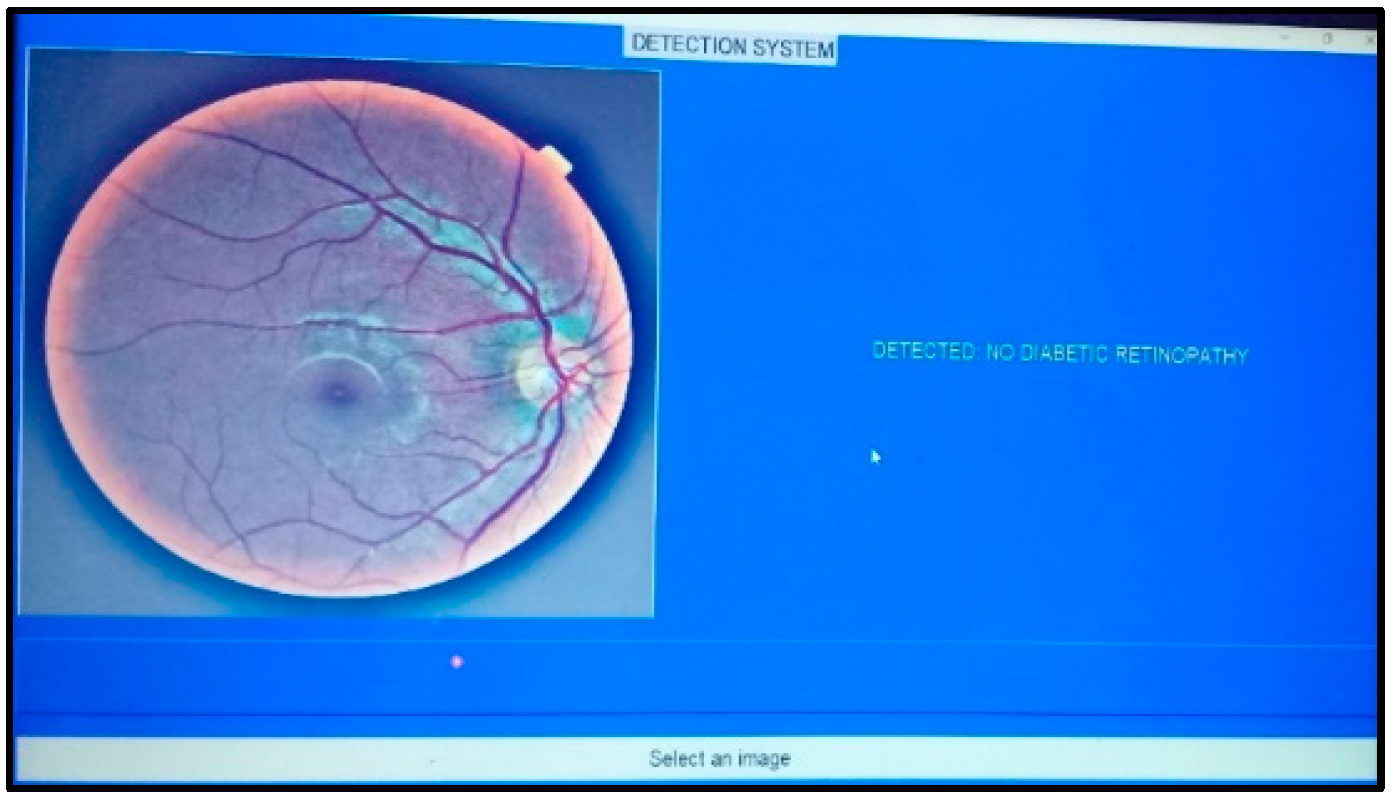
4. Results and Discussions

The use of pressure sensors for real-time IOP monitoring has been explored in various research studies and experiments. These sensors are designed to measure the pressure within the eye and provide continuous data on IOP levels. They can be integrated into wearable devices or implantable systems to enable non-invasive or minimally invasive monitoring.
By continuously monitoring IOP, healthcare professionals can gain a more inclusive view of the fluctuations and patterns in a patient’s eye pressure. This information can aid in determining the effectiveness of current treatments, adjusting medication dosage or timing, and identifying potential triggers or risk factors for glaucoma progression.
Real-time IOP monitoring has the potential to enhance patient care and improve outcomes in glaucoma management. However, it is important to note that while research and development in this area are promising, the widespread implementation of such monitoring systems may still be limited. Further studies and advancements are needed to ensure the accuracy, reliability, and practicality of these monitoring solutions for routine clinical use. If you are conducting experiments in this field, it is essential to adhere to ethical guidelines and collaborate with healthcare professionals and experts in ophthalmology to ensure the validity and safety of your research.
Figure 4 shows a detailed view of the prototype model of the intraocular pressure monitoring system.
Figure 5 shows the real-time monitoring of intraocular pressure of the eye, and displays the condition of the eye. Figure 6 shows the condition of the retina and displays the results. Figure 7 shows the detailed output view of the prototype model of the intraocular pressure monitoring system, which indicates the force and the normality of the retina. Figure 8 shows a detailed view of the prototype model of the intraocular pressure monitoring system obtained by the placement of sensors and measurements. Figure 9 shows the real-time output of the intraocular pressure monitoring system. Figure 5, Figure 6, Figure 7, Figure 8, Figure 9, Figure 10, Figure 11, Figure 12 and Figure 13 are output screenshots.
Sample photos: Results are obtained for various samples.
Random forest is better than all other machine learning algorithms and has the highest accuracy.
Table 1 shows the Random forest results compared with all other models with various training and testing accuracies.
Figure 14 highlights that RF shows extraordinary results when compared with other state-of-the-art models.

5. Conclusions

This paper focused on developing a more precise and accurate real-time intraocular pressure monitoring system for individuals with severe glaucoma. The NodeMCU offers a flexible and strong platform for connecting sensors to the digital world via WiFi connectivity. This leads to the design of a wearable device for continuous monitoring of glaucoma patients using a pressor sensor that can meet their needs over a long period. This device can be manufactured at a very low cost and can be installed in diagnostic centers, hospitals, and homes. Predictions are undertaken using machine learning algorithms, and Random forest shows the best results among the algorithms. This leads to more cost-effective, accurate outputs and less time consumption. Also, it can be further improved in the future with applications to store doctor and patient details in the cloud platform for handling Big Data efficiently.

Author Contributions

S.C. and V.N. framed the idea. ML algorithm implementation and paper drafting by R.G. Verification and validation by S.S. All authors have read and agreed to the published version of the manuscript.

Funding

This research received no external funding.

Institutional Review Board Statement

Not applicable.

Informed Consent Statement

Not applicable.

Data Availability Statement

The original contributions presented in the study are included in the article, further inquiries can be directed to the corresponding author.

Conflicts of Interest

The authors declare no conflict of interest.

References

  1. Agaoglu, S.; Diep, P.; Martini, M.; Kt, S.; Baday, M.; Araci, I.E. Ultra-sensitive microfluidic wearable strainsensor for intraocular pressure monitoring. Lab A Chip 2018, 18, 3471–3483. [Google Scholar] [CrossRef] [PubMed]
  2. An, H.; Chen, L.; Liu, X.; Zhao, B.; Zhang, H.; Wu, Z. Microfluidic contact lenses for unpowered, continuous and non-invasive intraocular pressure monitoring. Sens. Actuators A Phys. 2019, 295, 177–187. [Google Scholar]
  3. Brezhnev, A.Y.; Baranov, V.I.; Kuroyedov, A.V.; Petrov, S.Y.; Antonov, A.A. 24-hour intraocular pressure monitoring: Opportunities and challenges. Natl. J. Glaucoma 2018, 17, 77–85. [Google Scholar]
  4. Craig, J.E.; Han, X.; Qassim, A.; Hassall, M.; Cooke Bailey, J.N.; Kinzy, T.G.; Khawaja, A.P.; An, J.; Marshall, H.; Gharahkhani, P.; et al. Multitrait analysis of glaucoma identifies new risk loci and enables polygenic prediction of disease susceptibility and progression. Nat. Genet. 2020, 52, 160–166. [Google Scholar] [CrossRef] [PubMed]
  5. Cvenkel, B.; Atanasovska Velkovska, M. Self-monitoring of intraocular pressure using Icare HOME tonometry in clinical practice. Clin. Ophthalmol. 2019, 13, 841–847. [Google Scholar] [CrossRef]
  6. Devalla, S.K.; Liang, Z.; Pham, T.H.; Boote, C.; Strouthidis, N.G.; Thiery, A.H.; Girard, M.J. Glaucoma management in the era of artificial intelligence. Br. J. Ophthalmol. 2020, 104, 301–311. [Google Scholar] [PubMed]
  7. Enders, P.; Hall, J.; Bornhauser, M.; Mansouri, K.; Altay, L.; Schrader, S.; Dietlein, T.S.; Bachmann, B.O.; Neuhann, T.; Cursiefen, C. Telemetric intraocular pressure monitoring after boston keratoprosthesis surgery using the eyemate-IO sensor: Dynamics in the first year. Am. J. Ophthalmol. 2019, 206, 256–263. [Google Scholar] [CrossRef]
  8. Garg, A.; Vickerstaff, V.; Nathwani, N.; Garway-Heath, D.; Konstantakopoulou, E.; Ambler, G.; Bunce, C.; Wormald, R.; Barton, K.; Gazzard, G.; et al. Efficacy of repeat selective laser trabeculoplasty in medication-naive open-angle glaucoma and ocular hypertension during the LiGHT trial. Ophthalmology 2020, 127, 467–476. [Google Scholar] [CrossRef] [PubMed]
  9. Karunaratne, I.K.; Lee CH, C.; Or, P.W.; Wei, Y.; Chong, I.T.; Yang, Y.; Yu, M.; Lam, D.C.C. Wearable dual-element intraocular pressure contact lens sensor. Sens. Actuators A Phys. 2021, 321, 112580. [Google Scholar] [CrossRef]
  10. Kim, J.; Park, J.; Park, Y.G.; Cha, E.; Ku, M.; An, H.S.; Lee, K.-P.; Huh, M.-I.; Kim, J.; Kim, T.-S.; et al. A soft and transparent contact lens for the wireless quantitative monitoring of intraocular pressure. Nat. Biomed. Eng. 2021, 5, 772–782. [Google Scholar] [CrossRef] [PubMed]
  11. Kim, J.; Kim, J.; Ku, M.; Cha, E.; Ju, S.; Park, W.Y.; Kim, K.H.; Kim, D.W.; Berggren, P.-O.; Park, J.U. Intraocular pressure monitoring following islet transplantation to the anterior chamber of the eye. Nano Lett. 2019, 20, 1517–1525. [Google Scholar] [CrossRef] [PubMed]
  12. Wu, J.; Tavakoli, A.; Weber, A.J.; Li, W. Wireless, passive strain sensor in a doughnut-shaped contact lens for continuous non-invasive self-monitoring of intraocular pressure. Lab A Chip 2020, 20, 332–342. [Google Scholar]
  13. Yadav, K.S.; Rajpurohit, R.; Sharma, S. Glaucoma: Current treatment and impact of advanced drug delivery systems. Life Sci. 2019, 221, 362–376. [Google Scholar] [PubMed]
  14. Stein, J.D.; Khawaja, A.P.; Weizer, J.S. Glaucoma in adults-screening, diagnosis, and management. JAMA 2021, 325, 164–174. [Google Scholar] [CrossRef] [PubMed]
  15. Li, L.; Xu, M.; Liu, H.; Li, Y.; Wang, X.; Jiang, L.; Wamg, Z.; Fan, X.; Wang, N. A large-scale database and a CNN model for attention-based glaucoma detection. IEEE Trans. Med. Imaging 2019, 39, 413–424. [Google Scholar] [CrossRef] [PubMed]
  16. Li, L.; Xu, M.; Wang, X.; Jiang, L.; Liu, H. Attention based glaucoma detection: A large-scale database and CNN model. In Proceedings of the IEEE/CVF Conference on Computer Vision and Pattern Recognition, Long Beach, CA, USA, 16–20 June 2019; pp. 10571–10580. [Google Scholar]
  17. Pang, Y.; Li, Y.; Wang, X.; Qi, C.; Yang, Y.; Ren, T.-L. A contact lens promising for non-invasive continuous intraocular pressure monitoring. RSC Adv. 2019, 9, 5076–5082. [Google Scholar] [CrossRef] [PubMed]
  18. Rathi, S.; Andrews, C.A.; Greenfield, D.S.; Stein, J.D. Trends in glaucoma surgeries performed by glaucoma subspecialists versus nmb. Ophthalmology 2021, 128, 30–38. [Google Scholar] [CrossRef] [PubMed]
  19. Sanchez, I.; Martin, R. Advances in diagnostic applications for monitoring intraocular pressure in Glaucoma: A review. J. Optom. 2019, 12, 211–221. [Google Scholar] [CrossRef] [PubMed]
  20. Saxby, E.; Mansouri, K.; Tatham, A.J. Intraocular pressure monitoring using an intraocular sensor before and after glaucoma surgery. J. Glaucoma 2021, 30, 941–946. [Google Scholar] [CrossRef] [PubMed]
  21. Shin, D.Y.; Jung, K.I.; Park, H.Y.L.; Park, C.K. The effect of anxiety and depression on progression of glaucoma. Sci. Rep. 2021, 11, 1769. [Google Scholar] [PubMed]
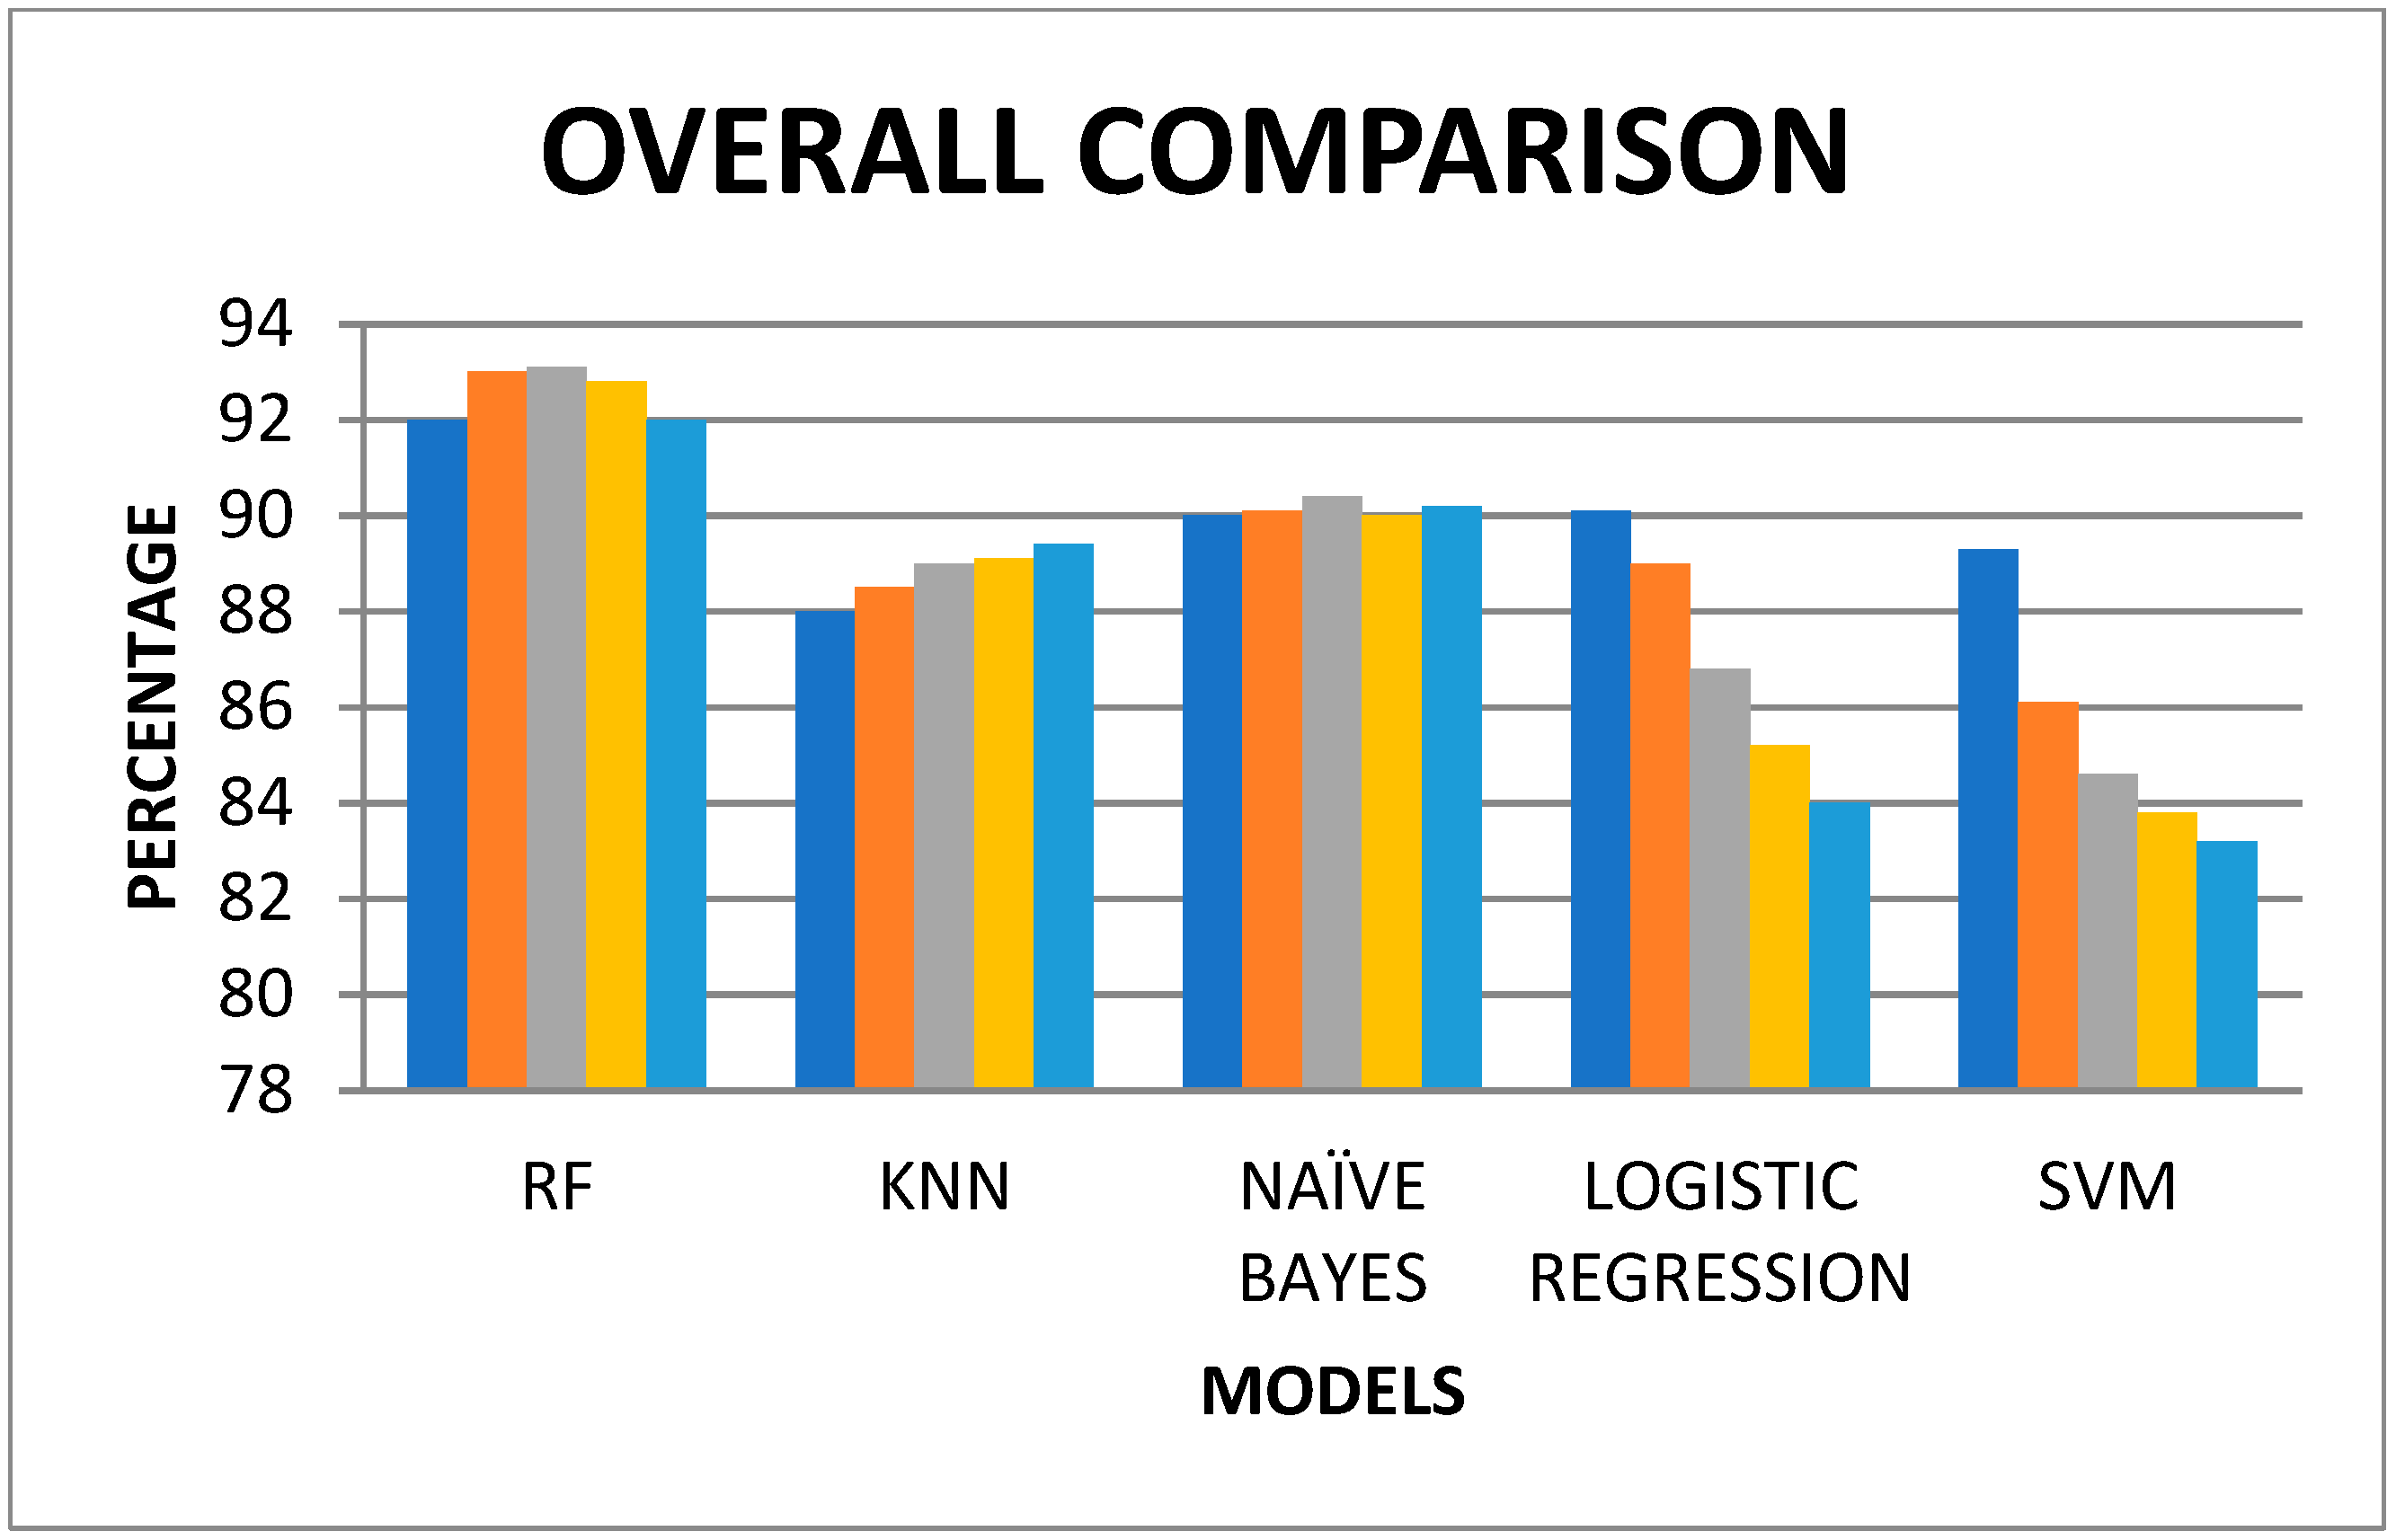
Figure 1. Proposed system architecture.
Engproc 59 00179 g001
Figure 2. Force sensor.
Engproc 59 00179 g002
Figure 3. Fingertip-test Method.
Engproc 59 00179 g003
Figure 4. Prototype model.
Engproc 59 00179 g004
Figure 5. Applications for real-time monitoring.
Engproc 59 00179 g005
Figure 6. Abnormality detection.
Engproc 59 00179 g006
Figure 7. Output of prototype.
Engproc 59 00179 g007
Figure 8. Placement of sensors.
Engproc 59 00179 g008
Figure 9. Output.
Figure 9. Output.
Engproc 59 00179 g009
Figure 10. Sample 1.
Engproc 59 00179 g010
Figure 11. Sample 2.
Engproc 59 00179 g011
Figure 12. Web login page.
Engproc 59 00179 g012
Figure 13. Patient details.
Engproc 59 00179 g013
Figure 14. Overall comparison of RF with other ML models.
Engproc 59 00179 g014
Table 1. Accuracy comparison for different trainings and testings.
Training & TestingRFKNNNAÏVE BAYESLOGISTIC REGRESSIONSVM
50 & 5092889090.189.3
60 & 409388.590.18986.1
70 & 3093.18990.486.884.6
80 & 2092.889.19085.283.8
90 & 109289.490.28483.2
Disclaimer/Publisher’s Note: The statements, opinions and data contained in all publications are solely those of the individual author(s) and contributor(s) and not of MDPI and/or the editor(s). MDPI and/or the editor(s) disclaim responsibility for any injury to people or property resulting from any ideas, methods, instructions or products referred to in the content.

