Abstract
The welding industry plays a fundamental role in manufacturing. Ensuringweld quality is critical when safety, reliability, performance, and the associated cost are taken into account. A ungsten inert gas (TIG) weld quality assessment can be a laborious and time-consuming process. The current state of the art is quite simple, with a person continuously monitoring the procedure. However, this approach has some limitations. Operator decisions can be subjective, and fatigue can affect their observations, leading to inaccuracies in the assessment. In this research project, a deep learning approach is proposed to classify weld defects using convolutional neural networks (CNNs) to automate the process. The dataset used for this project is sourced from Kaggle, provided by Bacioiu et al. The proposed CNN-based approach aims to accurately classify weld defects using the image data. This study trains the model on the welding dataset, using five convolutional layers followed by five pooling layers and, finally, three fully connected layers. The softmax activation function is employed in the output layer to categorize the input into the six weld categories. The per-class metrics, such as precision, recall, and F1-score, suggest that the model is dependable and accurate.
1. Introduction
The manufacturing sector heavily relies on the welding industry. Welding plays a crucial and essential role in joining various metal parts effectively. Welding stands as a prominent method for joining diverse metal components. The process involves applying heat and pressure to melt the material and create a solid weld connection [1]. TIG welding, which is widely used in industries, is particularly used for joining valuable components. It is commonly used in pipe welding, pipeline construction, and various other sectors like automobiles, sheet metal, aerospace, building, and construction for joining and repairing purposes [2]. TIG welding is superior to other joining methods, offering advantages like producing high-quality welds with minimal distortion and holes, being versatile in joining different materials, allowing precise control over the welding process, producing little spatter, and not requiring flux or emitting harmful fumes [3].
Cracks, porosity, burn-through, incomplete fusion, and excessive spatter are just a few defects that are frequently produced by welding methods. To maintain the integrity of the product, it is crucial to ensure weld quality and find these flaws. Numerous techniques, like the Ultrasonic Test (UT), Visual Inspection, Radiographic Test (RT), Magnetic Particle Inspection (MPI), Liquid Penetrant Test, and so on, have been employed to assure the integrity of welds [4,5]. However, manual examination is more time-consuming, subjective, and susceptible to human error, which results in uneven problem detection. Although it might be useful to find flaws through post-inspection, fixing them can be costly and time-consuming. Therefore, it is essential to have a more precise real-time detection system for detecting faults in order to save costs and accelerate welding. Through the use of such a technology, the welding process might be completed more quickly with considerable cost savings.
Machine learning is experiencing rapid growth and widespread adoption, particularly across industries. Machine learning finds applications in various domains, including fraud detection, image and audio recognition, natural language processing, and predictive analytics [6,7,8]. Convolutional Neural Networks (CNNs), in particular, are an important trend in machine learning (ML) that have reshaped the computer vision and image processing fields. CNNs are exclusively designed for processing pixel data and are widely utilized in various applications such as image and video recognition [9,10].
In this research, an automated defect classification model is developed using a Convolutional Neural Network (CNN) that classifies the images captured by a HDR Camera affixed to a welding robot, capturing the images of the weld pool and the immediate vicinity in front of the welding arc (Sourced from Kaggle, Daniel Bacioiu et al.). This research correlates the concept of machine vision with machine learning in order to automate defect detection in real time, in turn making quality assessment easier.
2. Literature Review
Zhifen Zhang and colleagues, in their research paper titled “Convolutional Neural Network-Based On-line Defect Detection of Weld Images in Robotic Arc Welding for Aluminum Alloy”, tackle the issue of the precise detection of weld defects in real time in robotic welding in manufacturing industries, with a specific emphasis on aluminum alloys. The authors utilize an 11-layer CNN model to develop an enhanced model capable of identifying weld penetration defects. Through comprehensive testing, the outcomes showcase how the proposed CNN model surpasses previous methods, achieving an impressive mean classification accuracy of 99.38% [11].
Bacioiu and his colleagues present a research paper titled “Utilizing Visible Spectrum Camera and Machine Learning for Automated Defect Classification of SS304 TIG Welding Process”. The paper introduces a system designed to evaluate tungsten inert gas (TIG) weld quality through image classification. The system utilizes a visible spectrum images of the weld pool, which are stabilized by using HDR technology to compensate for the intense arc illumination. The authors trained two architectures, namely FCN and CNN, making use of a new TIG welding dataset. The FCN architectures exhibited smaller training losses compared to the CNN architectures. However, when assessing accuracy after training, the CNN architectures outperformed the FCN architectures in terms of accuracy for the six-class test. Furthermore, the FCN architectures demonstrated weaker representations of defects compared to the CNN architectures [12].
Distun Stephen and his co-author present a research paper titled “Development of a Deep Learning-Based Radiographic Image Classification System for Weld Defect Identification”. The paper introduces an approach that utilizes deep learning techniques to automatically identify various types of weld defects using radiographic images. They design and train a Convolutional Neural Network (CNN) model using 200 labeled radiographic images, each depicting one of four types of welding defects. Initially, without data augmentation, the model exhibits signs of overfitting, resulting in an accuracy of 80% for validation and a loss of 6.7. However, by implementing data augmentation, the proposed method achieves significant improvements, with 95% validation accuracy and 99.2% training accuracy [13].
Samuel Kumaresan and colleagues, in their research paper titled “Weld Defect Classification Using Transfer Learning with CNN”, address the limitations of traditional Image Processing Techniques (IPTs) for weld defect detection and classification by adopting Deep Neural Networks (DNNs) and transfer learning methods. The researchers gathered and labeled 940 image patches of weld defects from the GDXray database. They made use of previously trained CNN models, namely VGG16 and ResNet50, for extracting features from the weld defect dataset. The SVM classifier, trained on features extracted by ResNet50, outperformed other models, achieving an impressive 98% accuracy. The proposed models exhibited high test accuracies, surpassing previous studies, with 99.4% for 9 defect classification and 97.8% for 14 defect classification [14].
Khumaidi and his colleagues, in their research paper titled “Utilizing Convolutional Neural Network (CNN) and Gaussian Kernel for Welding Defect Classification”, focus on enhancing the visual evaluation process for identifying weld defects by employing CNN. The proposed system incorporates a Gaussian kernel for image blurring, which aids in extracting pertinent information from the original image while minimizing interference and noise. The outcomes illustrate consistent and precise training results, with a training data accuracy value close to 100%. Similarly, for testing and validation data, the accuracy ranges between 95% and 100%. The average accuracy for the testing phase is reported to be 95.83% [15].
Stefania Perri and her colleagues present a research paper titled “Classification of Welding Defects Using Convolutional Neural Network”. The paper introduces a specialized CNN called WelDeNet, developed for the classifying of welding defects, namely cracks (CR), porosity (PO), lack of penetration (LP), and no defect (ND) in digital images from radiographic tests. They developed a novel set of data comprising 24,407 images. The model incorporates 14 cascaded convolutional layers. Through their customized CNN architecture, they achieve an impressive test accuracy of 99.5% [16].
3. Methodology
3.1. Data
In this project, the publicly available Kaggle dataset “TIG Stainless Steel 304” provided by Daniel Bacioiu et al. was utilized for weld classification purposes. The dataset was captured using Xiris XVC-1000, an HDR camera affixed to a welding robot, capturing images of the weld pool and the immediate vicinity in front of the welding arc. A comprehensive collection of labeled images was gathered from 56 welding runs, encompassing categories such as ‘good weld’, ‘contamination’, ‘burn through’, ‘high travel speed’, ‘lack of fusion’, and ‘no shielding gas’. The dataset’s labeling information is presented in Table 1.

Table 1.
Dataset labels.
Table 2 describes the composition of the dataset including the train, validation, and test sets for the six-class test.
Table 2.
Dataset split between train, validation, and test sets.
It can be observed that the dataset contains a class imbalance problem.
3.2. Data Preprocessing
To prepare the image for processing, it was resized from its original size of 1280 × 70 pixels to a fixed shape of 200 × 200 pixels. This resizing step is crucial for efficient processing, as it helps capture the global context of the image and ensures robustness in tasks like object recognition. Following resizing, the pixel values were normalized to a range of [0, 1]. This normalization was achieved by dividing each pixel value by the maximum pixel value (255). Normalizing the pixel values brings the input data to a consistent scale and range, making it easier for the CNN to learn and extract meaningful features. Furthermore, it is worth noting that the available dataset was already in grayscale, which reduced input dimensionality and enhanced processing speed. In addition, to handle the imbalance in the dataset, class weights were extracted so that the CNN model did not become biased towards the majority class and learned to recognize all classes equally well.
3.3. Design of Neural Network
In this research, a Convolutional Neural Network (CNN) was used for developing the classification model. CNNs or Convolutional Neural Networks belong to the Artificial Neural Networks (ANNs) family, which are exclusively designed for processing pixel data and are widely utilized in various applications such as image and video recognition [9,10]. Unlike traditional matrix multiplication, CNNs incorporate the technique of convolution in at least one layer, which enhances their capabilities in analyzing and interpreting visual data.
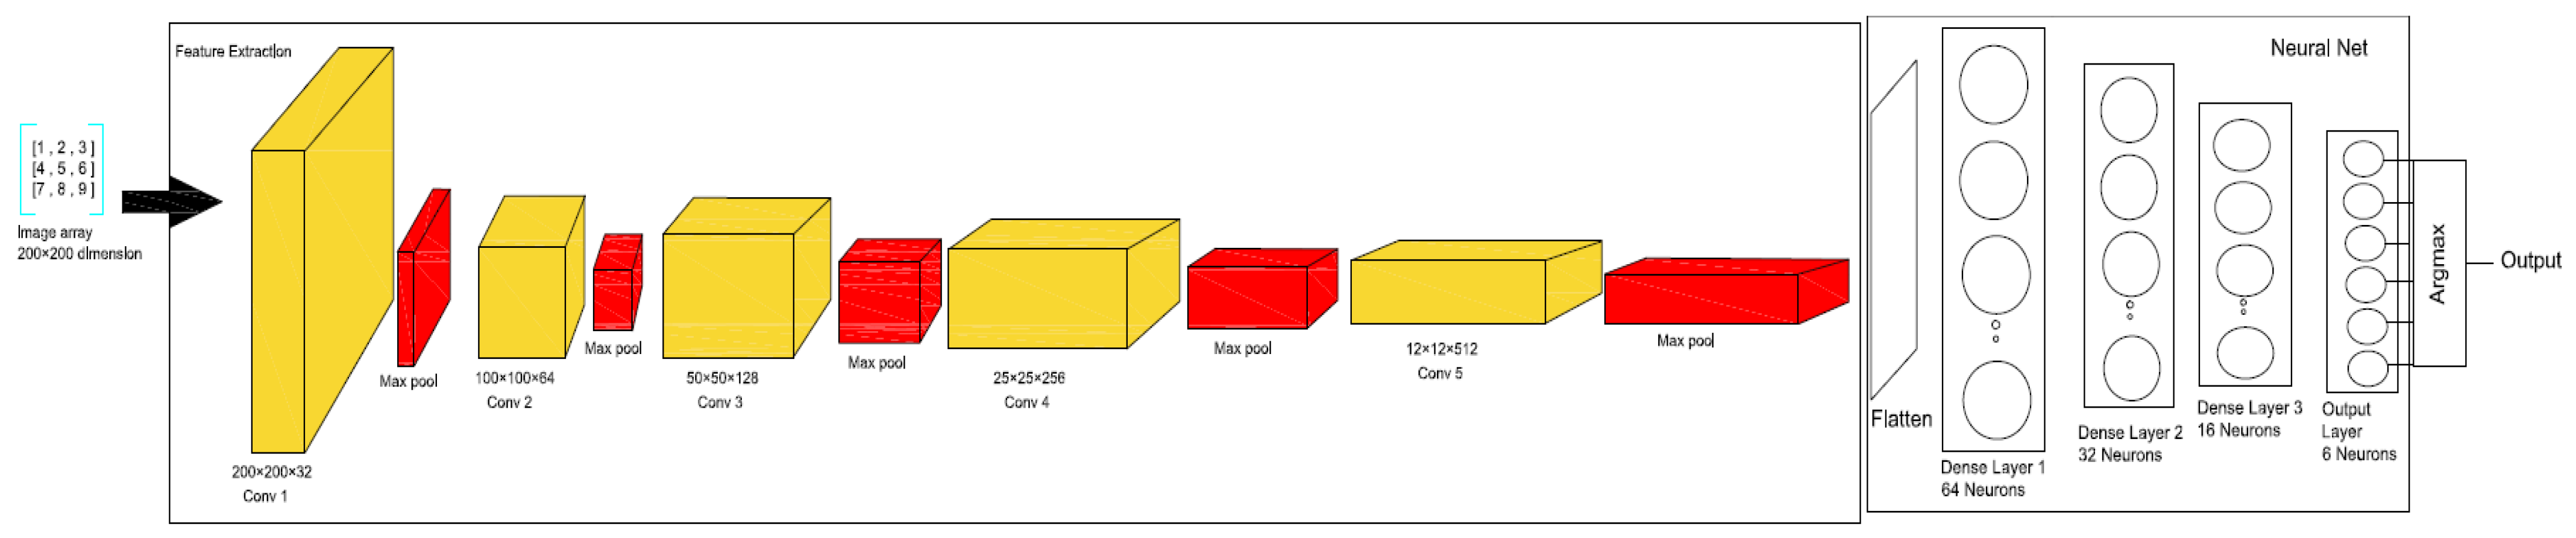
CNN architectures typically contain three layers, namely Convolutional layer, Pooling layer, and Fully Connected layer. In the current study, the CNN architecture incorporates five convolutional layers, each with a 3 × 3 filter size, followed by five maximum pooling layers. The stride for the convolutional layer is set to one (/1). The maximum pooling layer operates by sliding a 2 × 2 window over the image, with a stride of two (/2) both horizontally and vertically, and selecting the maximum value within the window. After the fifth max pooling layer, the resulting output is flattened, converting it into a 1D vector, and transmitted through three fully connected layers. The first fully connected layer consists of 64 nodes, followed by a second layer with 32 nodes, and a third layer having 16 nodes. Subsequently, the third fully connected layer is then linked to the final layer, which has six nodes representing the six different classes in the classification task. The ReLU function is used as an activation function in the convolutional and fully connected layers. The softmax activation function is employed in the output layer to categorize the input into the six weld categories.
Table 3 and Figure 1 provide a detailed description and visual representation of the neural network architecture employed in this study.
Table 3.
CNN architecture used.

Figure 1.
CNN architecture.
3.4. Training and Convergence
The CNN model underwent training for a total of 30 epochs, utilizing a batch size of 256. During training, a total of 2,095,062 trainable parameters were adjusted and updated using an optimization algorithm. To prevent overfitting, early stopping with a patience value of 7 was implemented. This enabled automatic early stopping by monitoring the validation F1_average score. If there was no improvement in the validation F1_average score for seven consecutive epochs, the training process would halt and the model would be restored with the best weights observed during training.
The network utilizes the Sparse Categorical Cross-Entropy function to calculate the loss, which involves comparing the class probabilities being predicted with the true integer labels. During the training of the CNN, the internal parameters (weights and biases) are adjusted through the backpropagation algorithm. This algorithm involves calculating the gradient functions of the loss function using the network’s parameters and updating the parameters accordingly to progressively minimize the loss. Through this iterative process, the network gradually converges towards the desired solution. The solution is computed using the Stochastic Gradient Descent (SGD) optimization algorithm with the following hyperparameters: i. Learning rate = 0.01, ii. Number of epochs = 30, iii. L2 regularization = 0.0005, iv. Dropout rate = 0.25.
3.5. Results and Discussion
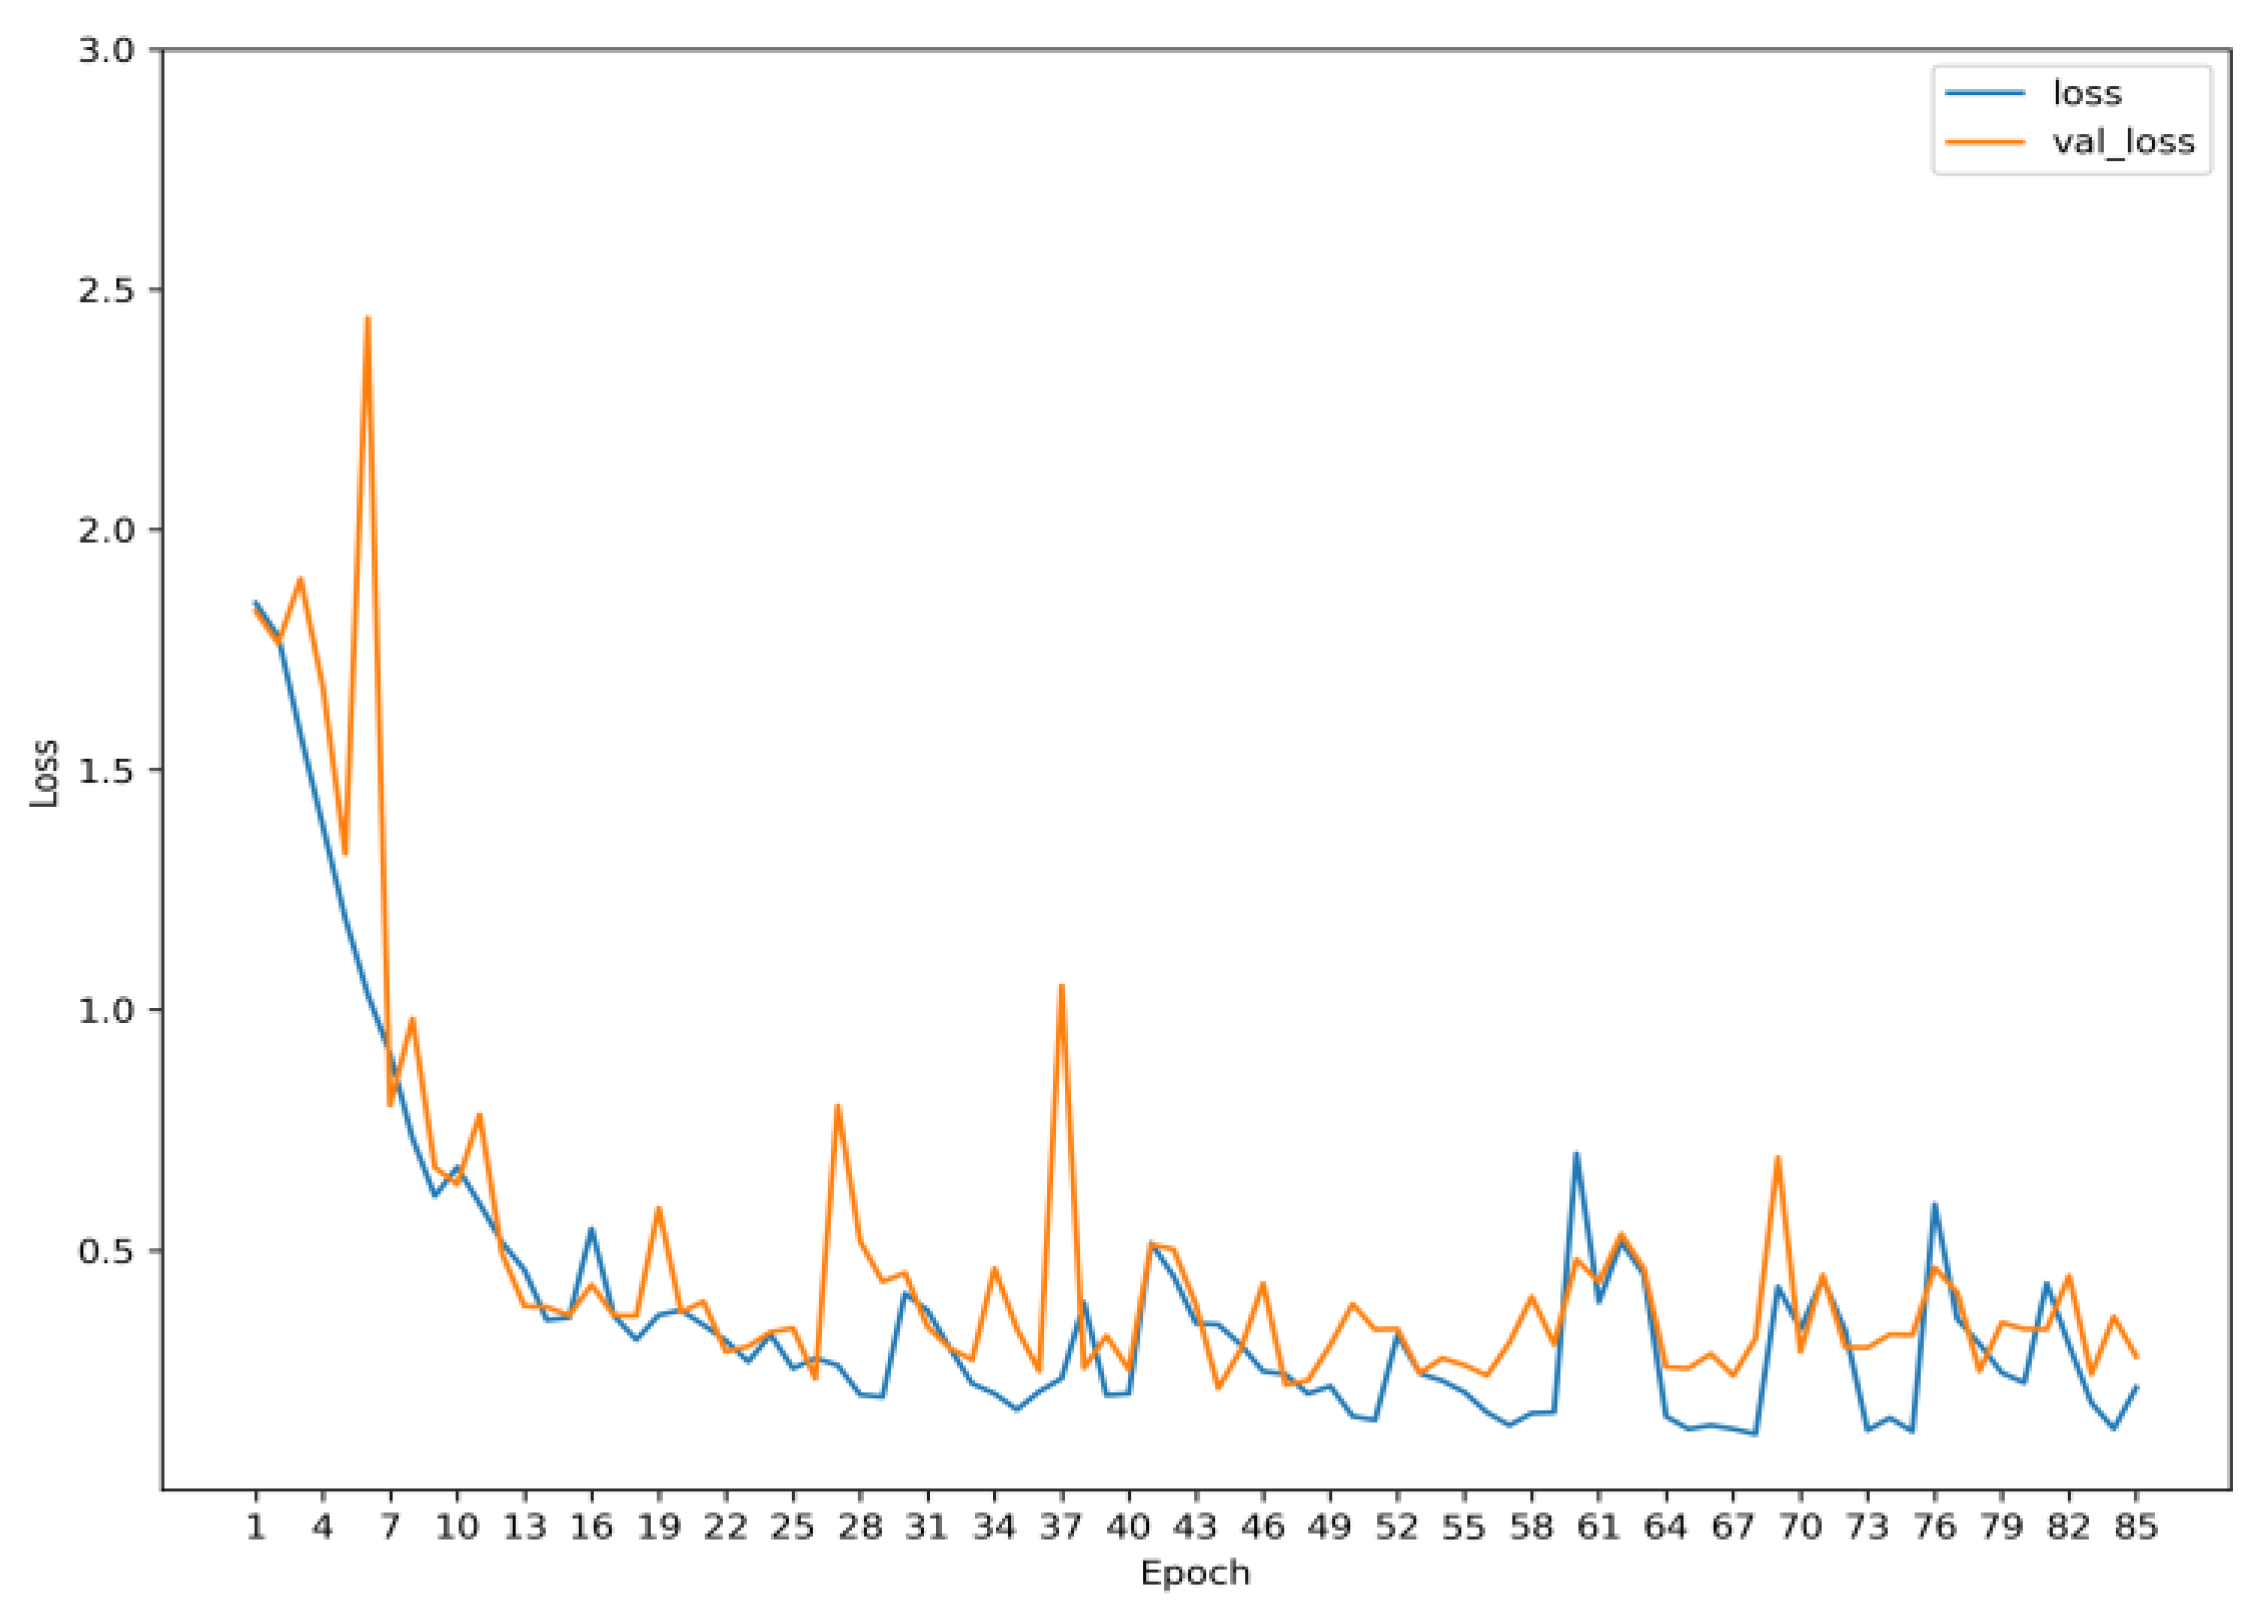
Due to the imbalanced nature of the dataset, this study goes beyond overall accuracy and analyzes the model’s performance in terms of per-class errors. To provide a more comprehensive evaluation, precision, recall, and F1-Score are employed for gauging the performance of the model for each individual class. Figure 2 displays the training versus validation loss graph, offering valuable information about how well the model performs on both the training and validation datasets. The graph demonstrates a balanced relationship between training loss and validation loss through multiple cycles of epochs, indicating that the model is not overfitting. In other words, it shows that the model is generalizing well to unseen data.
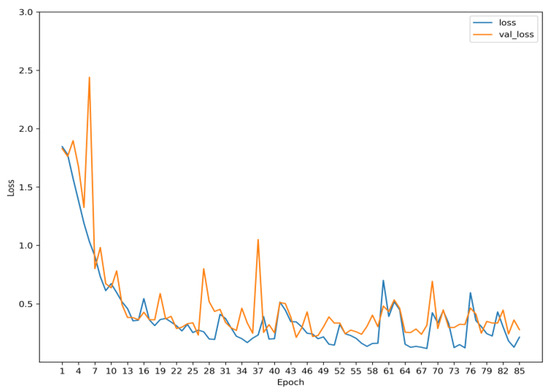
Figure 2.
Training vs. validation loss.
Table 4 presents the results for the evaluation metrics for the model that underwent training and subsequent testing.
Table 4.
Metrics results.
Upon analyzing the results, it is evident that the majority of classes showcase high precision, recall, and F1 scores, suggesting a remarkable performance by the model in terms of classification. However, class 4 (Lack of Shielding gas) displays comparatively lower precision and recall values, suggesting that the model struggles to correctly classify instances belonging to this particular class. This can be attributed to the limited number of instances available for this class in the dataset, resulting in the insufficient learning of its distinctive features by the model. Exploring approaches like data augmentation, gathering additional data, experimenting with different architectures, and implementing other techniques to handle class imbalance can help in achieving a more balanced dataset and equal emphasis on all classes.
4. Conclusions
This study focuses on developing a CNN-based model for weld classification, employing five convolution layers, followed by five pooling layers, and finally succeeded by three fully connected layers. This model aims to classify six different categories of welds, namely good weld, contamination, lack of shielding gas, lack of fusion, burn through, and high travel speed. Despite the slight limitation of class imbalance in the available dataset, the model performs well in the classification task. However, even with the inclusion of recall, precision, and F1-score, class 4′s performance is relatively lower compared to the other classes. This indicates the need for additional data to further enhance the model’s performance. Exploring approaches like data augmentation, gathering additional data, experimenting with different architectures, and implementing other techniques to handle class imbalance can help in achieving a more balanced dataset and equal emphasis on all classes. By incorporating these techniques, the CNN model can be further optimized to achieve higher accuracy and improved robustness in classifying weld defects.
Author Contributions
Conceptualization, R.G. and R.S.; methodology, R.G. and R.S.; software, R.G.; validation, R.G. and R.S.; formal analysis, R.G. and R.S.; investigation, R.G.; resources, R.G; data curation, R.G.; writing—original draft preparation, R.G.; writing—review and editing, R.G. and R.S.; supervision, R.S. All authors have read and agreed to the published version of the manuscript.
Funding
This research received no external funding.
Institutional Review Board Statement
Not applicable.
Informed Consent Statement
Not applicable.
Data Availability Statement
All the data used are made available in the present work.
Conflicts of Interest
The authors declare no conflicts of interest.
References
- Sen, R.; Choudhury, S.; Kumar, R.; Panda, A. A Comprehensive Review on the Feasibility Study of Metal Inert Gas Welding. Mater. Today Proc. 2018, 5, 17792–17801. [Google Scholar] [CrossRef]
- Ogbonna, O.S.; Akinlabi, S.A.; Madushele, N.; Mashinini, P.M.; Abioye, A.A. Application of MIG and TIG Welding in Automobile Industry. J. Phys. Conf. Ser. 2019, 1378, 042065. [Google Scholar] [CrossRef]
- Singh, S.S.; Khanna, P. A-TIG (activated flux tungsten inert gas) welding:—A review. Mater. Today Proc. 2021, 44, 808–820. [Google Scholar] [CrossRef]
- Gupta, M.K.; Khan, M.A.; Butola, R.; Singari, R.M. Advances in applications of Non-Destructive Testing (NDT): A review. Adv. Mater. Process. Technol. 2021, 8, 2286–2307. [Google Scholar] [CrossRef]
- Stavridis, J.C.; Papacharalampopoulos, A.; Stavropoulos, P. A cognitive approach for quality assessment in laser welding. Procedia CIRP 2018, 72, 1542–1547. [Google Scholar] [CrossRef]
- Pugliese, R.; Regondi, S.; Marini, R. Machine learning-based approach: Global trends, research directions, and regulatory standpoints. Data Sci. Manag. 2021, 4, 19–29. [Google Scholar] [CrossRef]
- Sarker, I.H. Machine Learning: Algorithms, Real-World Applications and Research Directions. SN Comput. Sci. 2021, 2, 160. [Google Scholar] [CrossRef] [PubMed]
- Reddy, N.S.; Cheruku, S. Application and performance of machine learning techniques in manufacturing sector from the past two decades: A review. Mater. Today Proc. 2021, 38, 2392–2401. [Google Scholar] [CrossRef]
- Albawi, S.; Mohammed, T.A.; Al-Zawi, S. Understanding of a convolutional neural network. In Proceedings of the 2017 International Conference on Engineering and Technology (ICET), Antalya, Turkey, 21–23 August 2017; pp. 1–6. [Google Scholar] [CrossRef]
- Gu, J.; Wang, Z.; Kuen, J.; Ma, L.; Shahroudy, A.; Shuai, B.; Liu, T.; Wang, X.; Wang, G.; Cai, J.; et al. Recent advances in convolutional neural networks. Pattern Recognit. 2018, 77, 354–377. [Google Scholar] [CrossRef]
- Zhang, Z.; Wen, G.; Chen, S. Weld image deep learning-based on-line defects detection using convolutional neural networks for Al alloy in robotic arc welding. J. Manuf. Process. 2019, 45, 208–216. [Google Scholar] [CrossRef]
- Bacioiu, D.; Melton, G.; Papaelias, M.; Shaw, R. Automated defect classification of SS304 TIG welding process using visible spectrum camera and machine learning. NDT E Int. 2019, 107, 102139. [Google Scholar] [CrossRef]
- Stephen, D.; Lalu, P.P. Development of Radiographic Image Classification System for Weld Defect Identification using Deep Learning Technique. Int. J. Sci. Eng. Res. 2021, 12, 390–394. [Google Scholar] [CrossRef]
- Kumaresan, S.; Aultrin, K.S.J.; Kumar, S.S.; Anand, M.D. Transfer Learning With CNN for Classification of Weld Defect. IEEE Access 2021, 9, 95097–95108. [Google Scholar] [CrossRef]
- Khumaidi, A.; Yuniarno, E.M.; Purnomo, M.H. Welding defect classification based on convolution neural network (CNN) and Gaussian kernel. In Proceedings of the 2017 International Seminar on Intelligent Technology and Its Applications (ISITIA), Surabaya, Indonesia, 28–29 August 2017; pp. 261–265. [Google Scholar] [CrossRef]
- Perri, S.; Spagnolo, F.; Frustaci, F.; Corsonello, P. Welding defects classification through a Convolutional Neural Network. Manuf. Lett. 2023, 35, 29–32. [Google Scholar] [CrossRef]
Disclaimer/Publisher’s Note: The statements, opinions and data contained in all publications are solely those of the individual author(s) and contributor(s) and not of MDPI and/or the editor(s). MDPI and/or the editor(s) disclaim responsibility for any injury to people or property resulting from any ideas, methods, instructions or products referred to in the content. |
© 2024 by the authors. Licensee MDPI, Basel, Switzerland. This article is an open access article distributed under the terms and conditions of the Creative Commons Attribution (CC BY) license (https://creativecommons.org/licenses/by/4.0/).