Proceeding Paper

Prediction of Machining Characteristics and Machining Performance for Grade 2 Titanium Material in a Wire Electric Discharge Machine Using Group Method of Data Handling and Artificial Neural Network †

by
Sudhir Jain Prathik
1,*,
Athimoolam Sundaramahalingam
1,
Maddur Eswara Nithyashree
2,
Addamani Rudreshi
3 and
Gonchikar Ugrasen
4
1
Department of Aeronautical Engineering, Dayananda Sagar College of Engineering, Bengaluru 560111, Karnataka, India
2
Business Fulfilment Team, Tata Consultancy Services, Bengaluru 560066, Karnataka, India
3
Department of Mechanical Engineering, PES College of Engineering, Mandya 571401, Karnataka, India
4
Department of Mechanical Engineering, BMS College of Engineering, Bengaluru 560019, Karnataka, India
*
Author to whom correspondence should be addressed.
Presented at the International Conference on Recent Advances on Science and Engineering, Dubai, United Arab Emirates, 4–5 October 2023.
Eng. Proc. 2023, 59(1), 9085; https://doi.org/10.3390/engproc2023059085
Published: 19 December 2023
(This article belongs to the Proceedings of Eng. Proc., 2023, RAiSE-2023)

Abstract

:
The present research focuses on the machining of grade 2 titanium material using the Wire Electric Discharge Machining (WEDM) process by means of L16 Orthogonal Array (OA). This study investigates numerous process parameters, including pulse on time, current, pulse off time, voltage, bed speed and flush rate. The voltage and flush rate were kept constant throughout the experiment, while the other four parameters were varied for the machining process. In this study, a 0.18 mm molybdenum wire was utilized as the electrode material. Initially, this research aimed to optimize the process parameters to discern their impact on machining characteristics (Surface Roughness and Electrode Wear) as well as on machining performance (Acoustic Emission Signals). Subsequently, simpler functional relationship plots were generated between these parameters to recognize the potential information about the machining characteristics and machining performance. The straightforward approach lacks the capability to furnish information regarding the condition of the material (Surface Roughness), the tool (Electrode Wear) and the signals (Acoustic Emission). Hence, to estimate the experimental values the numerical tools viz., Group Method of Data Handling (GMDH) and Artificial Neural Network (ANN) were used. Upon comparing the predictive performance of ANN and GMDH, it became evident that the ANN’s predictions using 70% of the data for training displayed a higher correlation with the experimental values compared to the GMDH.

1. Introduction

In the 1960s, the wire-cutting machine was created with the specific purpose of producing hardened steel tools (dies). In Wire Electrical Discharge Machining (WEDM), a wire serves as the tool electrode. To prevent the wire from eroding and breaking, it is wound between two spools, ensuring that the active portion of the wire is continuously replaced. WEDM is a specialized machining process used for cutting, shaping and machining hard materials, particularly metals that are difficult to machine using conventional methods. This machine has advantages like high precision, minimum electrode wear and excellent surface finish, etc. Grade 2 titanium finds extensive applications in various industrial components, including oil and gas components, reaction and pressure vessels, tubing or piping systems, heat exchangers, liners and flue-gas desulphurization systems [1]. Study of WED-machined Ni50.3-Ti34.7-Hf15 alloy, surface morphology was analyzed using SEM images, and a regression model was created to get the optimized input parameters corresponding to the best output results [2]. A linear regression model was established to find out the correlation between the input and output parameters while machining of super alloy Udimet-L605 in WEDM. L27 orthogonal array was employed to combine the parameters of the process [3]. Surface integrity, SR kerf size white layer and Metal Removal Rate (MRR) is an important parameter of Ti6Al4V material while machining in WEDM brass wire and zinc coated brass wire [4]. The Taguchi, Box–Behnken and RSM methods can be employed for the design of the experiments [5]. The aspects of corner accuracy are also essential in the WEDM in line with the MRR and SR. The angular error at the bottom is primarily affected by open voltage, on-time, wire feed and flushing pressure [6]. The key parameters that are most influencing on the MRR and SR was found to be peak current and pulse on time while machining in WEDM across various materials [7,8,9,10,11]. The fluctuations in AE counts, AE amplitude and AE energy concerning machining time are addressed. The results show that the production of AE signals is non-uniform and fluctuates in response to changes in feed rates and time [12]. The use of an ANN effectively facilitated in the prediction of the SR and AE signals. The neural network trained with 70% of the data in the training set demonstrated favorable prediction outcomes in contrast to the 50% and 60% data subsets, which exhibited lower R values [13]. The ANN, support vector machine and genetic algorithm were utilized to model and optimize the SR in WEDM. While the wire feed rate, servo voltage, peak current, pulse on time and pulse off time are among the process parameters. The optimal architecture for the ANN model was determined to be 5-10-10-1 [14].

2. Materials and Experimental Setup

2.1. Material Details

Grade 2 titanium is used in engine applications such as rotors, compressor blades, hydraulic system components and nacelles. Its application can also be found in critical jet engine rotating and airframe components in aircraft industries. The composition of grade 2 titanium is given in Table 1.

2.2. Experimental Details

The experimental trials were performed using the CONCORD DK7720C four axis CNC WED machine. The essential components of the WEDM apparatus include a wire, a working surface, a servo control setup, a power source and a system for supplying dielectric material. Within the CONCORD DK7720C, operators have the capability to select input parameters based on the material and dimensions of the workpiece, following the guidelines outlined in the WEDM manufacturer’s manual. Moreover, the CONCORD DK7720CWED machine boasts a variety of distinctive functionalities. In contrast to other WED machines, this particular apparatus employs reusable wire technology. The wire feed mechanism has been deployed in Figure 1.
The WEDM process generally consists of several stages, a rough-cut phase, a rough cut with finishing stage, and a finishing stage. But in this WED machine only one pass is used. Varying process parameters are viz., Pulse-on time (Pon), Pulse-off time (Poff), Current (C) and Bed Speed (BS). Throughout the course of the experiment, the flush rate and wire tension stayed constant. For this experimental run, a molybdenum wire with a 0.18 mm diameter was used. A computer-controlled positioning system ensures a consistent 0.02 mm gap between the wire and the workpiece. The L16 Design of Experiment (DOE) was employed in the present work for the machining of the grade-2 titanium material which is as shown in Table 2.

2.3. Acoustic Emission (AE)

Each material possesses stored elastic energy that is released in the form of stress waves when the material experiences fracture, phase transformation or plastic deformation. This category of occurrences is referred to as AE. Emission occurs as a sequence of impulsive energy packets, propagating as a spherical wave front which could be detected using exceptionally sensitive transducers placed on the material’s surface. These transducers of the electro-mechanical variety capture the mechanical wave, which is then transformed into an electrical signal. By analyzing these signals, data regarding the source responsible for the energy release can be extracted. The two distinct kinds of AE signals are burst signals and continuous signals.

2.4. Theoretical Estimation: Group Method of Data Handling (GMDH) and Artificial Neural Network (ANN)

One notable challenge associated with the application of regression analysis revolves around the necessity to establish functional design. The assumption of linearity is not universally valid, as a vast array of nonlinear functional forms exists. This challenge becomes particularly relevant when attempting to infer a dependent variable from measured factors. While certain measured variables are meant to be applied in these cases, the precise form of the relation and the relative significance of these variables remain uncertain. In situations like these, it’s prudent to leverage the available data to determine both the functional nature and the parameters of the function. This rationale underpins the development of modeling strategies like the GMDH.
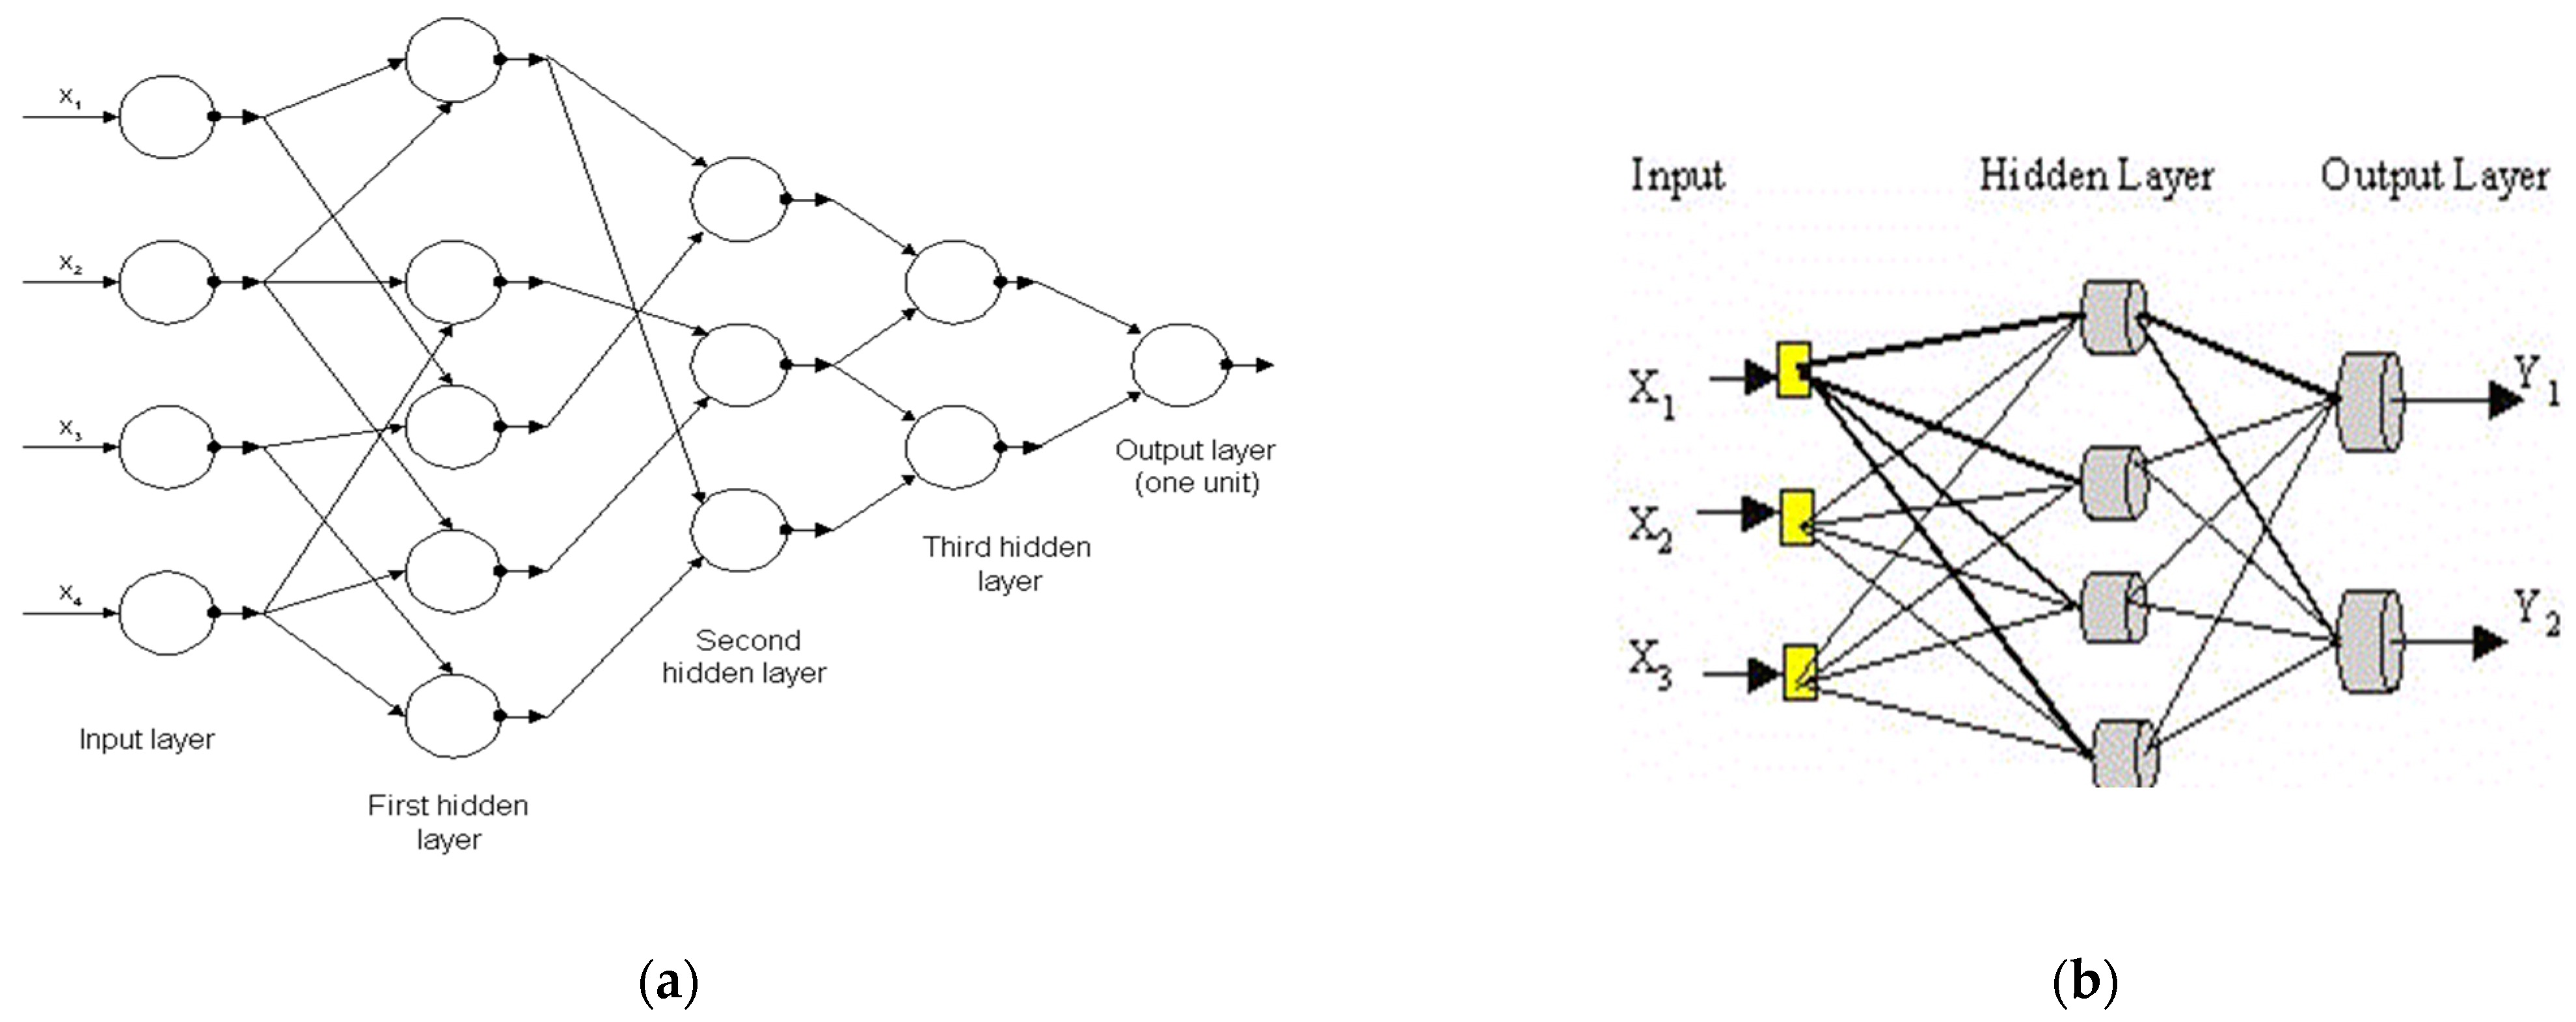
The non-linear and time-dependent nature of the machining process, conventional identification methods struggle to yield accurate models. In comparison to conventional computational techniques, ANNs offer robustness and global applicability. ANNs establish an implicit relationship between input and output by learning from a dataset that mirrors a system’s behaviour. Often referred to as a neural network, an ANN comprises interconnected artificial neurons that employ mathematical or computational models to process information, following a connectionist approach to computation. These ANNs consist of interlinked neurons that may share certain characteristics with biological neurons. The common type of ANN consists of 3 viz layers., an input layer, a hidden layer and an output layer. A stratum of input units is linked to a stratum of hidden units, which subsequently connects to a stratum of output units. Patterns are introduced to the network through the input stratum, which then communicates with one or multiple hidden strata. The processing itself transpires through a network of weighted connections within these hidden strata. Subsequently, the hidden strata are linked to an output stratum. A stratum, in this context, pertains to a collection of parallel neurons that operate independently from one another. The typical GMDH and ANN networks are shown in Figure 2a and Figure 2b, respectively.

3. Results and Discussion

The primary focus of this investigation lies in optimizing the process parameters to identify the most impactful factors that contribute to minimizing electrode erosion and SR during the machining of grade-2 Titanium material. The experimentation was carried out using Taguchi’s L16 orthogonal array design.

3.1. Selection of Response Parameter: AE Signals

A preliminary study was conducted as a pilot experiment to evaluate the feasibility of using AE signals as response parameters for characterizing machining performance. The study found that only the AE Signal Strength (AESS) and the AE Root Mean Square (AERMS) amplitude have a direct effect on the measured EW and SR (Ra). This means that as the machining characteristics increase, these AE signals also increase. Therefore, AESS and AERMS have been considered as response parameters for the EW and SR as stated by Yan Wang et al. (2017) [15]. Based on pilot experiments AESS, AERMS shows a remarkable similarity with the characteristic phases of measured EW and SR. Hence, these signals could be used for measuring machining performance in parametric optimization.

3.2. Parametric Influence on SR, EW and AE Signals on Grade-2 Titanium Material

Response plots, i.e., S/N ratio of the process parameters on SR, EW and AE signals (AESS and AERMS) for grade-2 titanium material is as shown in Figure 3a–d.
From the response plot, it can be noted that the most influential process parameter on the SR is Pon and C. This is because as the Pon increases, it generally upsurges surface irregularities due to which more melting and re-solidification of material takes place around the machined surface causing higher values of roughness [16,17]. As current increases a larger crater on the surface of the material is formed, causing the workpiece to have greater SR values [18,19]. It was also noted that the most influential parameters for the EW and AE signals were also Pon and C. Since as the current increases causes increase in spark energy resulting in higher wear. Further spark energy and the time required to transport this energy into the electrodes rises as the Pon increases, resulting in increased wear [20]. This spark energy also generates cracks in the material, which enhances the signal ratio as detected by the AE sensors. The plot also shows that there is not much influence of the Poff and BS on the SR, EW, AESS and AERMS. Table 3 shows the F-value and R-square value of the measured parameters.

3.3. Raw Data Analysis for Variation of Pulse on Time (Pon) and Current (C) to Know the Workpiece Status, Electrode Status and Machining Performance Status for Grade-2 Titanium Material

The refined process parameters were applied to machine grade-2 titanium materials by systematically adjusting Pon and C, while maintaining Poff and BS at a constant level. Initially, an attempt was made to obtain a clear insight of the machining parameters of WEDM viz., SR, EW and AE signals (AESS and AERMS) in relation to machining time. A comparison between the EW and material conditions was made against AESS and AERMS to understand their respective behaviour.
Arithmetic mean of surface deviation Ra, measured using stylus method has been adopted to ascertain the SR. The measurement of the electrode diameter was conducted prior to machining, while periodic measurements of electrode wear were undertaken to monitor the electrode’s condition. Figure 4a,b shows the effect of SR and EW against the machining time for the various Pon (16 µs, 20 µs, 24 µs, 28 µs) at constant Poff 4 µs, C 5 A and BS 25 µm/s.
The plots illustrate that as the duration of Pon rises, there’s a corresponding increase in SR and EW. This correlation stems from the larger Pon leading to greater discharge energy between the electrode and workpiece. Consequently, more material is melted, along with erosion of the wire resulting in the formation of a more substantial and deeper crater on the workpiece surface. Consequently, this escalation contributes to higher roughness values for the materials and a higher wear rate on the electrode materials also [21].
Figure 5a,b shows the effect of AESS and AERMS against machining time for the various C (3 A, 4 A, 5 A, 6 A) at a constant Pon of 20 µs, a Poff of 4 µs and a BS of 25 µm/s. Observation reveals that AESS and AERMS follow the same trend as the Ra and EW, i.e., a higher gradient of AESS and AERMS was found at a higher Pon and C. When the AE signals were compared, it showed that AERMS had a stronger connection with the EW and SR than the AESS for grade-2 titanium material. Also, more varied signals were observed in the minimum and maximum condition of Pon and C comparing to the medium condition. As a result, further theoretical estimation was limited to the minimum and maximum conditions of the Pon and C to know the status of machining characteristics and machining performance.

3.4. Theoretical Estimation of Machining Characteristics and Machining Performance Using the GMDH and ANN

3.4.1. Prediction of Minimum and Maximum Pulse on Time and Current for the EW and AERMS of Grade-2 Titanium Material Using the GMDH

Three measurement criteria, i.e., regularity, unbiased, and combined, were taken into account for machining estimation. The experimental dataset was divided into two subsets, one for training and one for testing. The training set was used to train the GMDH model so that it could learn the prediction process. In this study, the training set size was stipulated to be at least 50% of the whole dataset, with increments of 12.5% up to 75% considered. Therefore, training sets comprising 50%, 62.5% and 75% of the experimental data were utilized. The GMDH outcomes for both the minimum and maximum conditions of Pon and C were presented and analyzed. The study of the criteria was followed by the study of the percentage of training set for the obtained criteria. The study demonstrates that employing a 75% data in training set for the regularity criterion yielded the best correlation between measured and the predicted values for Ra, EW and AERMS.
The prediction of the EW at 75% of data in the training set for variation of the Pon (16 µs and 28 µs) at constant Poff (4 µs), C (5A) and BS (25 µm/s) is shown in Figure 6a. From the plots it can be also observed that at the maximum condition of Pon estimated value had better correlation with the measured value of the data at 75% in the training set of regularity criteria for the EW then the unbiased and combined criteria with least SE of 0.075. Figure 6b revels the prediction of AERMS at 75% of data in the training set for variation of the C (3 A and 6 A) at constant Pon (20 µs), Poff (4 µs) and BS (25 µm/s). Furthermore, it is observed that the lowest current estimated value exhibited a stronger correlation with the measured value. The plot indicates that when adhering to 75% of data in the training set of regularity criteria, the estimated values align closely with the measured AERMS values.

3.4.2. Prediction of Minimum and Maximum Pulse on Time and Current for the EW and AERMS of Grade-2 Titanium Material Using ANN

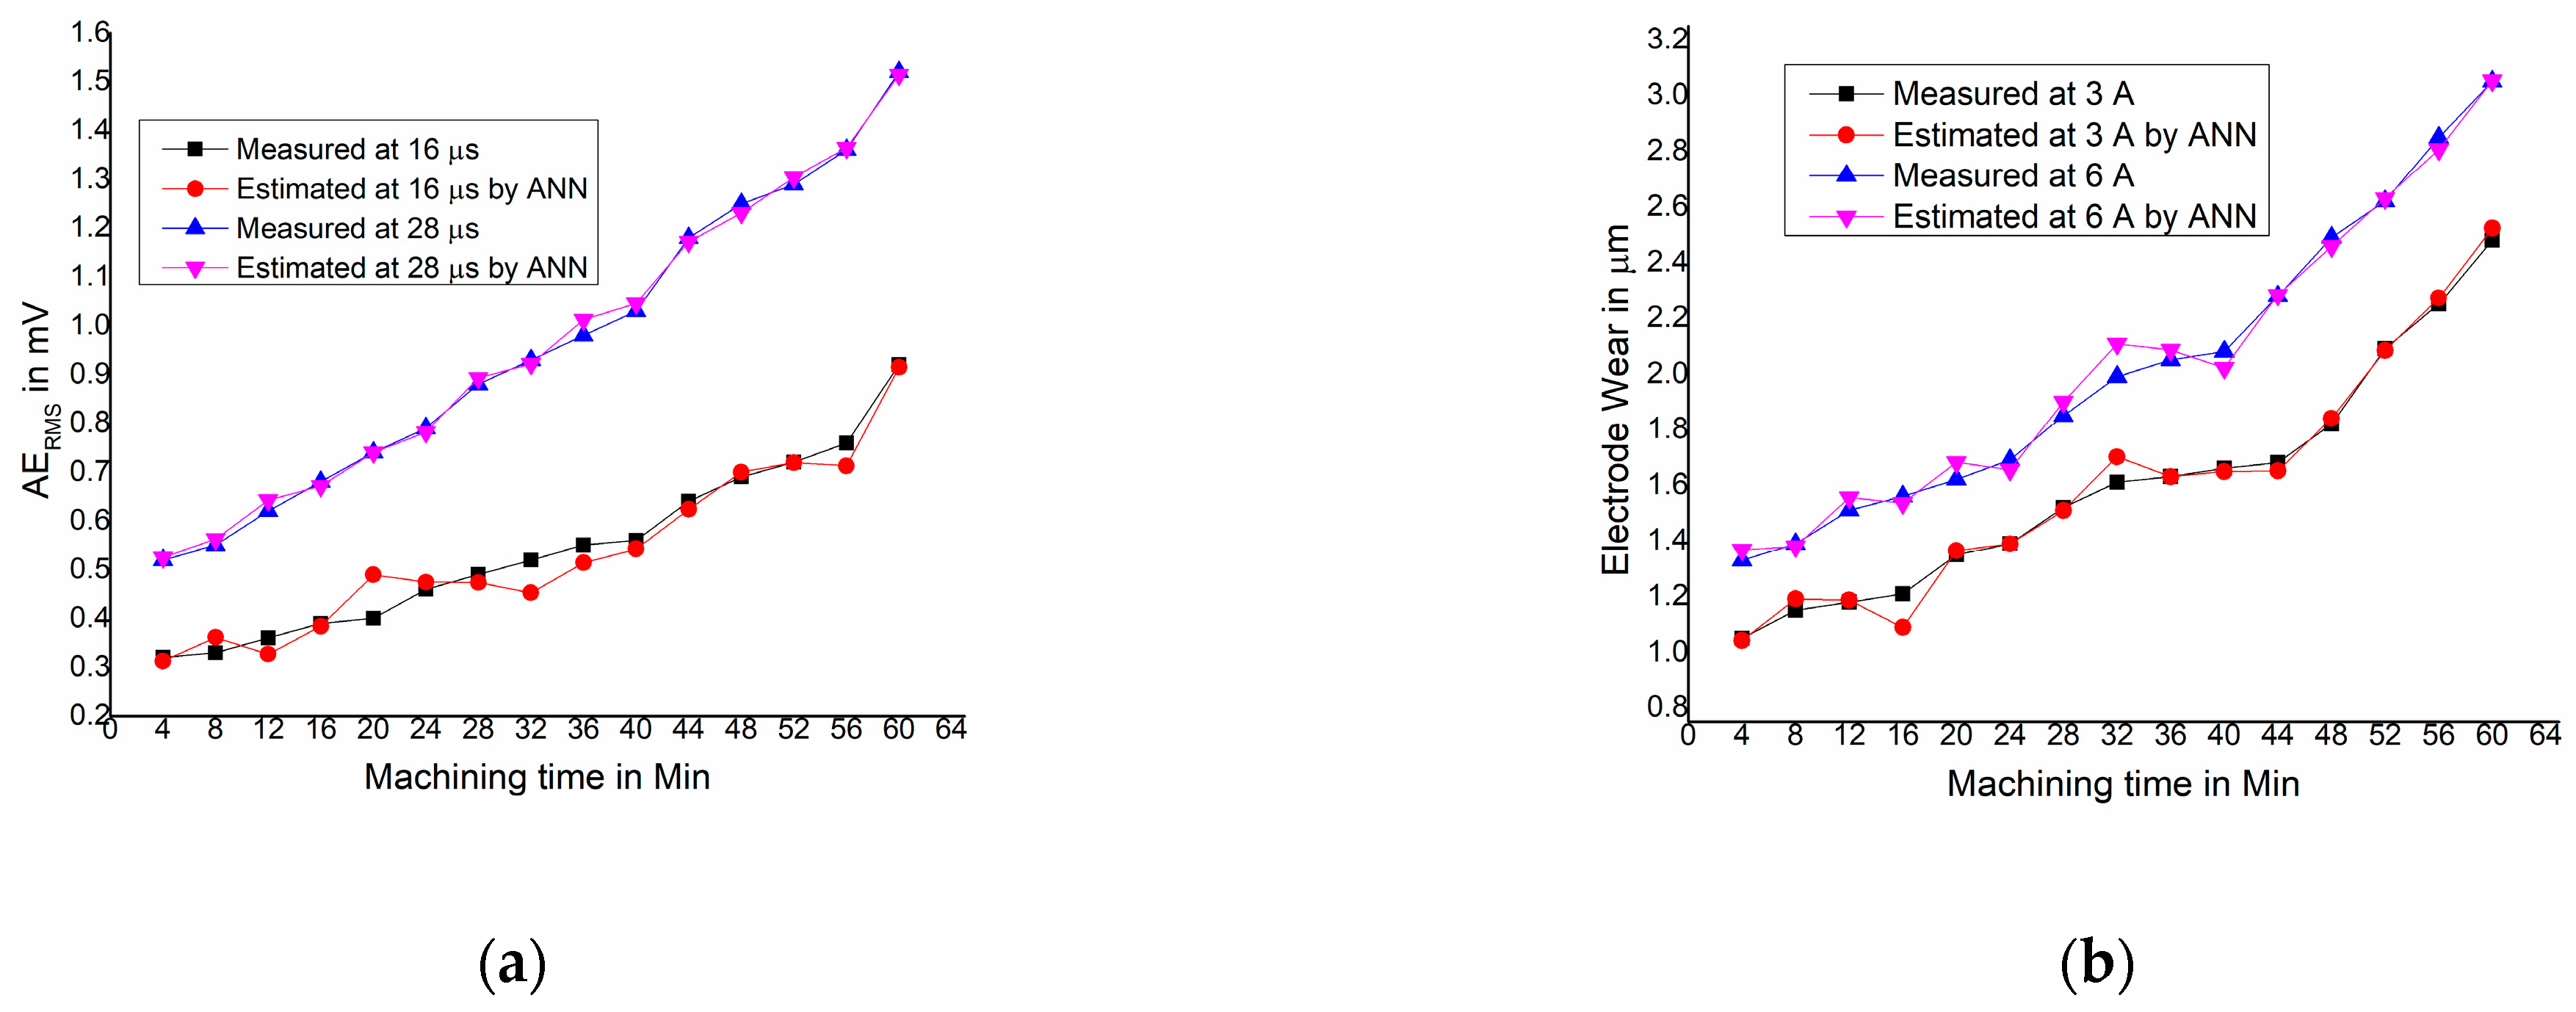
The designed neural networks were fed with experimental data to assist their training, validation and testing processes. The input neurons represent the analyzed characteristics, while the dependent variables encompass the SR, EW and AERMS. Independent variables, including the Pon, Poff, C and BS, were incorporated to enhance performance in scenarios involving multiple sensory inputs. The evaluation was conducted across different proportions of data training sets, specifically at 50%, 60% and 70%. Notably, the most optimal performance plot fitting was achieved when employing 70% of the data within the training set.
Figure 7a shows the prediction of the AERMS at 70% of data in the training set for variation of the Pon (16 µs and 28 µs) at constant Poff (4 µs), C (5A) and BS (25 µm/s).
It is also noticeable that under the highest Pon condition, the measured value and the estimated value have a strong correlation between, accompanied by the lowest Mean Squared Error (MSE).

3.5. Comparative Study of the GMDH and ANN Estimates for Grade-2 Titanium Material

Sensory methodologies are recognized as potent tools for effective monitoring ap-plications. Within this framework, a comparative study is performed between the computational approaches of the GMDH and ANNs, both utilized for estimating machining characteristics and overall machining performance. The results indicate that when considering 70% of the data for training, the estimations provided by ANN closely align with the measured values, surpassing the agreement achieved through the GMDH. ANN turns out to be a more effective means of estimation than the GMDH, primarily because of their inherent capability to accommodate non-linear interactions among variables. The anticipation was that non-linear functions would provide a more accurate representation of the dynamic relationships between economic indicators, resulting in improved precision and heightened sensitivity in generating forecasts.

4. Conclusions

The present study concentrated on machining grade-2 titanium material in WEDM utilizing a molybdenum wire. The experimental design followed Taguchi’s L16 array, with input process parameters encompassing Pon, Poff, C and BS. The optimization of process parameters revealed that Pon and C hold the highest influence over both machining characteristics and machining performance. An analysis of raw data concerning the machining time was conducted to explore the relationship between variations in Pon and C and their effects on machining characteristics and machining performance. Trends were established to facilitate a comparison between the machining characteristics and the machining performance parameters of the material. Greater values of the SR, EW, AESS and AERMS was found in higher Pon and C then in the lower condition. The optimized parameter data were the input into the mathematical models viz., the GMDH and ANN from which response data is extracted to ascertain the correlation between measured and estimated values. The prediction of the GMDH revealed that stronger correlation with the measured value was observed at higher percentages of the dataset, specifically at 75%, following the regularity criterion, accompanied by the lower SE. The ANN estimation model was constructed using training sets comprising 50%, 60% and 70% of the data. When employing four input parameters, it was determined that utilizing a single hidden layer with nine hidden neurons yielded a regression coefficient ‘R’ approaching one and minimized the MSE values. The optimal fit and strongest correlation with the measured values were achieved when training the ANN with 70% of the data. A comparative analysis of the mathematical models was also conducted. The results demonstrated that the estimations derived from ANN, employing 70% of the data in the training set, exhibited notable concurrence with the measured values, surpassing the agreements observed in comparison to the GMDH.

Author Contributions

Conceptualization, S.J.P.; methodology, S.J.P.; validation, A.R. and G.U.; formal analysis, A.S. and M.E.N.; investigation, S.J.P.; resources, A.R. and G.U.; data curation, S.J.P. and A.S.; writing—original draft preparation, S.J.P.; writing—review and editing, A.S. and M.E.N.; supervision, S.J.P.; project administration, A.R. and G.U. All authors have read and agreed to the published version of the manuscript.

Funding

This research received no external funding.

Institutional Review Board Statement

Not applicable.

Informed Consent Statement

Not applicable.

Data Availability Statement

Data are unavailable due to privacy.

Acknowledgments

The work reported in this paper is supported by P E S College of Engineering, through the Technical Education Quality Improvement Programme [TEQIP-II] of the MHRD, Government of India.

Conflicts of Interest

The authors declare no conflicts of interest.

References

  1. Sai, P.V.; Madhukar, S.; Reddy, M.K.P.; Ramachandra Rao, N.V.S. A review on machinability aspects of titanium grade-2. Int. J. Sci. Res. Sci. Eng. Technol. 2017, 3, 270–275. [Google Scholar]
  2. Rahul, V.; Balaji, V.; Narendranath, S. Optimization of wire-EDM process parameters for Ni-Ti-Hf shape memory alloy through particle swarm optimization and CNN-based SEM-image classification. Results Eng. 2023, 18, 101141. [Google Scholar] [CrossRef]
  3. Nain, S.S.; Garg, D.; Kumar, S. Investigation for obtaining the optimal solution for improving the performance of WEDM of super alloy Udimet-L605 using particle swarm optimization. Eng. Sci. Technol. Int. J. 2018, 21, 261–273. [Google Scholar] [CrossRef]
  4. Radhakrishnan, P.; Vijayaraghavan, L.; Ramesh Babu, N. Assessment of material removal capability with vibration-assisted wire electrical discharge machining. J. Manuf. Processes 2017, 26, 323–329. [Google Scholar] [CrossRef]
  5. Ukey, K.; Sahu, A.R.; Gajghate, S.S.; Behera, A.K.; Limbadri, C.; Majumder, H. Wire electrical discharge machining (WEDM) review on current optimization research trends. Mater. Today Proc. 2023, in press. [CrossRef]
  6. Ishfaq, K.; Zahoor, S.; Ali Khan, S.; Rehman, M.; Alfaify, A.; Anwar, S. Minimizing the corner errors (top and bottom) at optimized cutting rate and surface finish during WEDM of Al6061. Eng. Sci. Technol. Int. J. 2021, 24, 1027–1041. [Google Scholar] [CrossRef]
  7. Ram Prasad, A.V.S.; Ramji, K.; Datta, G.L. An experimental study of Wire-EDM on Ti-6Al-4V alloy. Procedia Mater. Sci. 2014, 5, 2567–2576. [Google Scholar] [CrossRef]
  8. Nourbakhsh, F.; Rajurkar, K.P.; Malshe, A.P.; Cao, J. Wire electro-discharge machining of titanium alloy. Procedia CIRP 2013, 5, 13–18. [Google Scholar] [CrossRef]
  9. Lal, S.; Kumar, S.; Khan, Z.A.; Siddiquee, A.N. An investigation on effects of wire electrical discharge machining parameters on surface roughness of newly developed hybrid metal matrix composite. J. Eng. Manuf. 2013, 228, 653–662. [Google Scholar] [CrossRef]
  10. Goyal, A. Investigation of material removal rate and surface roughness during wire electrical discharge machining (WEDM) of Inconel 625 super alloy by cryogenic treated tool electrode. J. King Saud Univ. Sci. 2017, 29, 528–535. [Google Scholar] [CrossRef]
  11. Sharma, N.; Khanna, R.; Gupta, R. Multi quality characteristics of WEDM process parameters with RSM. Procedia Eng. 2013, 64, 710–719. [Google Scholar] [CrossRef]
  12. Kumar, S.S.; Uthayakumar, M.; Kumaran, S.T.; Parameswaran, P.; Hannef, T.K.; Mukhopadhyay, C.K.; Pao, B.P.C. Performance Monitoring of WEDM Using Online Acoustic Emission Technique. Silicon 2018, 10, 2635–2642. [Google Scholar] [CrossRef]
  13. Prathik Jain, S.; Ravindra, H.V.; Ugrasen, G.; Naveen Prakash, G.V.; Rammohan, Y.S. Study of Surface Roughness and AE Signals while Machining Titanium Grade-2 Material using ANN in WEDM. Mater. Today Proc. 2017, 4, 9557–9560. [Google Scholar] [CrossRef]
  14. Paturi, U.M.R.; Cheruku, S.; Pasunuri, V.P.K.; Salike, S.; Reddy, N.S.; Srija, C. Machine learning and statistical approach in modeling and optimization of surface roughness in wire electrical discharge machining. Mach. Learn. Appl. 2021, 6, 100099. [Google Scholar] [CrossRef]
  15. Wang, Y.; He, D.; Yang, L.; Xiong, W. Formation mechanism of surface topography in low-speed wire electrical discharge machining Inconel 718 and its on-line prediction based on acoustic emission technology. Adv. Mech. Eng. 2017, 9, 1687814017694579. [Google Scholar] [CrossRef]
  16. Srinivasa Rao, P.; Ramji, K.; Satyanarayana, B. Experimental investigation and optimization of wire edm parameters for surface roughness, MRR and white layer in machining of aluminium alloy. Procedia Mater. Sci. 2014, 5, 2197–2206. [Google Scholar] [CrossRef]
  17. Gaitonde, V.N.; Manjaiah, M.; Maradi, S.; Karnik, S.R.; Petkar, P.M.; Paulo Davim, J. 7-Multiresponse optimization in wire electric discharge machining (WEDM) of HCHCr steel by integrating response surface methodology (RSM) with differential evolution (DE). In Computational Methods and Production Engineering; Woodhead Publishing: Cambridge, UK, 2017; pp. 199–221. [Google Scholar] [CrossRef]
  18. Lodhi, B.K.; Agarwal, S. Optimization of machining parameters in WEDM of AISI D3 steel using taguchi technique. Procedia CIRP 2014, 14, 194–199. [Google Scholar] [CrossRef]
  19. Khan, A.A.; Ali MB, M.; Shaffiar NB, M. Relationship of surface roughness with current & voltage during wire EDM. J. Appl. Sci. 2006, 6, 2317–2320. [Google Scholar] [CrossRef]
  20. Reddy, V.V.; Krishna, P.V.; Kumar, B.S.; Shashidhar, M. Optimization of process parameters during EDM of Stainless Steel 304 using taguchi method. Int. J. Eng. Trends Technol. 2016, 31, 106–114. [Google Scholar] [CrossRef]
  21. Goyal, A.; Pandey, A.; Sharma, P. Investigation of surface roughness for Inconel 625 using wire electric discharge machining. IOP Conf. Ser. Mater. Sci. Eng. 2018, 377, 012109. [Google Scholar] [CrossRef]
Figure 1. The wire feeding principle.
Engproc 59 09085 g001
Figure 2. Typical examples of the estimation techniques (a) GMDH; (b) ANN.
Engproc 59 09085 g002
Figure 3. Response plot for (a) SR; (b) EW; (c) AESS; and (d) AERMS.
Engproc 59 09085 g003
Figure 4. Raw data analysis against the time for variation of Pon for (a) Ra and (b) EW.
Engproc 59 09085 g004
Figure 5. Raw data analysis against the time for variation of C for (a) AESS and (b) AERMS.
Engproc 59 09085 g005
Figure 6. Measured and predicted by the GMDH (a) EW; (b) AERMS.
Engproc 59 09085 g006
Figure 7. Measured and predicted by ANN (a) AERMS and (b) EW.
Engproc 59 09085 g007
Table 1. Composition of grade 2 titanium material.
S. No.Particular% of Composition
1C0.1
2Fe0.3
3H0.015
4N0.03
5O0.25
6Ti99.2
Table 2. L16 design of experiment.
S. No. PonPoffCBS
1164320
2166425
2168530
41610635
5204430
6206335
7208620
82010525
9244535
10246630
11248325
122410420
13284625
14286520
15288435
162810330
Table 3. F-value and R-square value of the measured parameters.
ParameterSREWAESSAERMS
Optimized ValueF-ValueOptimized ValueF-ValueOptimized ValueF-ValueOptimized ValueF-Value
Pulse on time (µs)2012.512018.391654.392010.10
Pulse off time (µs)44.4943.69414.1083.33
Current (Amps)46.2749.17521.4845.57
Bedspeed (µm/s)302.52252.88252.23352.12
R-Square Value95.91%96.31%99.36%93.66%
Disclaimer/Publisher’s Note: The statements, opinions and data contained in all publications are solely those of the individual author(s) and contributor(s) and not of MDPI and/or the editor(s). MDPI and/or the editor(s) disclaim responsibility for any injury to people or property resulting from any ideas, methods, instructions or products referred to in the content.