
Optimization of Performance and Emission Parameters of Biodiesel with Additives Using Taguchi and Grey Relational Analysis †


Abstract
:1. Introduction
2. Materials and Methods
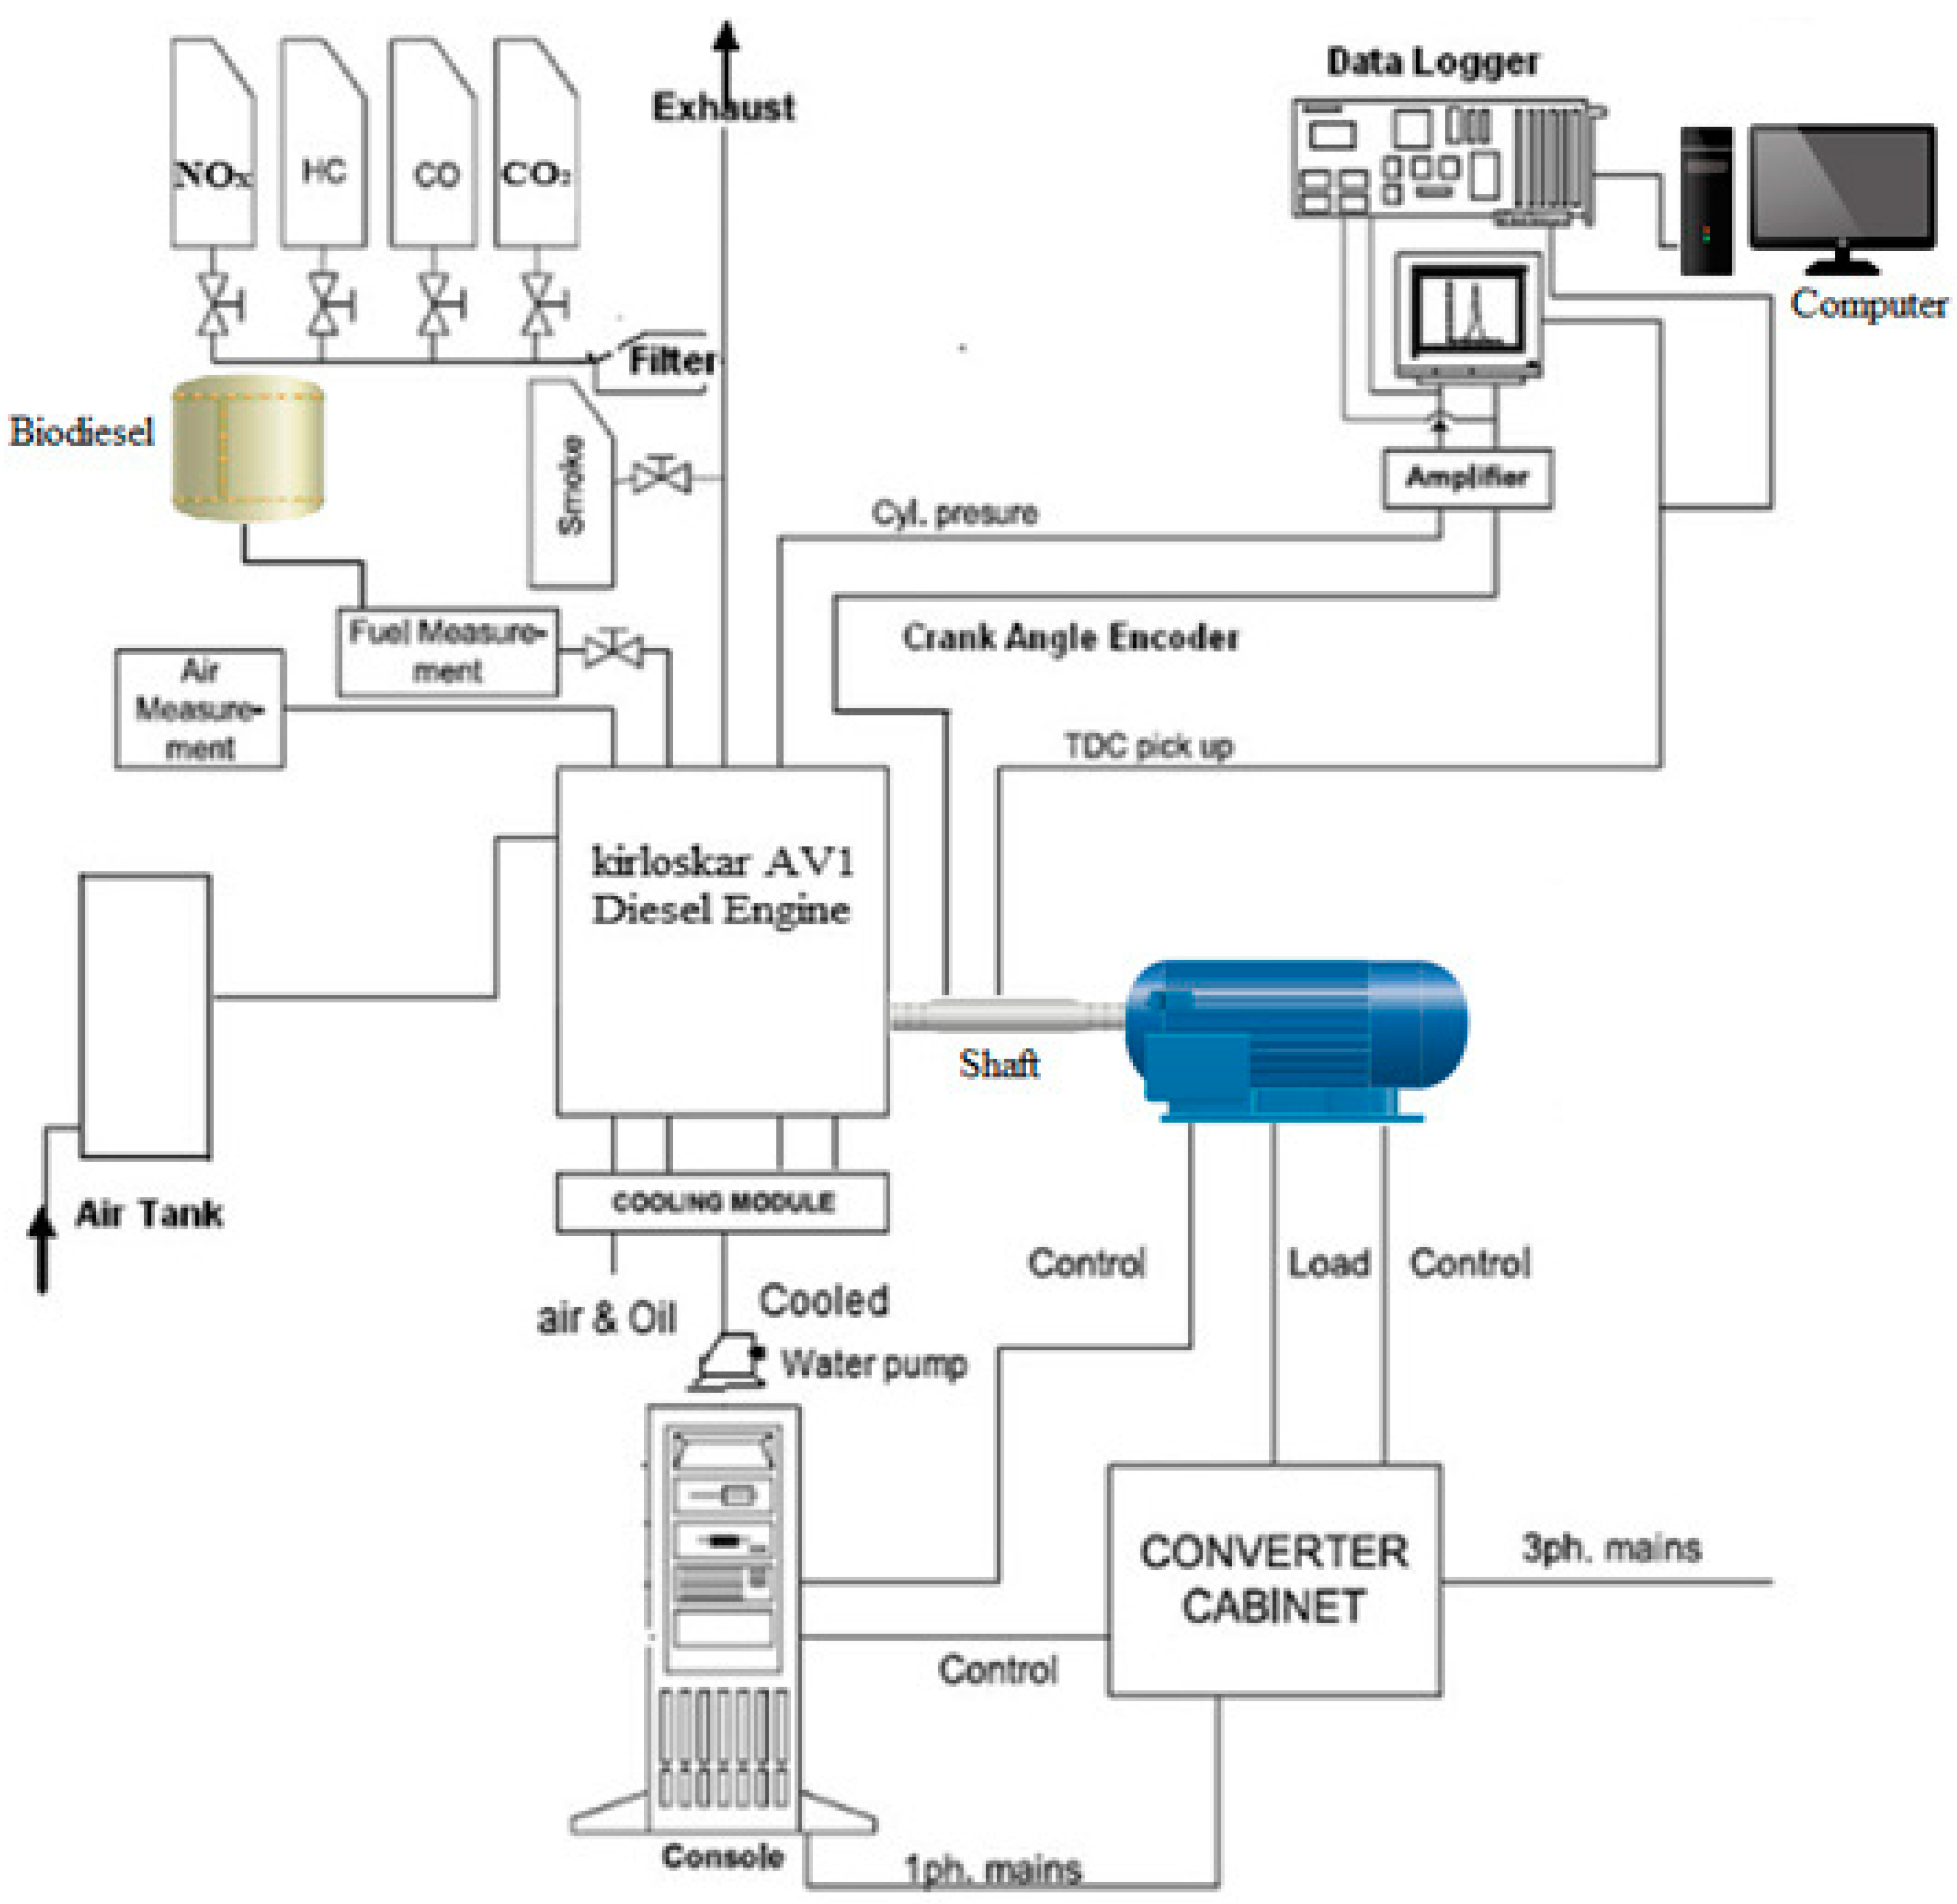
Experimental Setup
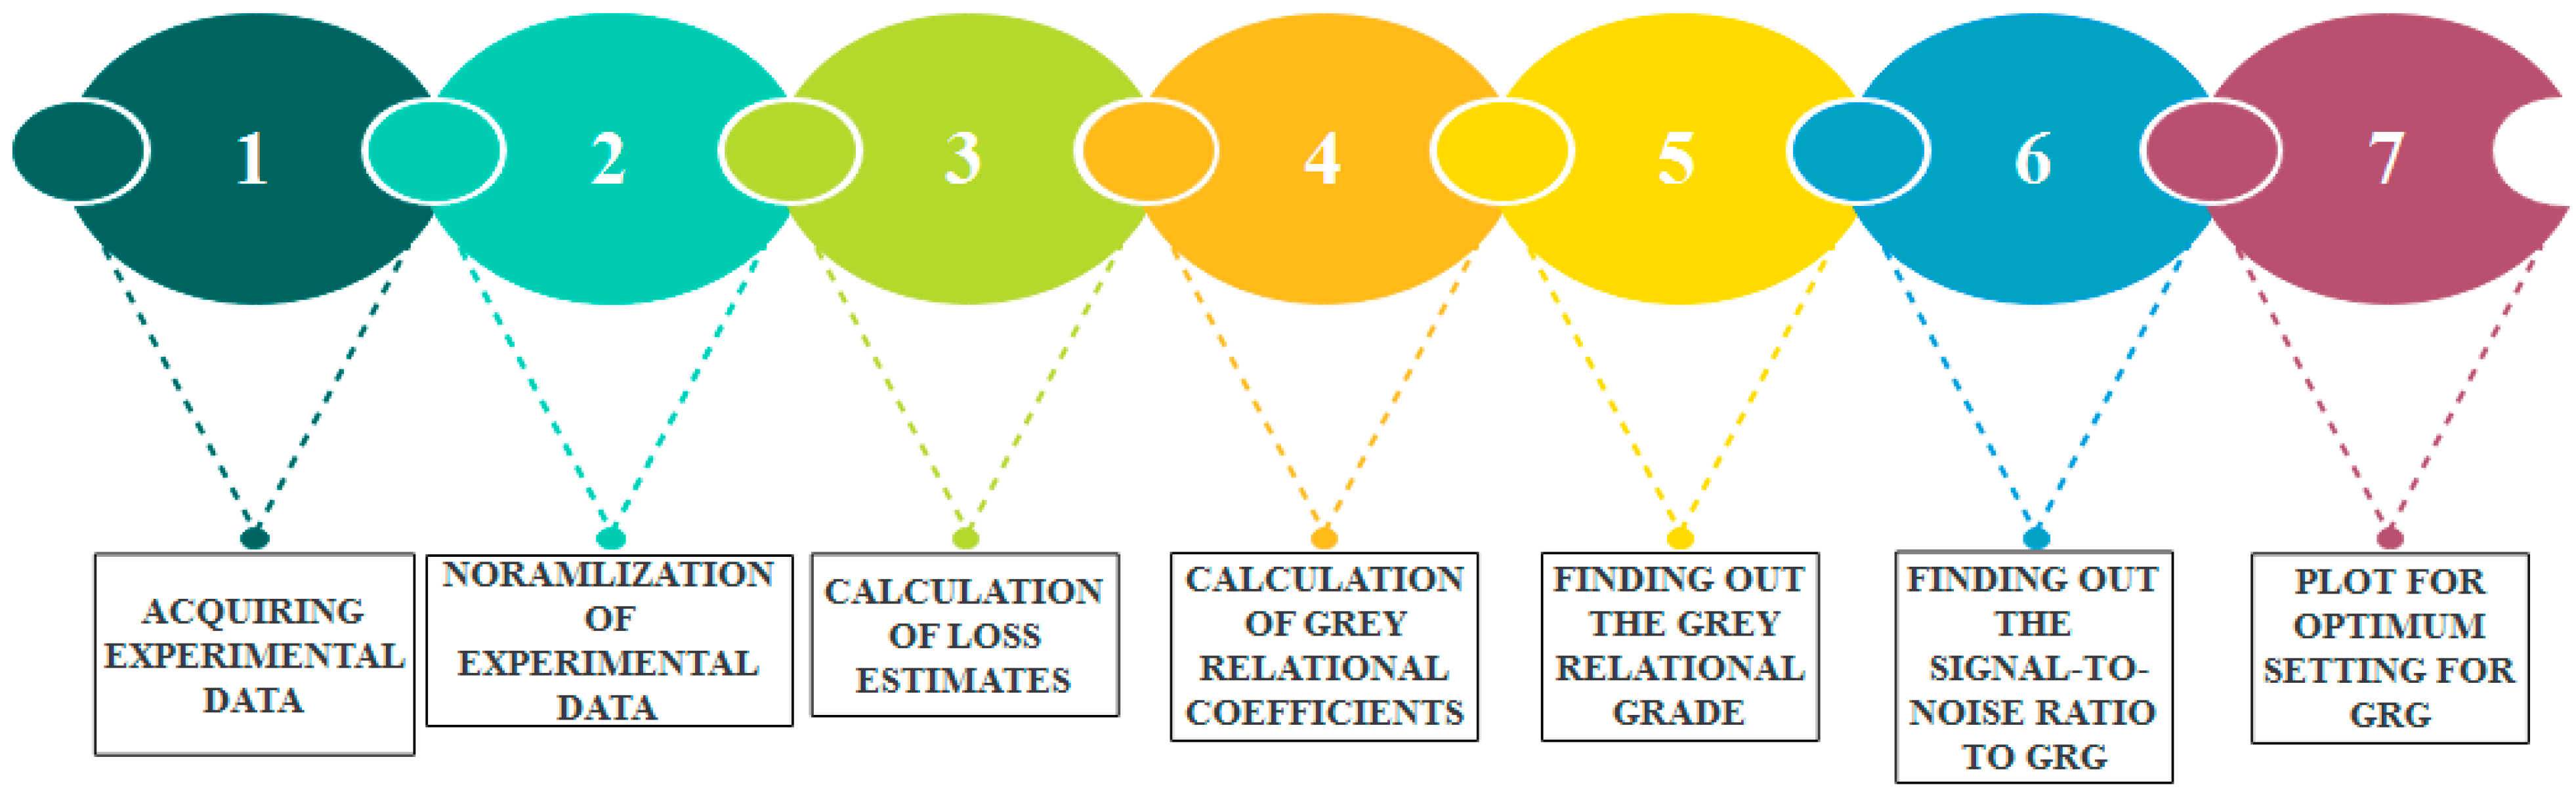
3. Methodology
3.1. Taguchi Analysis
3.2. Estimates of Quality Loss
3.3. Calculation of the Grey Relation Coefficient
3.4. Calculation of the Grey Relational Grade
4. Results and Discussion
Author Contributions
Funding
Institutional Review Board Statement
Informed Consent Statement
Data Availability Statement
Conflicts of Interest
References
- Kavitha, K.R.; Beemkumar, N.; Rajasekar, R. Experimental investigation of diesel engine performance fuelled with the blends of Jatropha curcas, ethanol, and diesel. Environ. Sci. Pollut. Control Ser. 2019, 26, 8633–8639. [Google Scholar] [CrossRef] [PubMed]
- Khan, H.; Kareemullah, M.; Ravi, H.C.; Rehman, K.F.; Kumar, R.H.; Afzal, A.; Soudagar, M.E.M.; Fayaz, H. Combined effect of synthesized waste milk scum oil methyl ester and ethanol fuel blend on the diesel engine characteristics. J. Inst. Eng. Ser. C. 2020, 101, 947–962. [Google Scholar] [CrossRef]
- Salvi, B.L.; Panwar, N.L. Biodiesel resources and production technologies a review. Renew. Sustain. Energy Rev. 2012, 16, 3680–3689. [Google Scholar] [CrossRef]
- Atgur, V.; Manavendra, G.; Desai, G.P.; Rao, B.N.; Fattah, I.M.R.; Mohamed, B.A.; Sinaga, N.; Masjuki, H.H. Thermogravimetric and combustion efficiency analysis of Jatropha curcas biodiesel and its derivatives. Biofuels 2022, 13, 1069–1079. [Google Scholar] [CrossRef]
- Venu, H.; Raju, V.D.; Subramani, L. Combined effect of influence of nano additives, combustion chamber geometry and injection timing in a DI diesel engine fuelled with ternary (Diesel-Biodiesel-Ethanol) blends. Energy 2019, 174, 386–406. [Google Scholar] [CrossRef]
- Bukkarapu, K.R. Comparative study of different biodiesel–diesel blends. Int. J. Ambient Energy. 2019, 40, 295–303. [Google Scholar] [CrossRef]
- Nwafor, O.M.I.; Rice, G. Performance of rape seed oil blends in a diesel engine. Appl. Energy 1996, 54, 345–354. [Google Scholar] [CrossRef]
- Sapaun, S.M.; Masjuki, H.H.; Azlan, A. The use of palm oil as diesel fuel substitute. J. Power Energy—Part A. 1996, 210, 47–53. [Google Scholar] [CrossRef]
- Murayama, T.; Oh, Y.-T.; Miyamoto, N.; Chikahisa, T.; Takagi, N. Low carbon flower build up, low smoke and efficient diesel operation with vegetable oils by conversion to monoesters and blending with diesel oil or alcohols. SAE Pap. 1984, 93, 292–302. [Google Scholar]
- Ali, Y.; Hanna Milford, A.; Borg Joseph, E. Optimization of diesel. Methyl tallowate and ethanol blend for reducing emissions from diesel engine. Bioresour. Technol. 1995, 52, 237–243. [Google Scholar] [CrossRef]
- Manigandan, S.; Gunasekar, P.; Devipriya, J.; Nithya, S. Emission and injection characteristics of corn biodiesel blends in diesel engine. Fuel 2019, 235, 723–735. [Google Scholar] [CrossRef]
- Usta, N.; Can, Ö.; Özgtürk, E. Comparison of biodiesel and ethanol as alternative diesel engine fuel, Pamukkale University Faculty of Engineering. J. Eng. Sci. 2005, 11, 325–334. [Google Scholar]
- Ayhan, V.; Tunca, S. Experimental investigation on using emulsified fuels with different biofuel additives in a DI diesel engine for performance and emissions. Appl. Therm. Eng. 2018, 129, 841–854. [Google Scholar] [CrossRef]
- Nieman, D.E.; Dempsey, A.B.; Reitz, R.D. Heavy-duty RCCI operation using natural gas and diesel. SAE Int. J. Engines 2012, 5, 270–285. [Google Scholar] [CrossRef]
- Aransiol, E.F.; Ojumu, T.V.; Oyekola, O.; Madzimbamuto, T.F.; Ikhu-Omoregbe, D. A review of current technology for biodiesel production: State of the art. Biomass Bioenergy. 2013, 61, 276–297. [Google Scholar] [CrossRef]
- Pali, H.S.; Kumar, N. Combustion, performance, and emissions of Shorea robusta methyl ester blends in a Diesel Engine. Biofuels. 2016, 7, 447–456. [Google Scholar] [CrossRef]
- Jadhav, S.D.; Tandale, M.S. Part load and full load multi-objective performance optimization of a single-cylinder diesel engine operating on Mangifera indica biodiesel as biofuel. Biofuels. 2016, 9, 29–44. [Google Scholar] [CrossRef]
- Yadav, H.C.; Jain, R.; Singh, A.R. Kano integrated robust design approach for aesthetical product design: A case study of a car profile. J. Intell. Manuf. 2017, 28, 1709–1727. [Google Scholar] [CrossRef]
- Venkatanarayana, B.; Ratnam, C. Selection of optimal performance parameters of DI diesel engine using the Taguchi approach. Biofuels. 2019, 10, 503–510. [Google Scholar] [CrossRef]
- Muqeem, M.; Sherwani, A.F.; Ahmad, M.; Khan, Z.A. Optimization of diesel engine input parameters for reducing hydrocarbon emission and smoke opacity using Taguchi method and analysis of variance. Energy Environ. 2018, 29, 410–431. [Google Scholar] [CrossRef]
- Rao, K.P.; Rao, B.A. Parametric optimization for performance and emissions of an IDI engine with Mahua biodiesel. Egypt. J. Pet. 2017, 26, 733–743. [Google Scholar]
- Yessian, S.; Varthanan, P.A. Optimization of Performance and Emission Characteristics of Catalytic Coated IC Engine with Biodiesel Using Grey-Taguchi Method. Sci Rep. 2020, 10, 2129. [Google Scholar] [CrossRef] [PubMed]
- Ramakrishnan, C.; Devan, P.K.; Karthikeyan, R. Experimental study on the performance and emission characteristics of jojoba oil fueled DICI engine. Environ. Prog. Sustain. Energy. 2017, 36, 248–258. [Google Scholar] [CrossRef]
- Besterfield, D.H. Taguchi’s quality management. In Total Quality Management; Prentice Hall: Hoboken, NJ, USA, 1999. [Google Scholar]
- Win, Z.; Gakkhar, R.P.; Jain, S.C.; Bhattacharya, M. Investigation of diesel engine operating and injection system parameters for low noise, emissions, and fuel consumption using Taguchi methods. Proc. Inst. Mech. Eng. Part D J. Automob. Eng. 2005, 219, 1237–1251. [Google Scholar] [CrossRef]

| Engine Model AV1, | kirloskar make |
|---|---|
| Rated Horse power: | 5 hp (3.73 kW) |
| Rated Speed: | 1500 rpm |
| No of Strokes: | 4 |
| Mode of Injection and injection pressure | Direct Injection, 200 kg/cm2 |
| No of Cylinders: | 1 |
| Stroke | 110 mm |
| Bore | 80 mm |
| Compression ratio | 16.5 |
| Experiment No | Fuel Blend | Load (kg) | (egt)∆oi | (bsfc)∆oi | (bth)∆oi | (hc)∆oi | (co)∆oi | (co2)∆oi | (o2)∆oi | (nox)∆oi | (smoke) ∆oi |
|---|---|---|---|---|---|---|---|---|---|---|---|
| 1 | D | 0 | 0.054878 | 0 | 1 | 0.051724 | 0.9 | 0.084337 | 0.872727 | 0.037418 | 0 |
| 2 | PME | 0 | 0.04878 | 0 | 1 | 0.12069 | 1 | 0.072289 | 0.036364 | 0.031805 | 0.333333 |
| 3 | PME+5%DEE | 0 | 0.042683 | 0 | 1 | 0.060345 | 0.6 | 0.012048 | 0.872727 | 0.027128 | 0.428571 |
| 4 | PME+10%DEE | 0 | 0.02439 | 0 | 1 | 0.077586 | 0.4 | 0 | 0.6 | 0.01029 | 0.142857 |
| 5 | PME+15%DEE | 0 | 0 | 0 | 1 | 0.258621 | 0.4 | 0.012048 | 0.909091 | 0 | 0.238095 |
| 6 | D | 10 | 0.140244 | 0.801847 | 0.483652 | 0.189655 | 0.8 | 0.204819 | 0.963636 | 0.12348 | 0.142857 |
| 7 | PME | 10 | 0.134146 | 0.881425 | 0.433093 | 0.137931 | 1 | 0.156627 | 0 | 0.080449 | 0.380952 |
| 8 | PME+5%DEE | 10 | 0.146341 | 0.931664 | 0.471138 | 0 | 0.2 | 0.180723 | 0.854545 | 0.09261 | 0.52381 |
| 9 | PME+10%DEE | 10 | 0.140244 | 0.958158 | 0.449482 | 0.25 | 0.3 | 0.156627 | 0.872727 | 0.079514 | 0.428571 |
| 10 | PME+15%DEE | 10 | 0.115854 | 0.999938 | 0.504883 | 0.327586 | 0.2 | 0.180723 | 0.854545 | 0.064546 | 0.285714 |
| 11 | D | 20 | 0.317073 | 0.559358 | 0.258898 | 0.284483 | 0.6 | 0.433735 | 0.054545 | 0.4116 | 0.238095 |
| 12 | PME | 20 | 0.335366 | 0.609671 | 0.197414 | 0.198276 | 0.9 | 0.385542 | 0.090909 | 0.289055 | 0.47619 |
| 13 | PME+5%DEE | 20 | 0.341463 | 0.617779 | 0.184161 | 0.043103 | 0.2 | 0.361446 | 0.890909 | 0.282507 | 0.47619 |
| 14 | PME+10%DEE | 20 | 0.329268 | 0.621688 | 0.189036 | 0.362069 | 0.2 | 0.373494 | 0.6 | 0.302152 | 0.285714 |
| 15 | PME+15%DEE | 20 | 0.341463 | 0.628514 | 0.201904 | 0.456897 | 0.2 | 0.39759 | 0.927273 | 0.305893 | 0.142857 |
| 16 | D | 30 | 0.676829 | 0.502384 | 0.135801 | 0.327586 | 0.5 | 0.674699 | 0.109091 | 0.719364 | 0.47619 |
| 17 | PME | 30 | 0.554878 | 0.535399 | 0.076308 | 0.258621 | 0.6 | 0.650602 | 0.145455 | 0.669785 | 0.238095 |
| 18 | PME+5%DEE | 30 | 0.554878 | 0.537426 | 0.080593 | 0.12931 | 0.1 | 0.638554 | 0.927273 | 0.697848 | 0.666667 |
| 19 | PME+10%DEE | 30 | 0.560976 | 0.530476 | 0.076198 | 0.474138 | 0.1 | 0.650602 | 0 | 0.724041 | 0.619048 |
| 20 | PME+15%DEE | 30 | 0.609756 | 0.537851 | 0.066151 | 0.551724 | 0.2 | 0.674699 | 0.981818 | 0.633302 | 0.238095 |
| 21 | D | 40 | 1 | 0.431803 | 0.04628 | 0.637931 | 0.9 | 1 | 0.018182 | 0.919551 | 0.952381 |
| 22 | PME | 40 | 0.853659 | 0.491965 | 0.003497 | 0.715517 | 0.8 | 0.951807 | 0.054545 | 0.951356 | 1 |
| 23 | PME+5%DEE | 40 | 0.993902 | 0.52121 | 0.042473 | 0.508621 | 0.2 | 0.963855 | 0.927273 | 1 | 0.904762 |
| 24 | PME+10%DEE | 40 | 0.926829 | 0.508759 | 0.000185 | 0.922414 | 0.2 | 0.939759 | 0.072727 | 0.988775 | 0.857143 |
| 25 | PME+15%DEE | 40 | 0.902439 | 0.529429 | 0.063518 | 1 | 0 | 0.975904 | 1 | 0.967259 | 0.47619 |
| Response | Weighting Factors |
|---|---|
| EGT | 0.045 |
| BSFC | 0.181 |
| BTHE | 0.227 |
| HC | 0.045 |
| CO | 0.181 |
| CO2 | 0.045 |
| O2 | 0.181 |
| NOX | 0.045 |
| SMOKE | 0.045 |
| Exp No | Fuel Blend | Load | ξ(egt) | ξ(bsfc) | ξ(bthe) | ξ(hc) | ξ(co) | ξ(co2) | ξ(o2) | ξ(nox) | ξ(smoke) | grg |
|---|---|---|---|---|---|---|---|---|---|---|---|---|
| 1 | D | 0 | 0.901099 | 1 | 0.333333 | 0.90625 | 0.357143 | 0.85567 | 0.364238 | 0.930374 | 1 | 0.597221 |
| 2 | PME | 0 | 0.911111 | 1 | 0.333333 | 0.805556 | 0.333333 | 0.873684 | 0.932203 | 0.940193 | 0.6 | 0.675135 |
| 3 | PME+5%DEE | 0 | 0.921348 | 1 | 0.333333 | 0.892308 | 0.454545 | 0.976471 | 0.364238 | 0.948536 | 0.538462 | 0.60057 |
| 4 | PME+10%DEE | 0 | 0.953488 | 1 | 0.333333 | 0.865672 | 0.555556 | 1 | 0.454545 | 0.979835 | 0.777778 | 0.648955 |
| 5 | PME+15%DEE | 0 | 1 | 1 | 0.333333 | 0.659091 | 0.555556 | 0.976471 | 0.354839 | 1 | 0.677419 | 0.618852 |
| 6 | D | 10 | 0.780952 | 0.38407 | 0.50831 | 0.725 | 0.384615 | 0.709402 | 0.341615 | 0.80195 | 0.777778 | 0.489637 |
| 7 | PME | 10 | 0.788462 | 0.361945 | 0.535852 | 0.783784 | 0.333333 | 0.761468 | 1 | 0.861402 | 0.567568 | 0.600773 |
| 8 | PME+5%DEE | 10 | 0.773585 | 0.349244 | 0.51486 | 1 | 0.714286 | 0.734513 | 0.369128 | 0.843725 | 0.488372 | 0.551778 |
| 9 | PME+10%DEE | 10 | 0.780952 | 0.342898 | 0.526603 | 0.666667 | 0.625 | 0.761468 | 0.364238 | 0.862793 | 0.538462 | 0.525736 |
| 10 | PME+15%DEE | 10 | 0.811881 | 0.333347 | 0.49757 | 0.604167 | 0.714286 | 0.734513 | 0.369128 | 0.885667 | 0.636364 | 0.537351 |
| 11 | D | 20 | 0.61194 | 0.471984 | 0.65885 | 0.637363 | 0.454545 | 0.535484 | 0.901639 | 0.548486 | 0.677419 | 0.618737 |
| 12 | PME | 20 | 0.59854 | 0.450584 | 0.716934 | 0.716049 | 0.357143 | 0.564626 | 0.846154 | 0.633669 | 0.512195 | 0.600901 |
| 13 | PME+5%DEE | 20 | 0.594203 | 0.447316 | 0.730822 | 0.920635 | 0.714286 | 0.58042 | 0.359477 | 0.638972 | 0.512195 | 0.589962 |
| 14 | PME+10%DEE | 20 | 0.602941 | 0.445757 | 0.725652 | 0.58 | 0.714286 | 0.572414 | 0.454545 | 0.623324 | 0.636364 | 0.595283 |
| 15 | PME+15%DEE | 20 | 0.594203 | 0.443061 | 0.712348 | 0.522523 | 0.714286 | 0.557047 | 0.350318 | 0.620429 | 0.777778 | 0.575407 |
| 16 | D | 30 | 0.42487 | 0.498811 | 0.78641 | 0.604167 | 0.5 | 0.425641 | 0.820896 | 0.41005 | 0.512195 | 0.617407 |
| 17 | PME | 30 | 0.473988 | 0.482906 | 0.867592 | 0.659091 | 0.454545 | 0.434555 | 0.774648 | 0.427429 | 0.677419 | 0.629707 |
| 18 | PME+5%DEE | 30 | 0.473988 | 0.481962 | 0.861188 | 0.794521 | 0.833333 | 0.439153 | 0.350318 | 0.417415 | 0.428571 | 0.614406 |
| 19 | PME+10%DEE | 30 | 0.471264 | 0.485213 | 0.867758 | 0.513274 | 0.833333 | 0.434555 | 1 | 0.408483 | 0.446809 | 0.721923 |
| 20 | PME+15%DEE | 30 | 0.450549 | 0.481765 | 0.883156 | 0.47541 | 0.714286 | 0.425641 | 0.337423 | 0.441189 | 0.677419 | 0.591586 |
| 21 | D | 40 | 0.333333 | 0.536594 | 0.915282 | 0.439394 | 0.357143 | 0.333333 | 0.964912 | 0.352224 | 0.344262 | 0.62769 |
| 22 | PME | 40 | 0.369369 | 0.50405 | 0.993055 | 0.411348 | 0.384615 | 0.344398 | 0.901639 | 0.344505 | 0.333333 | 0.632954 |
| 23 | PME+5%DEE | 40 | 0.334694 | 0.489615 | 0.921704 | 0.495726 | 0.714286 | 0.341564 | 0.350318 | 0.333333 | 0.355932 | 0.576469 |
| 24 | PME+10%DEE | 40 | 0.350427 | 0.495658 | 0.999629 | 0.351515 | 0.714286 | 0.34728 | 0.873016 | 0.335847 | 0.368421 | 0.685406 |
| 25 | PME+15%DEE | 40 | 0.356522 | 0.485706 | 0.887283 | 0.333333 | 1 | 0.338776 | 0.333333 | 0.340771 | 0.512195 | 0.617717 |
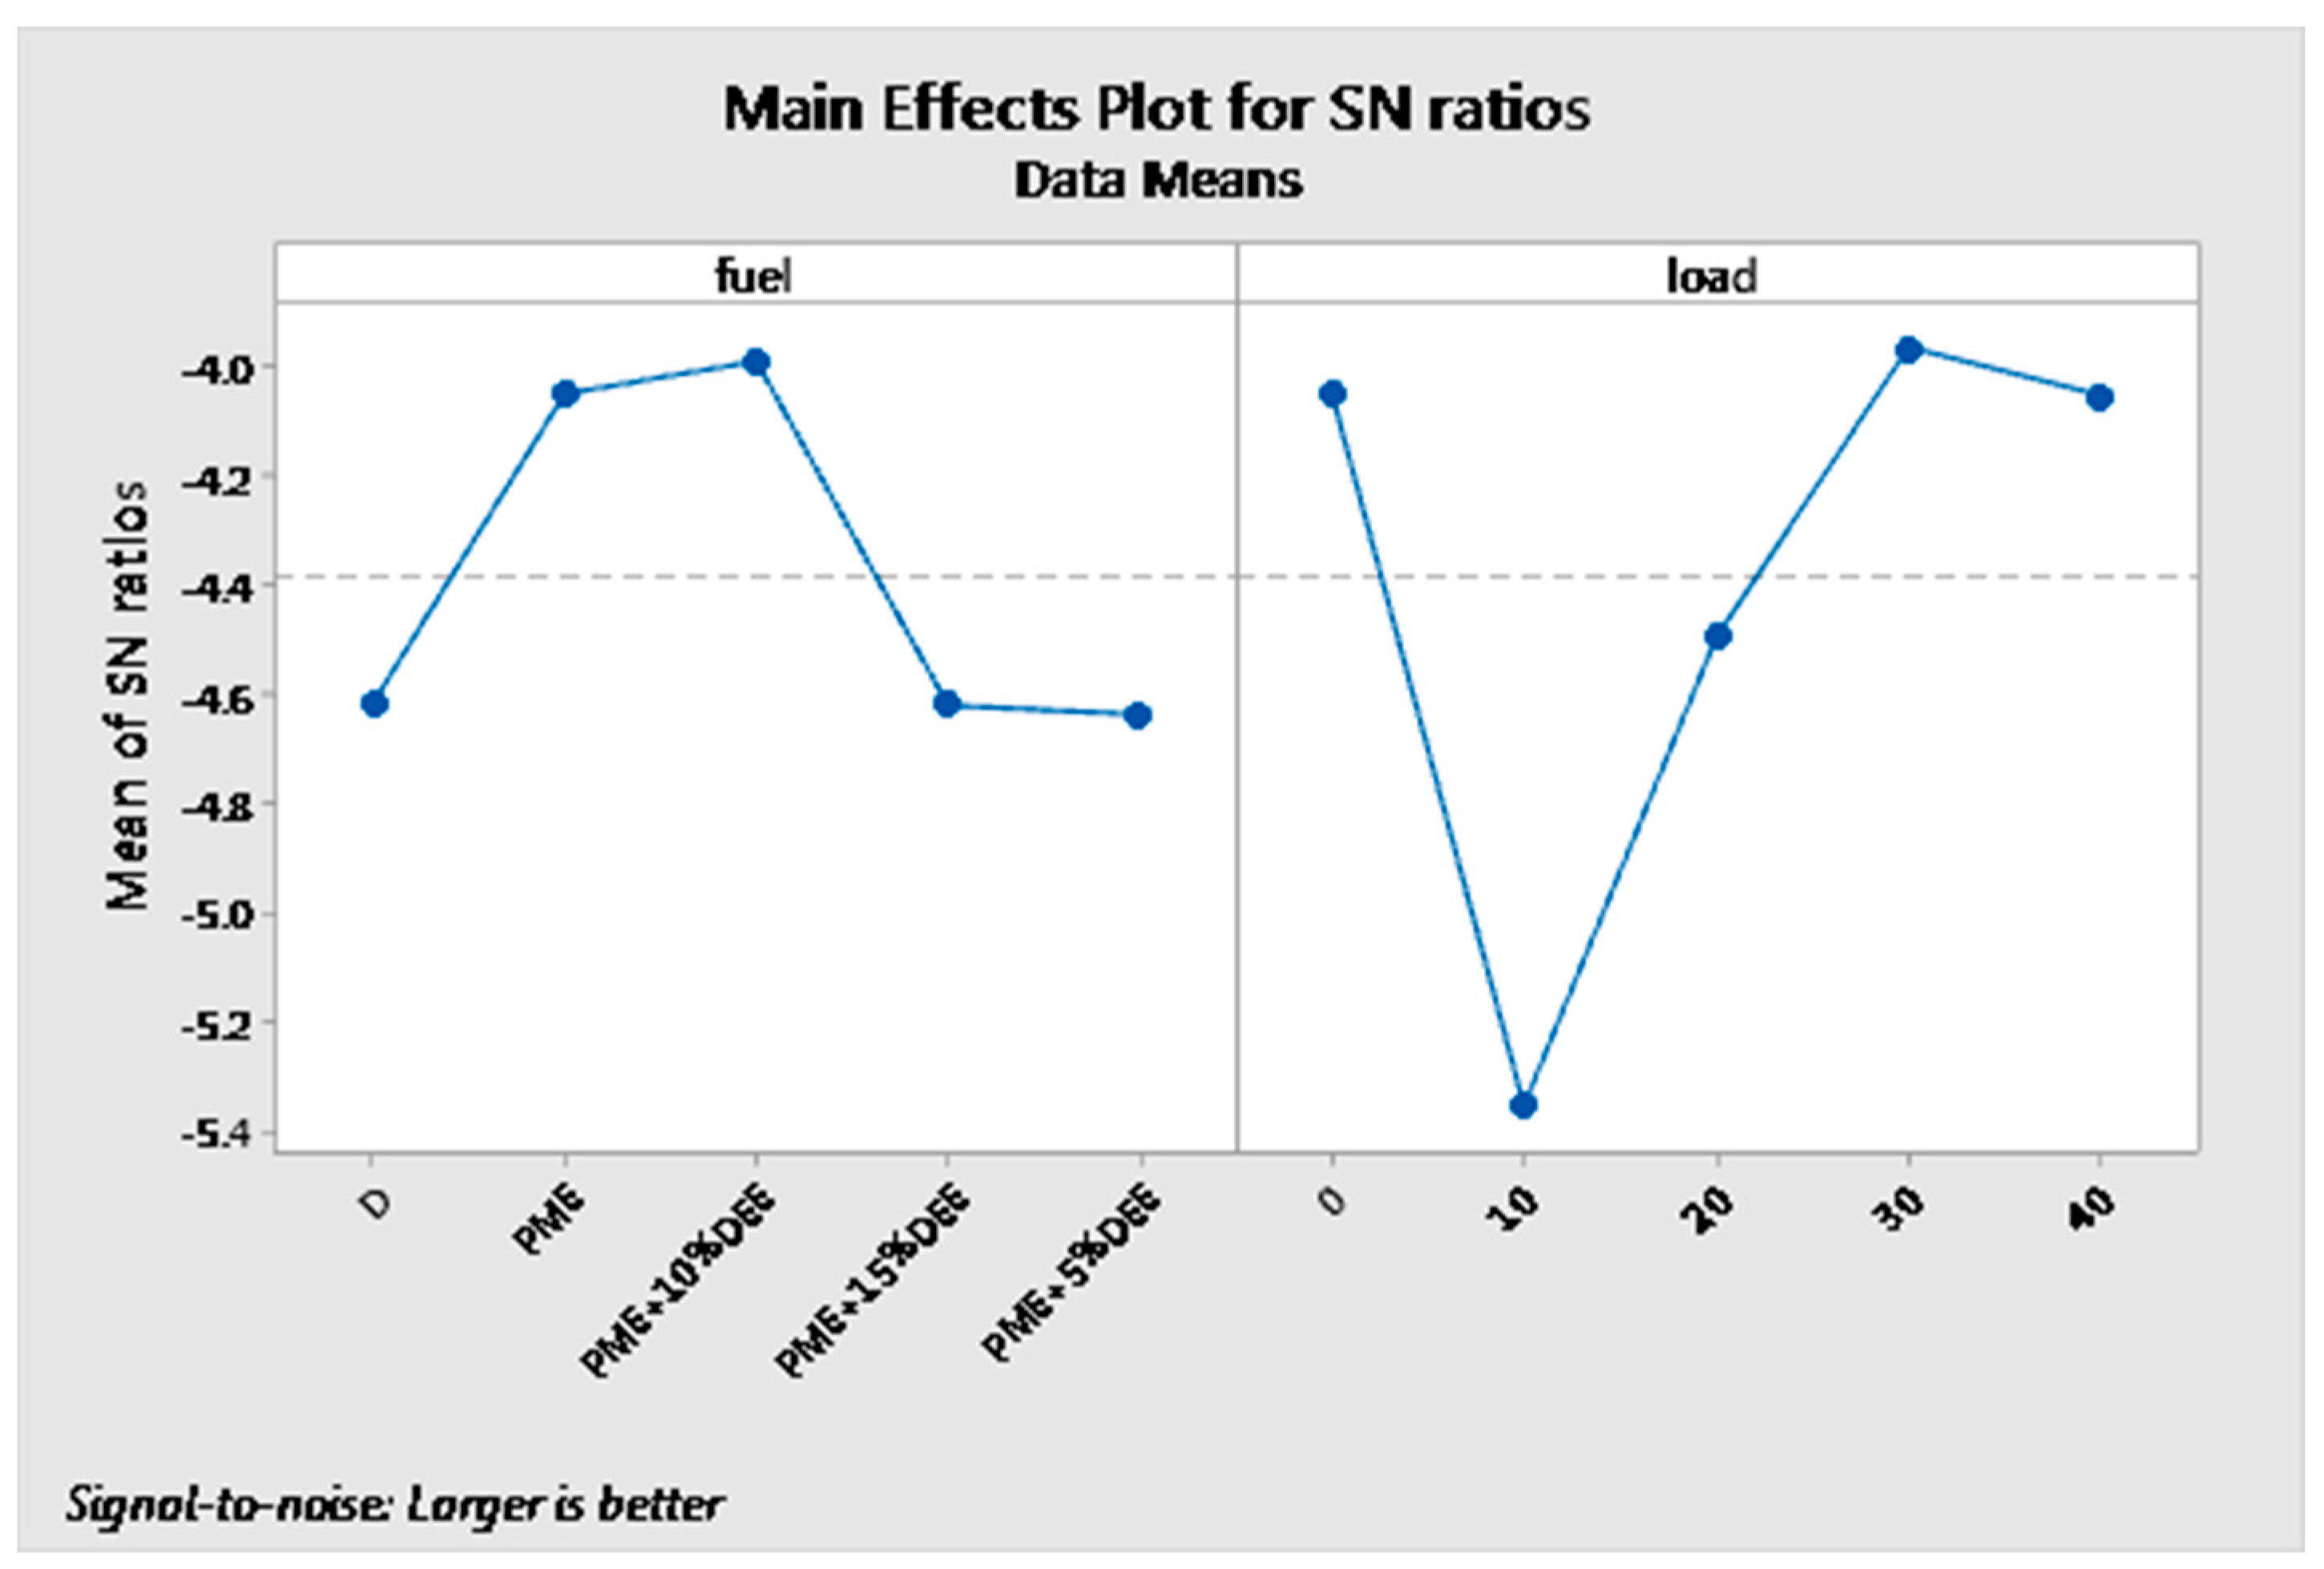
| Level | Fuel Blend | Load |
|---|---|---|
| 1 | −4.617 | −4.048 |
| 2 | −4.050 | −5.354 |
| 3 | −3.991 | −4.497 |
| 4 | −4.621 | −3.965 |
| 5 | −4.638 | −4.053 |
| Delta | 0.647 | 1.389 |
| Rank | 2 | 1 |
| S. no. | Factors | Optimal Level | Optimal Value |
|---|---|---|---|
| 1 | Load | 4 | 30 kg |
| 2 | Type of fuel blend | 2 | PME + 10% DEE |
| EXP | Load (kg) | Fuel Blend | EGT (0C ) | BSFC (kw-hr) | BTE (%) | HC (ppm) | CO (%) | CO2 (%) | O2 (%) | NOX (ppm) | Smoke (HSU) |
|---|---|---|---|---|---|---|---|---|---|---|---|
| 1 | 30 | PME + 10% DEE | 193 | 0.3664 | 26.4177 | 76 | 0.05 | 7.2 | 20.38 | 826 | 49 |
Disclaimer/Publisher’s Note: The statements, opinions and data contained in all publications are solely those of the individual author(s) and contributor(s) and not of MDPI and/or the editor(s). MDPI and/or the editor(s) disclaim responsibility for any injury to people or property resulting from any ideas, methods, instructions or products referred to in the content. |
© 2024 by the authors. Licensee MDPI, Basel, Switzerland. This article is an open access article distributed under the terms and conditions of the Creative Commons Attribution (CC BY) license (https://creativecommons.org/licenses/by/4.0/).
Share and Cite
Lakshmi, R.V.; Teja, G.D.; Mudidana, R.K.; Sagari, J. Optimization of Performance and Emission Parameters of Biodiesel with Additives Using Taguchi and Grey Relational Analysis. Eng. Proc. 2024, 66, 15. https://doi.org/10.3390/engproc2024066015
Lakshmi RV, Teja GD, Mudidana RK, Sagari J. Optimization of Performance and Emission Parameters of Biodiesel with Additives Using Taguchi and Grey Relational Analysis. Engineering Proceedings. 2024; 66(1):15. https://doi.org/10.3390/engproc2024066015
Chicago/Turabian StyleLakshmi, Reddy Vara, Gurugubelli Divya Teja, Ravi Kiran Mudidana, and Jaikumar Sagari. 2024. "Optimization of Performance and Emission Parameters of Biodiesel with Additives Using Taguchi and Grey Relational Analysis" Engineering Proceedings 66, no. 1: 15. https://doi.org/10.3390/engproc2024066015