Proceeding Paper

A Bottleneck Analysis of Robotics and Automation in the Coca-Cola Production Line †

1
Department of Mechanical Engineering, PNG University of Technology, Lae 411, Papua New Guinea
2
Department of Mechanical Engineering, Aditya Engineering College, Surampalem 533437, India
*
Author to whom correspondence should be addressed.
Presented at the 5th International Conference on Innovative Product Design and Intelligent Manufacturing Systems (IPDIMS 2023), Rourkela, India, 6–7 December 2023.
Eng. Proc. 2024, 66(1), 22; https://doi.org/10.3390/engproc2024066022
Published: 11 July 2024

Abstract

:
Automated material transfer between workstations is a key feature of flexible manufacturing systems. The aim of automation is to increase the output rate while reducing the manufacturing throughput. However, machine idle time contributes significantly to the overall throughput time and cannot be completely eliminated; it can only be minimized. Accurately locating the bottleneck and synchronizing it with other assembly line equipment can help reduce throughput. The process or activity with no idle or waiting time is known as the bottleneck in a production system. In this paper, we will analyze the bottleneck in Coca-Cola’s production line at Lae and provide suggestions for reducing throughput.

1. Introduction

An automated material movement, or handling, system refers to using a computer control system to regulate and transport materials to build products between workstations from start to finish in a flexible manufacturing system. The unit load, Mini-load, Person-on-board, Deep lane, and automated item retrieval systems are the five categories of ASs/RSs. A Deep lane AS/RS is utilized for massive warehouses with numerous layers of shelves and storage units, whereas a unit load AS/RS is used for lesser loads [1,2].
An automated material handling and storage system has the advantages of reduced throughput, enhanced product quality, and reduced labor costs.
The control system that operates these conveyors ensures that a proper conveyor speed is maintained between various workstations. A manually used forklift moves goods to storage; the storage system is not automated [2,3].
This brief paper seeks to determine a bottleneck by analyzing Coca-Cola production’s automated material flow and storage system. This study also provides a process flow analysis of the Coca-Cola factory’s manufacturing process to suggest ways to lower throughput as shown in Table 1.

2. Methodology

Our research group planned a field trip to the Coca-Cola plant in Lae to learn about its automated material transportation and storage system. The factory’s process engineers kindly provided us with a tour of the entire manufacturing process. We conducted a manual process flow analysis using the data and information we gathered during the field trip.

3. Results and Discussion

Conveyors account for the majority of Coca-Cola’s automated material transportation in Lae. A system of rollers and conveyor belts transports the Coca-Cola bottle from one cell to the next. The Coca-Cola storage system is not automated. Only a manually operated forklift is used to move it to the warehouse for storage [1,2].
The first step of process flow analysis is to locate any potential bottlenecks. Next, the remaining aspects of the process are based on the metrics for measuring its success. These consist of throughput and utilization (Figure 1).
Blowing a bottle takes around a minute, including when the premade bottles need to go through the blow mold oven. Once the blow molding station has produced the correct bottle shape, the bottles go to the fill station, where high-pressure beverage injection fills and caps them [3]. The filler is equipped with a circular arrangement of nozzles that is used to fill the bottles. Up to 50 bottles can be filled and sealed in a single pass or loop, since the bottles are filled while rotating on a loop conveyor. Therefore, supplying the number of bottles in a pass or revolution of the filler takes around a minute [3,4]. As filled and capped bottles leave the fill station, they pass through an inspection point, where an X-ray camera with sensors checks each bottle’s fill level and faults [1]. The labeler is the next station on the PET production line, following the date coder. The bottles are labeled in the labeler using a reel-labeling wheel system with trade-marked labels. Here, the bottles are quickly labeled one at a time. Each bottle enters the labeler and is kept at a fixed distance by a mechanical fixture; it takes around 30 s to label each bottle. The bottles require approximately two minutes to travel from the packer’s entrance to the heated channel’s departure. The bottle pack is then transferred by a conveyor belt to the next station’s palletizer [4,5,6]. The palletizer sorts the cartons into layers, which are each stacked on the pallet as shown in Table 2. A robotic arm sorts the pallets, and the process takes around five minutes [7,8,9,10]. The trip yielded a production rate of 2000 PET bottles per hour. The bottleneck station has a single server. The examination is carried out quickly and precisely using a single X-ray machine [4,5,6].
The utilization of the bottleneck station is 100% at maximum production rate R p . The overall FMS utilization is calculated as
U s = i = 1 n S i U i / i = 1 n S i = i = 1 n S i W L i / S i R p / i = 1 n S i
Only 36.4% of the assembly line is used during maximum output, indicating that specific machines must operate to their full potential due to bottlenecks. The bottleneck’s production rate has to be raised to boost utilization. This is accomplished by either adding more servers or lightening the burden. The manufacturing lead time or the throughput can now be calculated. The waiting time T w is zero.
M L T = i = 1 n W L i + W L n + 1 + T w
This means that it takes 25 min to produce a pallet and then move it to the end of the line.
To put it briefly, the bottleneck station and the upstream workstations are automatically managed to prevent lines and waiting times. For instance, if there is a chance of a queue in the manufacturing line, the workstation’s speed will rise. Similarly, if there is a chance of an idle condition, the workstation’s speed drops. Before the next work item arrives, this automated control system ensures that every workstation completes its tasks on schedule. As a result, there is no longer a need for workstation lines or wait times. Each workstation is used more efficiently, and there is a low total throughput.

4. Conclusions

Three automated material handling systems are utilized in the Coca-Cola facility in Lae: robotic arms, conveyors, and loops. The robotic arm is utilized for palletizing, the filling machine uses a loop, and the conveyors at the downstream workstations employ a loop. A manually operated forklift moves cargo from the manufacturing line’s end to the storage unit. Automation is not implemented. The facility could increase the number of servers at the bottleneck station to boost throughput or decrease the burden by speeding up or shortening the processing time for each item.

Author Contributions

Conceptualization, M.M. and A.M.; methodology, A.M.; validation, S.K. and A.M; formal analysis, A.M.; investigation, M.M.; resources, A.M.; data curation, M.M.; writing—original draft preparation, S.K.; writing—review and editing, A.M. and M.M.; visualization, A.M.; supervision, A.M. and S.K.; project administration, A.M. All authors have read and agreed to the published version of the manuscript.

Funding

This research received no external funding.

Institutional Review Board Statement

Not applicable.

Informed Consent Statement

Not applicable.

Data Availability Statement

All data are provided in the article.

Conflicts of Interest

The authors declare no conflicts of interest.

References

  1. Ajenblit, D.A. Applying Genetics Algorithms to the U-shaped Assembly Line Balancing Problem. In Proceeding of the IEEE Conference of Evolutionary Computation, Anchorage, AK, USA, 4–9 May 1998; pp. 96–101. [Google Scholar]
  2. Yin, X.; Pan, L. Direct adaptive robust tracking control for 6 DOF industrial robot with enhanced accuracy. ISA Trans. 2018, 72, 178–184. [Google Scholar] [CrossRef] [PubMed]
  3. Heizer, J.; Barry, R. Production and Operation Management; Allyn and Bacon Inc.: Boston, MA, USA, 1988. [Google Scholar]
  4. Ribeiro, J.; Lima, R.; Eckhardt, T.; Paiva, S. Robotic Process Automation and Artificial Intelligence in Industry 4.0—A Literature review. Procedia Comput. Sci. 2021, 181, 51–58. [Google Scholar] [CrossRef]
  5. International Labour Office. Introduction to Work Study, 3rd ed.; ILO Press: Geneva, Switzerland, 1979. [Google Scholar]
  6. Goldratt, E.M. The Goal, 4th ed.; The North River Press Publishing Corporation: Great Barrington, MA, USA, 2014. [Google Scholar]
  7. Rout, A.; BBVL, D.; Biswal, B.B.; Mahanta, G.B. Optimal trajectory planning of industrial robot for improving positional accuracy. Ind. Robot. Int. J. Robot. Res. Appl. 2021, 48, 71–83. [Google Scholar] [CrossRef]
  8. Rout, A.; Mahanta, G.B.; Gunji, B.; Deepak BB, V.L.; Biswal, B.B. Kinematic and dynamic optimal trajectory planning of industrial robot using multi-objective ant lion optimizer. In Advances in Mechanical Engineering: Select Proceedings of ICRIDME 2018; Springer: Singapore, 2020; pp. 1475–1486. [Google Scholar]
  9. Mohamed, A.; Ben, J.; Muduli, K. Implementation of Autonomous Maintenance and Its Effect on MTBF, MTTR, and Reliability of a Critical Machine in a Beer Processing Plant. In Applications of Computational Methods in Manufacturing and Product Design; Springer: Singapore, 2023; pp. 511–521. [Google Scholar]
  10. Oyekola, P.; Oyewo, T.; Oyekola, A.; Mohamed, A. Arduino based smart home security system. IJITEE 2019, 8, 2880–2884. [Google Scholar] [CrossRef]
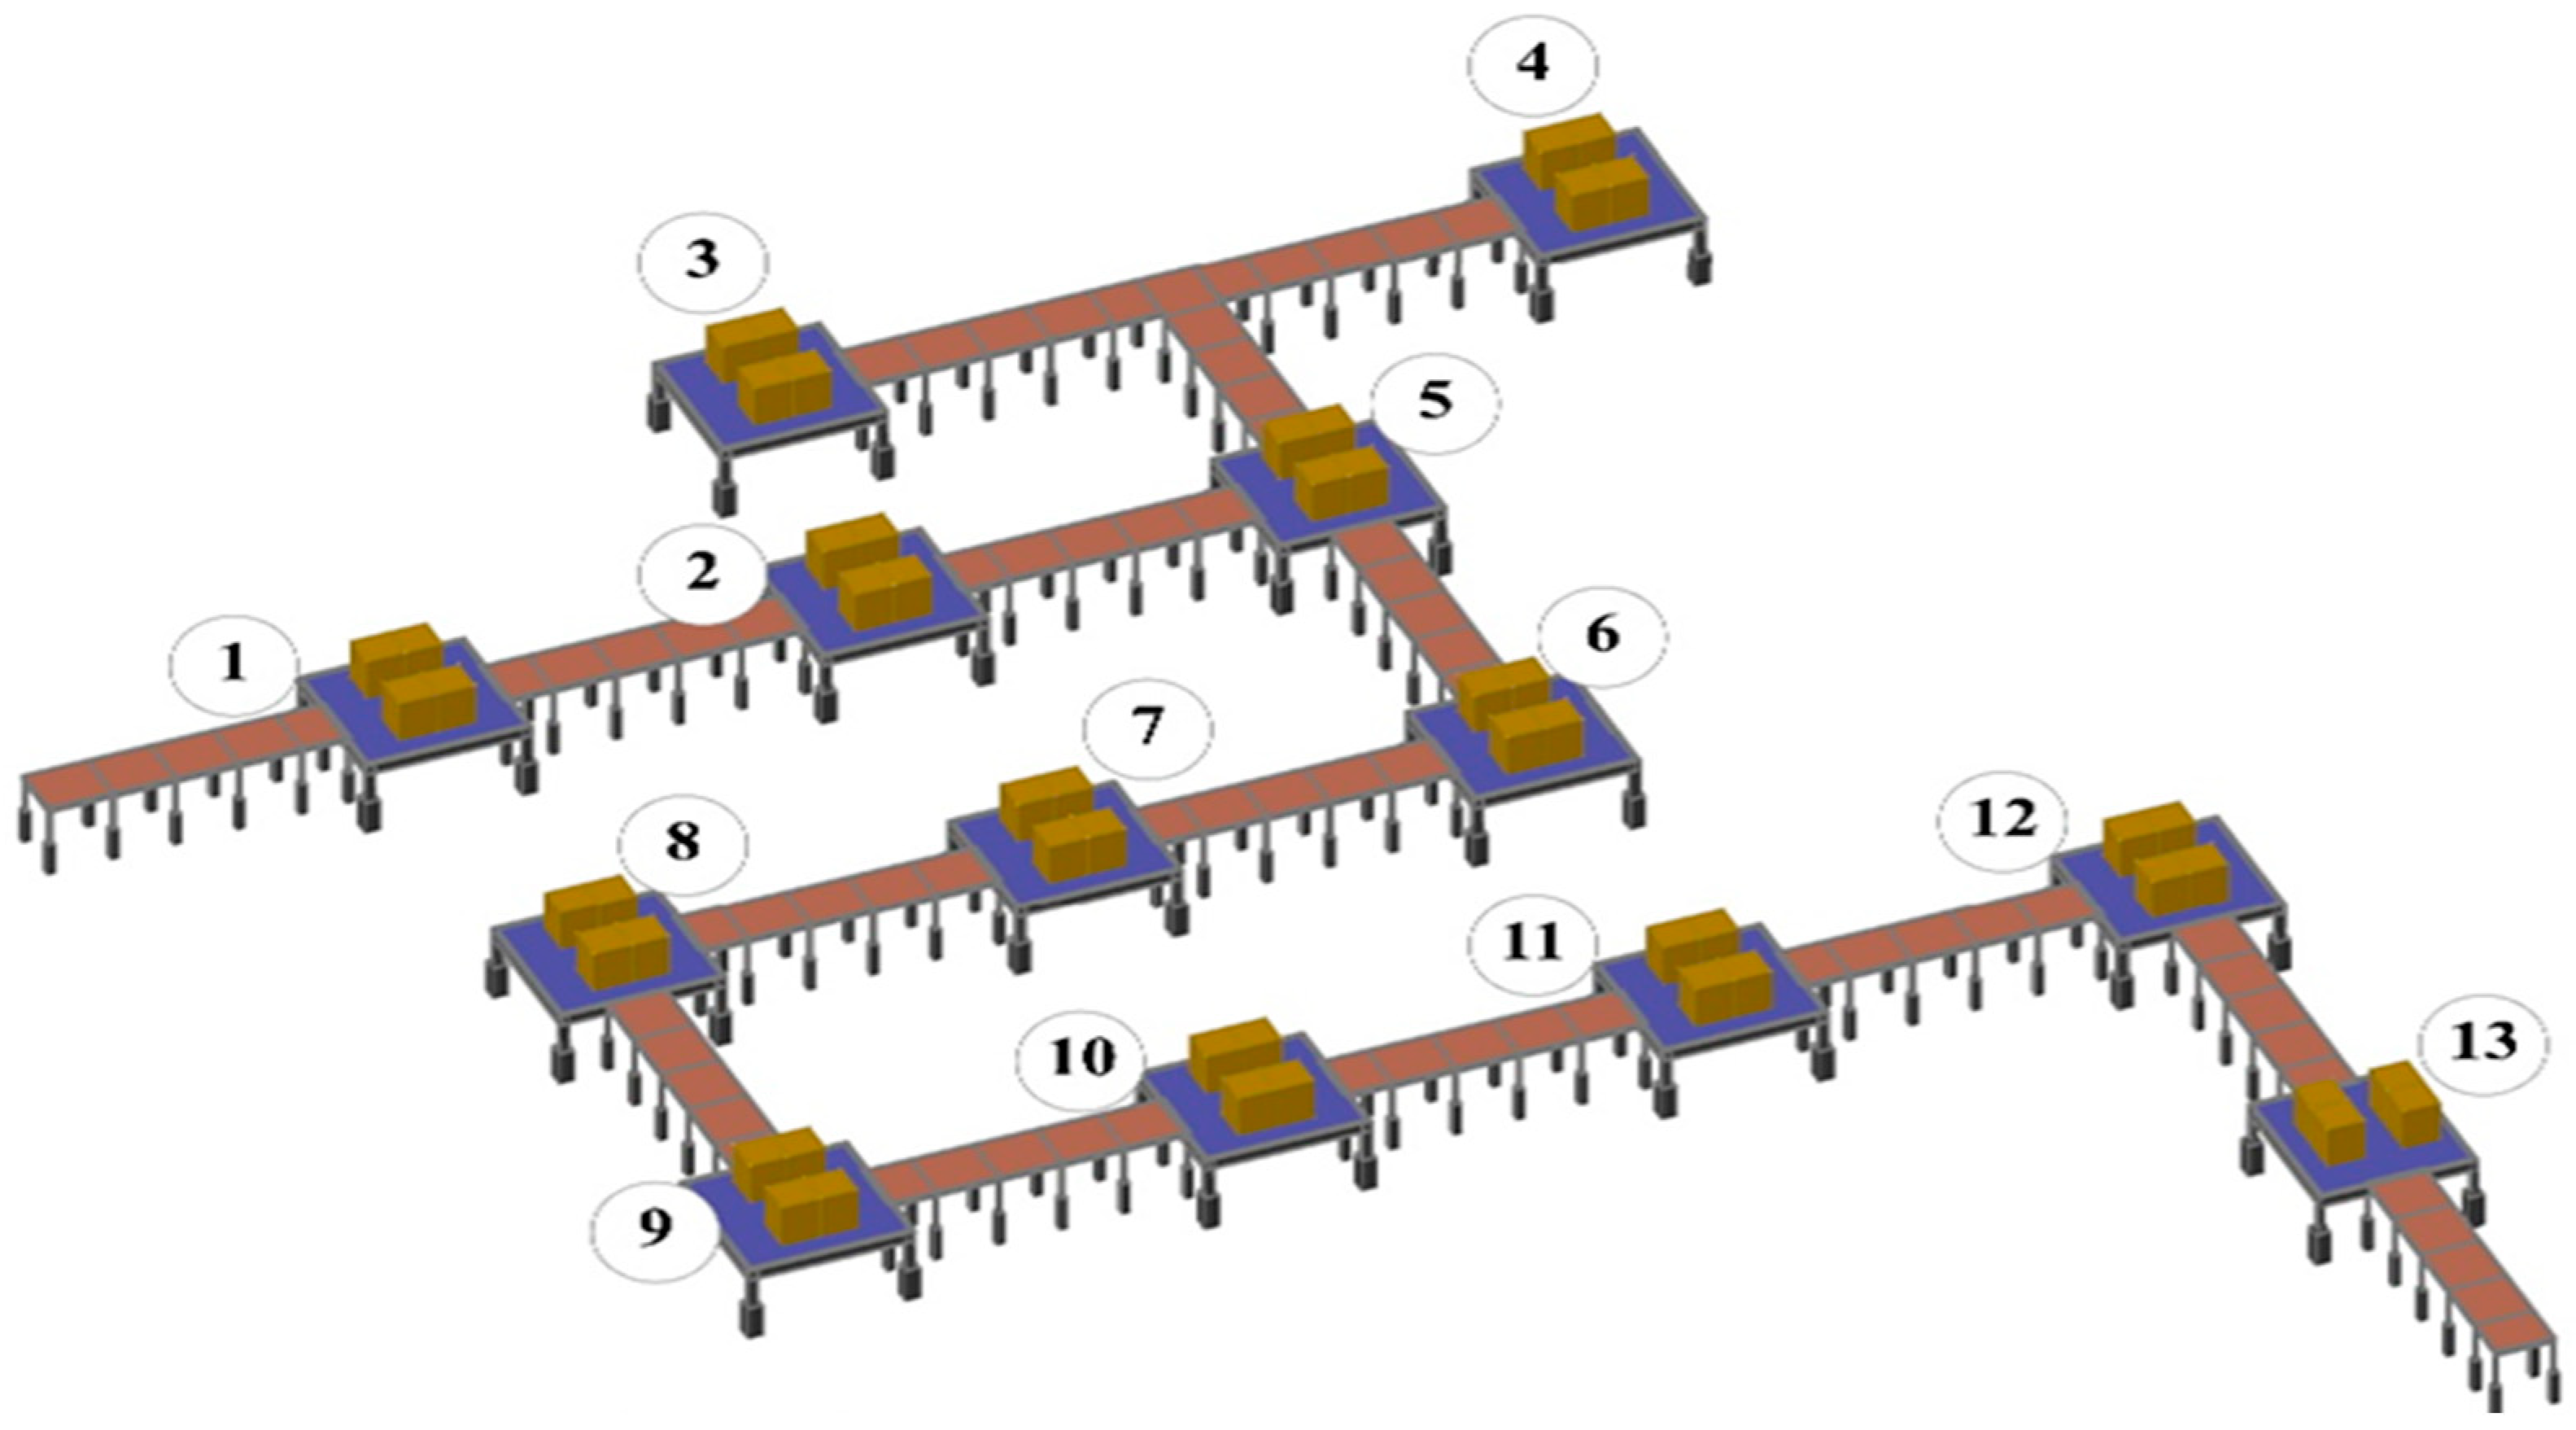
Figure 1. Overall process of Coca Cola PET production line.
Engproc 66 00022 g001
Table 1. Detailed overview of the 13 processes in the production line.
ProcessDescription
1.
Bottle preforming
Preforms are loaded onto the rinser, and the process starts.
2.
Blow molding
The PET preforms are heated to 180 and blown using 40 bar air pressure. The bottle takes the shape of the mold casing.
3.
Bottle cap feed
All caps are checked for defects and ovality before being sent to the filler.
4.
Mixing
The mixer processes CO2 + Syrup from the syrup room, chills it to 2 °C, and sends it to the filler for filling.
5.
Filling
Bottles from the blow mold oven are filled and capped by injecting beverage through a filling nozzle at high pressure.
6.
Fill level inspection
After the bottles are capped, their levels and capping quality are checked using an X-ray camera. Products with lower levels or faulty caps are rejected automatically.
7.
Date coding
The bottles are coded for manufacturing or expiry dates.
8.
Labeling
The bottles are labeled with the trademark label.
9.
Packing
The bottles are separated into 4-by-6 blocks and wrapped with the shrink film wrapper.
10.
Tunnel heating
The tunnel heats the film and shrinks it at 180 °C. The packs are ready to be palletized.
11.
Palletizing
The machine sorts the cases into layers and stack each layer on the pallets.
12.
Stretch wrapping
The pallet products are wrapped and sealed as finished goods.
13.
Transport to storage using forklift
Manually driven forklift is used for transportation to storage. End of the line.
Table 2. Estimated time for each workstation and material handling processes.
OperationDescriptionStationNo. of ServersWorkload of Station, Sec/BottleConvey/Move Sec/Bottle
LoadingLoading preformed bottles onto conveyor0102005Start
RinsingRinsing each preformed bottle0102005030
Blow moldingBlowing the preformed bottles into desired shapes in the mold0250060030
FillingFilling and capping happen in the same station0350060030
Fill level inspectionInspection of the fill level and capping quality0401001020
Date codingPrinting of manufacturing date and expiry date0501002015
Labeling Labelling with trademarked labels0601030010
PackingPacking of the bottles into packs/cartons0701120120
PalletizingSorting of the cartons/packs onto pallets0801300420
Stretch wrappingWrapping of the pallets0901120180
Disclaimer/Publisher’s Note: The statements, opinions and data contained in all publications are solely those of the individual author(s) and contributor(s) and not of MDPI and/or the editor(s). MDPI and/or the editor(s) disclaim responsibility for any injury to people or property resulting from any ideas, methods, instructions or products referred to in the content.