Proceeding Paper

Optimization of Extracted Phenolic Compounds from Oregano through Accelerated Solvent Extraction Using Response Surface Methodology †

by
Christina Panagiotidou
,
Elisavet Bouloumpasi
*,
Maria Irakli
and
Paschalina Chatzopoulou
*
Hellenic Agricultural Organization–Dimitra, Institute of Plant Breeding and Genetic Resources, 57001 Thessaloniki, Greece
*
Authors to whom correspondence should be addressed.
Presented at the 3rd International Electronic Conference on Processes—Green and Sustainable Process Engineering and Process Systems Engineering (ECP 2024), 29–31 May 2024; Available online: https://sciforum.net/event/ECP2024.
Eng. Proc. 2024, 67(1), 10; https://doi.org/10.3390/engproc2024067010
Published: 12 August 2024
(This article belongs to the Proceedings of The 3rd International Electronic Conference on Processes)

Abstract

:
The current research focuses on the optimization of accelerated solvent extraction, a potential alternative to conventional solvent extraction, for the extraction of phenolics from Greek oregano. The response surface methodology based on central composite design was used to optimize methanol concentration (X1, 40–80%), extraction time (X2, 3–9 min, 3 cycles), and extraction temperature (X3, 60–140 °C). Under the optimal extraction conditions (methanol concentration of 74%, extraction time of 9 min, extraction temperature of 140 °C), the experimental values for extraction yield (%), total phenolic (TPC) and flavonoid contents (TFC), and antioxidant capacity matched those predicted, therefore validating the model adequately. The oregano extracts were rich in phenolic compounds, with rosmarinic acid and salvianolic acid B being the most prevalent phenolic components. The results obtained revealed that ASE can be utilized for the extraction of bioactive compounds, and there are advantages to preserving phenolic content if optimization is applied.

1. Introduction

Extraction is an essential step in natural product research, with ongoing efforts to develop more efficient and cost-effective extraction techniques. Conventional solvent extraction techniques have several disadvantages, including long extraction times, large solvent usage, and multiple extraction steps, as well as lower yields and lower selectivity. Additionally, significant amounts of thermolabile phytochemicals can decompose or degrade during heating [1].
New “green” extraction techniques that provide higher efficiency, lower energy, and less solvent consumption than conventional extraction processes have already been utilized in extracting antioxidants from aromatic plants and essential oils’ distillation solid residues in order to improve extraction efficiency and product quality [2,3,4]. The adoption of eco-friendly technologies to produce natural ingredients has also gained appeal due to their focus on causing less impact to the environment. Numerous techniques have been developed that use elevated temperatures and pressures that can significantly speed up the extraction process [2]. Among them, Accelerated Solvent Extraction (ASE) is an automated extraction technique that uses elevated temperatures and pressures to achieve extracts. This technique has gained considerable importance due to its advantages, such as low solvent usage, high productivity, better repeatability, and relatively short processing time. Accelerated extraction systems provide controlled high temperature and pressure, with low extraction time, applying a number of extraction cycles. Optimizing these parameters can significantly increase the yield of extracted compounds from plants [2,3,4,5,6].
The genus Origanum (Labiatae) comprises perennial, and shrubby herbs native to the Mediterranean, Euro-Siberian, and Irano-Siberian regions. Globally, a total of 38 species of Origanum have been identified. The majority of Origanum species, accounting for over 75%, are found mostly in the East Mediterranean subregion [7,8]. Given their diverse chemical compositions and aromatic profiles, Origanum plants from various species and ecotypes find extensive applications in foods, traditional medicine, as well as in the pharmaceutical and cosmetic sectors. They are utilized as culinary herbs, flavoring agents in food products, enhancers in alcoholic beverages, etc., valued for their distinctive spicy fragrance. The plant is renowned for its potent antimicrobial and antioxidant activities, which likely account for its use in traditional medicine. The antimicrobial properties of O. vulgare are attributed to its high concentration of volatile oils, and mainly their phenolic compounds, and also flavonoids and phenolic acids, which are abundantly present in O. vulgare and are responsible for its antioxidant activity [8,9,10,11,12].
Globally, there is a growing interest in medicinal plants, with researchers and the general public alike acknowledging the beneficial properties of natural products, particularly those sourced from plants, in promoting human health. The efficiency of extraction is contingent upon several factors, including the extraction technique employed, sample particle size, choice of solvent, and the presence of interfering compounds. Hence, it is crucial to identify an optimal extraction method that facilitates the retrieval of extracts rich in biologically active compounds while minimizing the presence of interfering substances [13].
The purpose of this study was to determine how effectively Greek oregano extract may yield bioactive phenolics when using green extraction techniques (i.e., ASE). To achieve this, an optimization study of the extraction parameters using response surface methodology (RSM) was carried out. The total phenolic and flavonoid content (TPC and TFC, respectively), extract yield (%), and antioxidant capacity of the resulting extracts were used to determine the extraction technique’s efficiency and the optimal operating conditions in order to obtain the maximum yield of extracts rich in biologically active compounds.

2. Materials and Methods

2.1. Plant Material and Accelerated Solvent Extraction (ASE)

The aerial parts of Origanum vulgare ssp. hirtum were collected from cultivated accessions of the Hellenic Agricultural Organization—DIMITRA, Institute of Plant Breeding and Genetic Resources (Thermi, Thessaloniki, Greece, latitude 40°32′49.63″ N, longitude 23°01′10.81″ E) and were sun-dried. After being dried to around 10% moisture content, the plant material (flowers and leaves) was pulverized in a laboratory mill (Retsch, Model ZM 1000, Haan, Germany) and kept at 4 °C until additional analysis was performed.
A Dionex ASE 350 extractor (Thermo Fisher Scientific Inc., Sunnyvale, CA, USA) outfitted with 22 mL stainless steel cells was used to perform ASE. The sample was prepared by weighing 1.0 g of powdered oregano and combining it with diatomaceous earth, followed by putting it in a cell and extracting it within the guidelines of the central composite experimental design. The extraction solvent used in the experiments was aqueous methanol solutions (40–80%, v/v), and the temperatures used were 80–140 °C. In total, 3 to 9 minutes were allocated for static extraction time, and all other variables were maintained at 1500 psi, 90 s of nitrogen purging, 5 minutes as preheating time, 65% flushing volume, and 3 extraction cycles.
A 60 mL glass vial fitted with a Teflon septum was used to collect the extracts. A vacuum rotary evaporator was used to evaporate the methanol, and then lyophilization was performed (Christ, Martin Christ Gefriertrocknungsanlagen GmbH, Osterode am Harz, Germany) for 48 h. Lastly, the dried extract was stored at −20 °C.

2.2. Experimental Design

The ASE extraction conditions were optimized with the application of response surface methodology (RSM). The effects of three independent variables—methanol concentration (X1), static time (X2), and extraction temperature (X3)—on response variables—extraction yield (R1: g extract/100 g DW), TPC (R2: mg GAE/g DW), TFC (R3: mg CATE/g DW), ABTS (R4: mg TE/g DW), and DPPH (R5: mg TE/g DW)—were investigated using a central composite design (CCD). The levels of the independent variables are presented in Table 1.
Each dependent variable was fitted using a full quadratic mathematical model. Analysis of variance was used to statistically test the results. By assessing the lack of fit, coefficient of regression (R2), and adjusted determination coefficient (R2adj), the constructed model’s suitability was determined. At the 95% confidence level (p < 0.05), the regression coefficients’ statistical significance was determined.
Response surface contour plots were used to examine the relationships between the independent variables and how those relationships affected the response. By adjusting two variables within the experimental range and keeping the third variable constant at the central point, the models were used to create the contour plots. The Minitab software’s desirability function was utilized to optimize the extraction conditions (independent factors X1, X2, and X3) (https://www.minitab.com/en-us/), keeping in mind that the independent variables were investigated within their range of values (between the lowest and the highest level) and that maximum desirability was required (maintained at a maximum) for each response (extraction yield, TPC, TFC, ABTS, and DPPH). The model’s optimal conditions were applied to produce the experimental data. Three experimental replicates were performed under optimal conditions.

2.3. Analyses

Total Phenolic Content (TPC): The Folin–Ciocalteu assay was employed to quantify the TPC of the samples, according to the procedure outlined by Irakli et al. [14]. The findings were reported as a mean of three replications and expressed as milligrams of gallic acid equivalents (mg GAE/g) per gram of extract.
Total Flavonoid Content (TFC): For the determination of the TFC of the samples, the aluminum chloride colorimetric method was applied according to the procedure described by Irakli et al. [14]. The findings were reported as a mean of three replications and expressed as milligrams of catechin equivalents (mg CATE/g) per gram of extract.
Antioxidant activity: The antioxidant activities of the extracts were evaluated using (a) the ABTS assay and (b) the DPPH assay as described by Irakli et al. [14]. The findings were reported as a mean of three replications and expressed as mg Trolox equivalent per g of extract (mg TE/g).
Individual phenolic compounds: Identification and quantification of 48 phenolic compounds was performed by HPLC-PDA-ESI-MS analysis [15] using a Shimadzu Nexera HPLC system (Kyoto, Japan), outfitted with a diode array detector (DAD), a single-quadrupole mass spectrometer, an electrospray ionization (ESI) interface, and a Poroshell 120 EC-C18 column (4.6 × 150 mm, 4 μm) thermostated at 35 °C. Solvent A (0.1% aqueous formic acid (v/v)) and solvent B (acetonitrile) were used as the mobile phase with a gradient program of 0 min: 15% B; 5 min: 25% B; 10 min: 35% B; 28 min: 60% B; 28.01 min: 60% B; 35 min: 100% B; 35.01 min:15% B; 42 min: 15% B. The flow rate was 0.5 mL/min and the injection volume was 10 μL. The mass spectrometer recorded in negative ionization mode, and the DAD acquisition ranged from 190 to 400 nm. Chromatographic and mass spectrometric data acquisition were processed using Lab Solutions LC-MS software version 5.97.1, (Shimadzu, Kyoto, Japan). The determinations were performed in triplicate.

2.4. Statistical Analysis

Design Expert (trial version 11.0) was used to create the design matrix, data fitting, statistical analysis, and extraction process optimization utilizing the experimental data (Stat-Ease Inc., Minneapolis, MN, USA). The resulting model’s validation was confirmed by the Tukey’s test (p < 0.05).

3. Results and Discussion

3.1. Statistical Analysis and Model Fitting

The experimental regions of methanol concentrations (40–80%), extraction time (3–9 min), and extraction temperature (80–140 °C), were determined by preliminary investigations. The experimental design comprised twenty runs. The order of the experiments was randomly performed. In order to estimate the response values, the coefficients of a polynomial equation were constructed from the experimental findings. The insignificance of the lack-of-fit test (p > 0.05) verified the suitability of the generated model for all responses.
Statistically insignificant terms on the response were removed from the mathematical models, simplifying them. Table 2 displays the estimated regression equations for each response in terms of coded factor values.
Table 3 displays the findings of the analysis of variance (ANOVA) and shows that all the models, except that of ABTS, are significant (p ≤ 0.05); therefore, the generated model is adequate. In addition, the validity of each model is confirmed by the insignificance of the lack of fit (p > 0.05). The response’s extraction yield, followed by TPC and TFC, had sufficient coefficients of determination (R2) and adjusted determination coefficient (R2adj), higher than 0.83 and 0.70, respectively, indicating a good correlation between the experimental results and the predicted data. On the other hand, the R2 and R2adj values of DPPH and ABTS responses ranged between 0.70 to 0.77 and 0.44 to 0.56, respectively, indicating that the model contains extraneous terms [16].

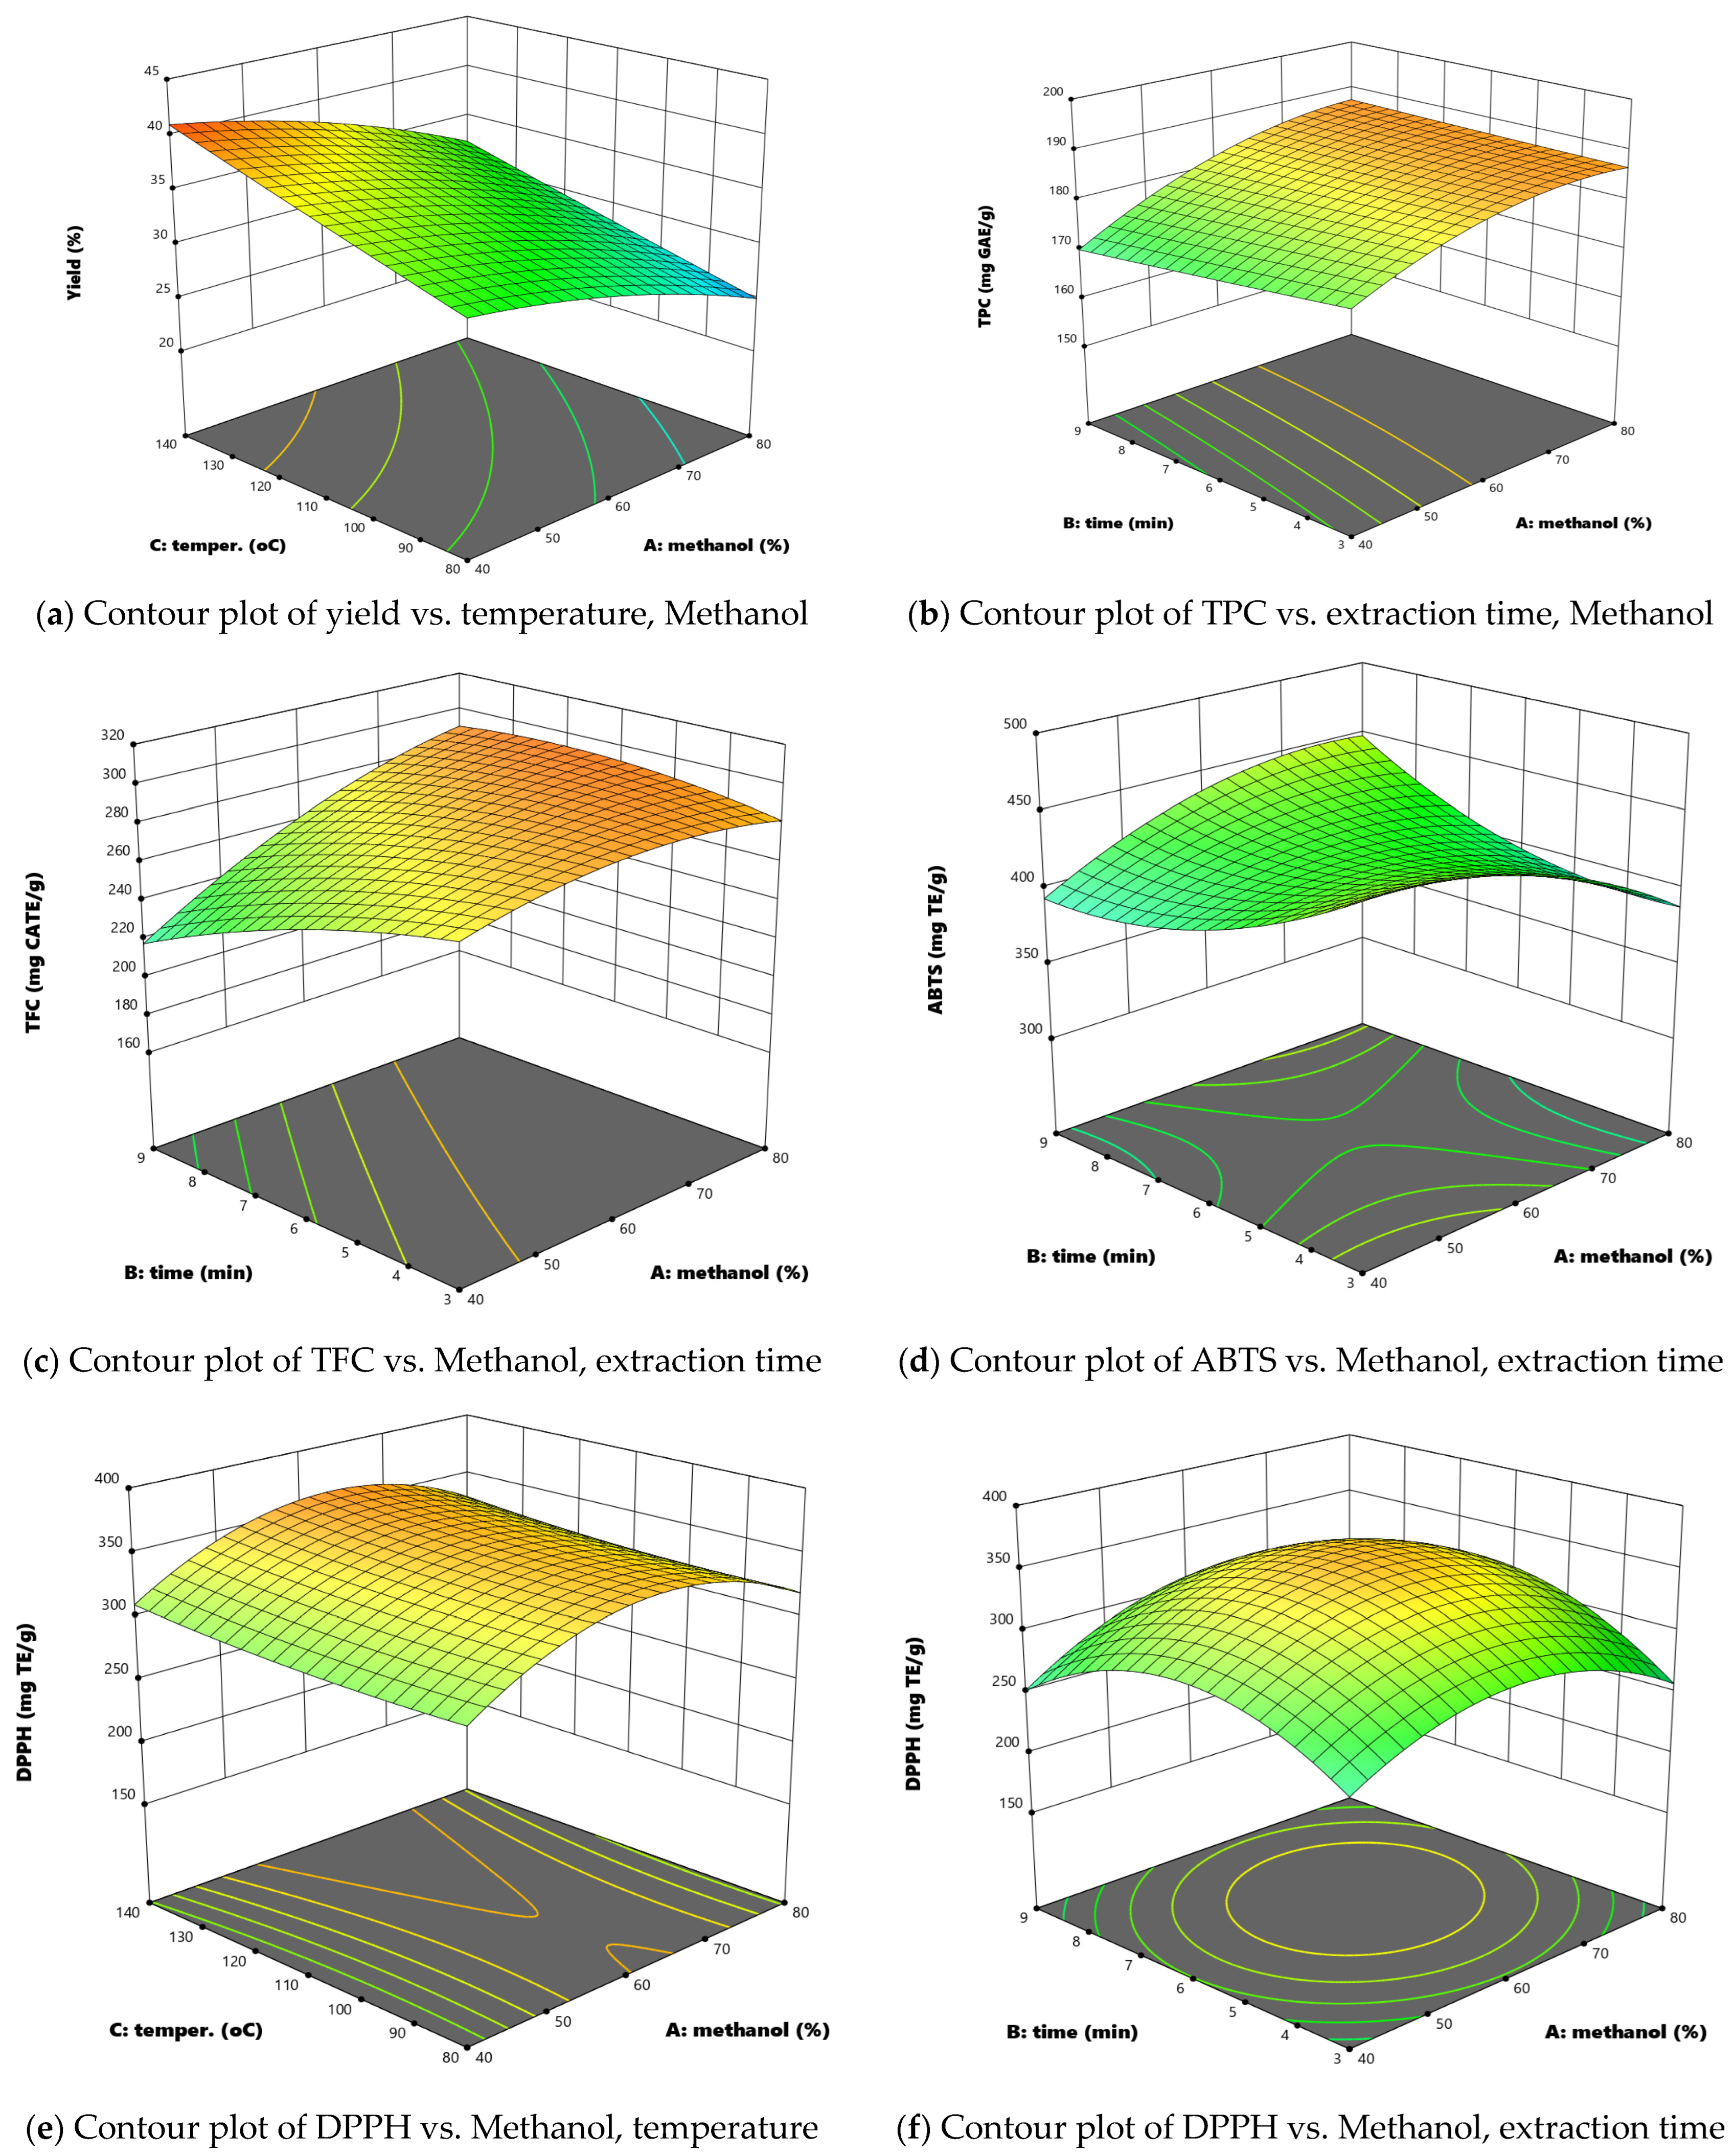
3.2. Influence of Independent Factors on the Investigated Responses

The effects of methanol concentration are depicted in the contour plots (Figure 1), clearly demonstrating that solvent concentration has a pronounced effect on phenolic compound extraction from oregano plant material. The results indicate that extraction yield is reduced with an increase in methanol concentration (Figure 1a). Similar results were obtained by the authors of [17], where the 40% ethanol extract of Centella asiatica contained more phenolic compounds than the 60%, 80%, and 100% ethanol extracts. On the contrary, TPC and TFC levels (Figure 1b,c) increase with increased methanol concentration, and the highest levels are achieved with concentrations over 60%. These observations are consistent with those reported by other authors [14]. Conversely, DPPH levels increase up to 55% methanol, have a maximum concentration between 55 and 75% methanol, and then decrease (Figure 1e,f).
The linear term of time had no effect on yield, TPC, ABTS, or DPPH responses, while time affected DPPH response in a quadratic manner. The limited effect of time is probably due to the quick extraction kinetics under high pressure conditions. In fact, the secondary metabolites might quickly approach the final saturation concentration in the pressured solvent due to their high solubility. The solvent diffuses at a high rate, and the extraction yield might reach its maximum value quickly [18]. Previous reports have indicated that time has a positive effect on extraction yield using ASE [3]. Only TFC was statistically significantly impacted negatively by the extraction time; the findings show (Figure 1c) that when extraction time rises, TFC recovery decreases.
The positive effect of the linear term of temperature on the extraction yield was observed, while it also affected TFC in a quadratic manner (negative effect). The results indicate that temperature had no effect on the other responses. This is in accordance with Liang et al. [18] who noted the mitigation of chemical degradation of secondary metabolites by ASE due to its operation in an inert atmosphere.
Methanol concentration also demonstrated a significant interactive effect with temperature in the case of TPC, and with both time and temperature for TFC and ABTS responses. For the latter interactions, higher responses were achieved with methanol in higher concentrations and time or temperature in the lower limits.

3.3. Optimization Study

In the present study, the goal was the maximization of extraction yield, TPC, TFC, ABTS, and DPPH values. The maximum desirability for the ASE models was 0.80. The optimum extraction conditions were 74% methanol concentration, 9 min (3 cycles) of extraction time, and 140 °C extraction temperature. Table 4 displays the predicted value for the response variables (EY, TPC, TFC, ABTS, and DPPH), as well as their quantities in the extracts produced under optimum ASE conditions (triplicate confirmatory experiments). The experimental response values were in good agreement with the predicted ones, with a coefficient of variance (CV) ranging from 0.16 to 11.77%.

3.4. Identification and Quantification of Phenolic Compounds by LC–DAD-MS

The Greek oregano extracts of ASE under the optimized conditions were analyzed for their phenolic compounds, and the main compounds are summarized in Table 5. Two predominant phenols, identified as rosmarinic acid and salvianolic acid B, were found to constitute 39% and 38% of the overall phenol content, respectively. The isomers of salvianolic acid (I, II, and III) and vicenin-2 accounted for 5.7% and 12% of total phenols, respectively. Irakli et al. [15] reported rosmarinic acid, followed by salvianolic acid isomer II and vicenin-2, as major phenols in the extract of oregano solid residues after steam distillation, while Chun et al. [19] revealed that the oregano extract’s primary phenol was rosmarinic acid, which was followed by caffeic acid. This variance in the phenol composition may result from variations in the plant material and/or from the extraction technique.

4. Conclusions

Accelerated solvent extracted phenolic extract of Greek oregano could be used as a rich source of phenolic compounds, as based on our findings, it displayed antioxidant activity. An optimization of the recovery of phenolic compounds from Greek oregano (O. vulgare spp. Hirtum) aerial parts by the ASE method was performed by using a central composite experimental design. The effect of the experimental factors (extraction time, extraction temperature, and methanol concentration) on five responses, namely extraction yield, TPC, TFC, and antioxidant activity (ABTS, DPPH) were tested. A higher methanol concentration is required for optimum extracts in terms of phenolic content and antioxidant activity. The extraction yield of phenolics from oregano increased with the increase in extraction temperature, while the total flavonoids content was impacted negatively by the increase in extraction time. The optimal extraction conditions were 140 °C extraction temperature, 9 min (3 cycles) of time and 74% methanol concentration. Under these conditions, the obtained response values were 31.4 g extract/100 g, 183.57 mg GAE/g extract, 298.54 mg CATE/g extract, 473.14 mg TE/g extract, and 298.38 mg TE/g extract for extraction yield, total phenolic content, total flavonoid content, and antioxidant activity by ABTS and DPPH assay, respectively. The LC-MS analysis indicated that the chemical composition of extracts was significantly influenced by the extraction conditions. Rosmarinic acid and salvianolic acid B were the most prevalent phenolic components in O. vulgare spp. hirtum extracts. The ASE process can be utilized for the extraction of bioactive compounds using green extraction solvents and optimization can lead to preserving phenolic content.

Author Contributions

Conceptualization, P.C.; methodology, P.C. and M.I.; software, M.I.; validation, P.C., M.I. and E.B.; formal analysis, C.P.; resources, P.C.; data curation, M.I. and E.B.; writing—original draft preparation, E.B. and C.P.; writing—review and editing, M.I. and P.C.; visualization, M.I. and E.B.; supervision, P.C.; project administration, P.C.; funding acquisition, P.C. All authors have read and agreed to the published version of the manuscript.

Funding

This research has been co-financed by the Action “Innovation Investment Plans” of Central Macedonia, Operational Program 2021-2027 (project code MIS 5179230).

Institutional Review Board Statement

Not applicable.

Informed Consent Statement

Not applicable.

Data Availability Statement

Data is contained within the article.

Conflicts of Interest

The authors declare no conflict of interest.

References

  1. Saha, S.; Walia, S.; Kundu, A.; Sharma, K.; Paul, R.K. Optimal extraction and fingerprinting of carotenoids by accelerated solvent extraction and liquid chromatography with tandem mass spectrometry. Food Chem. 2015, 177, 369–375. [Google Scholar] [CrossRef] [PubMed]
  2. Kellogg, J.J.; Wallace, E.D.; Graf, T.N.; Oberlies, N.H.; Cech, N.B. Conventional and accelerated-solvent extractions of green tea (Camellia sinensis) for metabolomics-based chemometrics. J. Pharm. Biomed. Anal. 2017, 145, 604–610. [Google Scholar] [CrossRef] [PubMed]
  3. Irakli, M.; Skendi, A.; Bouloumpasi, E.; Christaki, S.; Biliaderis, C.G.; Chatzopoulou, P. Sustainable recovery of phenolic compounds from distilled rosemary by-product using green extraction methods: Optimization, comparison, and antioxidant activity. Molecules 2023, 28, 6669. [Google Scholar] [CrossRef] [PubMed]
  4. Chamali, S.; Bendaoud, H.; Bouajila, J.; Camy, S.; Saadaoui, E.; Condoret, J.S.; Romdhane, M. Optimization of accelerated solvent extraction of bioactive compounds from Eucalyptus intertexta using response surface methodology and evaluation of its phenolic composition and biological activities. J. Appl. Res. Med. Aromat. Plants 2023, 35, 100464. [Google Scholar] [CrossRef]
  5. Pearson, C.H.; Cornish, K.; McMahan, C.M.; Rath, D.J.; Whalen, M. Natural rubber quantification in sunflower using an automated solvent extractor. Ind. Crop. Prod. 2010, 31, 469–475. [Google Scholar] [CrossRef]
  6. Gomes, S.V.; Portugal, L.A.; dos Anjos, J.P.; de Jesus, O.N.; de Oliveira, E.J.; David, J.P.; David, J.M. Accelerated solvent extraction of phenolic compounds exploiting a Box-Behnken design and quantification of five flavonoids by HPLC-DAD in Passiflora species. Microchem. J. 2017, 132, 28–35. [Google Scholar] [CrossRef]
  7. Şahin, F.; Güllüce, M.; Daferera, D.; Sökmen, A.; Sökmen, M.; Polissiou, M.; Agar, G.; Özer, H. Biological activities of the essential oils and methanol extract of Origanum vulgare ssp. vulgare in the Eastern Anatolia region of Turkey. Food Control 2004, 15, 549–557. [Google Scholar]
  8. Aligiannis, N.; Kalpoutzakis, E.; Mitaku, S.; Chinou, I.B. Composition and antimicrobial activity of the essential oils of two Origanum species. J. Agric. Food Chem. 2001, 49, 4168–4170. [Google Scholar] [CrossRef] [PubMed]
  9. Zhang, X.L.; Guo, Y.S.; Wang, C.H.; Li, G.Q.; Xu, J.J.; Chung, H.Y.; Ye, W.C.; Li, Y.L.; Wang, G.C. Phenolic compounds from Origanum vulgare and their antioxidant and antiviral activities. Food Chem. 2014, 152, 300–306. [Google Scholar] [CrossRef] [PubMed]
  10. Liang, C.H.; Chan, L.P.; Ding, H.Y.; So, E.C.; Lin, R.J.; Wang, H.M.; Chen, Y.-G.; Chou, T.H. Free radical scavenging activity of 4-(3,4-dihydroxybenzoyloxymethyl) phenyl-O-β-D-glucopyranoside from Origanum vulgare and its protection against oxidative damage. J. Agric. Food Chem. 2012, 60, 7690–7696. [Google Scholar] [CrossRef] [PubMed]
  11. Ding, H.Y.; Chou, T.H.; Liang, C.H. Antioxidant and antimelanogenic properties of rosmarinic acid methyl ester from Origanum vulgare. Food Chem. 2010, 123, 254–262. [Google Scholar] [CrossRef]
  12. Sivropoulou, A.; Papanikolaou, E.; Nikolaou, C.; Kokkini, S.; Lanaras, T.; Arsenakis, M. Antimicrobial and cytotoxic activities of Origanum essential oils. J. Agric. Food Chem. 1996, 44, 1202–1205. [Google Scholar] [CrossRef]
  13. Cvetanović, A.; Švarc-Gajić, J.; Mašković, P.; Savić, S.; Nikolić, L. Antioxidant and biological activity of chamomile extracts obtained by different techniques: Perspective of using superheated water for isolation of biologically active compounds. Ind. Crop. Prod. 2015, 65, 582–591. [Google Scholar] [CrossRef]
  14. Irakli, M.; Bouloumpasi, E.; Christaki, S.; Skendi, A.; Chatzopoulou, P. Modeling and Optimization of Phenolic Compounds from Sage (Salvia fruticosa L.) Post-Distillation Residues: Ultrasound- versus Microwave-Assisted Extraction. Antioxidants 2023, 12, 549. [Google Scholar] [CrossRef] [PubMed]
  15. Irakli, M.; Skendi, A.; Bouloumpasi, E.; Chatzopoulou, P.; Biliaderis, C.G. LC-MS Identification and Quantification of Phenolic Compounds in Solid Residues from the Essential Oil Industry. Antioxidants 2021, 10, 2016. [Google Scholar] [CrossRef] [PubMed]
  16. Freedman, D.A.; Freedman, D.A. A note on screening regression equations. Am. Stat. 1983, 37, 152–155. [Google Scholar] [CrossRef]
  17. Chew, K.K.; Khoo, M.Z.; Ng, S.Y.; Thoo, Y.Y.; Aida, W.W.; Ho, C.W. Effect of ethanol concentration, extraction time and extraction temperature on the recovery of phenolic compounds and antioxidant capacity of Orthosiphon stamineus extracts. Int. Food Res. J. 2011, 18, 1427. [Google Scholar]
  18. Liang, X.; Nielsen, N.J.; Christensen, J.H. Selective pressurized liquid extraction of plant secondary metabolites: Convallaria majalis L. as a case. Anal. Chim. Acta X 2020, 4, 100040. [Google Scholar] [CrossRef] [PubMed]
  19. Chun, S.S.; Vattem, D.A.; Lin, Y.T.; Shetty, K. Phenolic antioxidants from clonal oregano (Origanum vulgare) with antimicrobial activity against Helicobacter pylori. Process Biochem. 2005, 40, 809–816. [Google Scholar] [CrossRef]
Figure 1. Response surface plots of ASE conditions for extraction yield (a), TPC (b), TFC (c), ABTS (d), and DPPH (e,f) contents of oregano extract, in the function of methanol concentration (% methanol), time of extraction (time), and extraction temperature (temper.). The values of the missing factor were kept at the center point.
Engproc 67 00010 g001
Table 1. Levels of different independent variables in RSM for the optimization of oregano extracts by ASE.
Independent VariablesLevels
(−1)(0)(+1)
X1—solvent concentration (% v/v) 406080
X2—static extraction time (min)369
X3—extraction temperature (°C)80110140
Table 2. Regression equations for the modified quadratic models.
Regression Equation in Uncoded Units
Extraction Yield=33.70 − 3.98 X1 + 4.00 X3
TPC=183.96 + 6.93 X1 − 3.93 X12 + 6.43 X1 × X3
TFC=282.47 + 20.17 X1 − 11.67 X2 + 5.98 X1 × X2 + 25.63 X1 × X3 − 12.05 X32
ABTS=30.81 X1 × X2 + 26.94 X1 × X3
DPPH=352.58 + 41.20 X12 − 46.51 X22
Table 3. Analysis of variance (ANOVA) and descriptive statistics for the developed quadratic models.
TermYieldTPCTFCABTSDPPH
F-Value p-ValueF-Value p-ValueF-Value p-ValueF-Value p-ValueF-Value p-Value
Model13.650.00025.560.00656.150.00452.640.07323.660.0276
X156.86<0.000122.600.000816.440.00230.15190.70490.67100.4318
X21.450.25650.85050.37815.500.04100.00890.92680.31360.5878
X357.33<0.00010.26580.61741.470.25321.840.20450.16430.6938
X1X20.07000.79680.83680.38185.980.03456.500.02880.42810.5277
X1X30.13930.716811.400.007115.530.00284.970.04980.00250.9609
X2X31.580.23724.350.06360.05050.82670.86910.37321.630.2311
X124.050.07207.690.01974.290.06534.110.070213.770.0040
X220.87530.37150.00470.94671.760.21424.240.066517.540.0019
X320.01710.89852.600.13776.180.03220.14170.71450.15750.6998
Lack of fit2.580.16100.77870.60482.620.15684.640.05884.630.0591
R20.92470.83340.84700.70380.7673
R2adj.0.85700.70340.70930.43720.5578
C.V.% *5.853.006.998.1414.25
* C.V.%: coefficient of variation.
Table 4. Predicted and experimental values of each response at optimized conditions.
ResponsesPredictedExperimental 1% Differences (CV)
Extraction Yield (%)33.7 ± 2.031.44 ± 0.514.91
TPC (mg GAE/g)184.0 ± 5.4183.57 ± 2.470.16
TFC (mg CATEg)282.5 ± 18.4 298.54 ± 6.543.90
ABTS (mg TE/g)421.8 ± 34.2473.14 ± 21.148.11
DPPH (mg TE/g)352.6 ± 42.1298.38 ± 5.8011.77
1 Values are means of three replicates.
Table 5. Main phenolic compounds identified in optimized oregano extracts.
Phenolic CompoundsMean Value ± Standard Deviation 1
(mg/g Extract)
Rosmarinic acid173.16 ± 8.16
Salvianolic acid B166.24 ± 16.24
Vicenin-254.01 ± 0.99
Salvianolic acid isomer III8.55 ± 0.25
Salvianolic acid isomer II8.43 ± 0.31
Salvianolic acid isomer I8.05 ± 0.40
Eriodictyol6.44 ± 0.08
Carvacrol4.40 ± 0.60
Taxifolin2.75 ± 0.10
Naringenin2.28 ± 0.07
Cryptochlorogenic acid1.22 ± 0.03
Luteolin1.15 ± 0.12
Caffeic acid1.05 ± 0.08
Aromadendrin0.82 ± 0.03
Apigenin0.65 ± 0.05
Apigenin-7-O-glucoside0.56 ± 0.06
Total phenolics439.76 ± 23.53
1 Values are means of three replicates.
Disclaimer/Publisher’s Note: The statements, opinions and data contained in all publications are solely those of the individual author(s) and contributor(s) and not of MDPI and/or the editor(s). MDPI and/or the editor(s) disclaim responsibility for any injury to people or property resulting from any ideas, methods, instructions or products referred to in the content.

