Proceeding Paper

Evaluation of Water Quality’s Influence on the Water Discharge of a Nuclear Power Plant (Non-Radiative Impact Factor) †

Institute of Agroecology and Land Management, National University of Water and Environmental Engineering, 33028 Rivne, Ukraine
*
Author to whom correspondence should be addressed.
Presented at the 3rd International Electronic Conference on Processes—Green and Sustainable Process Engineering and Process Systems Engineering (ECP 2024), 29–31 May 2024; Available online: https://sciforum.net/event/ECP2024.
Eng. Proc. 2024, 67(1), 3; https://doi.org/10.3390/engproc2024067003
Published: 5 July 2024

Abstract

:
This study examines the environmental impact of a nuclear power plant’s (NPP) open-cycle cooling systems (CCSs), focusing on the Rivne NPP in Ukraine. Regulatory standards from the Water Code of Ukraine and the EU’s Water Framework Directive guide the analysis. Over four years (2019–2022), water quality indicators were monitored. Results show compliance with regulatory standards for makeup and cooling water, with pH levels within the range of 6.5–8.5. Total dissolved solids (TDS) remained below 500 mg/dm3, while total hardness (TH) did not exceed 200 mg/dm3 as CaCO3. Salinity components, including Cl, SO42−, Na+, and K+, were within acceptable limits. Biogenic compounds, such as PO43− and N-NH3, occasionally exceeded maximum permissible concentrations in the receiving Styr River. Chemical oxygen demand levels were consistently below 30 mg/dm3. Pearson’s correlation coefficient and principal component analysis revealed strong relationships between water quality indicators. TH and SO42− were identified as dominant components in CCS water discharge, remaining below prescribed maximum permissible discharge limits. Overall, this study indicates that there is no negative non-radiological impact of water discharge of polluting chemicals with the effluent of the Rivne NPP CCS on the surface waters of the Styr River.

1. Introduction

1.1. Environmental Impact of Nuclear Energy

Nuclear energy represents an environmentally sustainable form of activity as it does not produce greenhouse gas emissions, unlike thermal energy [1]. Nonetheless, nuclear power plants (NPPs) exert both radiative and non-radiative impacts on the environment [2]. While the radiative impact has been extensively investigated and documented in the literature [3], the non-radiative impact primarily stems from the release of chemical substances into the atmosphere and discharge into water bodies [4].

1.2. Water Requirements of NPPs and Regulatory Framework

At NPPs, a continuous supply of fresh water with specific physicochemical properties is essential for electricity generation [5]. Open-cycle cooling systems (CCSs) are commonly employed in NPP design solutions [6]. Moreover, the suitability of water for cooling is determined by an analysis of its quality indicators [6,7]. National regulations establish normalized values (NVs) for makeup and cooling water quality in CCSs. The Water Code of Ukraine (WCU) [8] and the Water Framework Directive (WFD) [9] are key documents governing the environmental impact of water discharge. The WCU sets environmental quality standards, including the maximum permissible concentration (MPC) of substances in water, which assess water suitability for specific purposes [10,11,12,13,14]. However, the discharge of substances is restricted by the maximum permissible discharge (MPD) of pollutants with wastewater, determined as the maximum allowable amount from an environmental perspective [15]. European water discharge regulations follow a combined approach based on the principles of caution or prudence, focusing on mitigating environmental harm at its source through the establishment of environmental quality standards (EQSs) [9]. EQSs include annual average (AA-EQS) and maximum allowable (MAC-EQS) discharge limits [16]. In Ukraine, MPD values are compared with actual annual average and maximum discharge values (ADmax and Adav) to assess compliance.

1.3. Regulation of Pollutant Discharges and Water Protection Activities

Regulating pollutant discharge with wastewater is a primary strategy for improving surface water quality, as governmental environmental standards and support for green technological innovations can mitigate environmental pollution [15,16]. Regulating anthropogenic load on surface waters through discharge limits is crucial, with national legislation establishing limiting values for specific items in discharged water. Furthermore, notable reductions in industrial pollutant emissions are observed in regions with stringent environmental regulations. Rational industrial pollutant discharge is pivotal for environmental harmony, complementing economic development. Discharge of cooling water is a form of special water use, conducted under permits [16]. The MPD and the list of monitored substances in discharged water are determined for each specific discharge of cooling water [17,18].

1.4. Underestimation of Non-Radiative Impacts and the Need for Their Assessment

Therefore, insufficient attention is given to assessing the non-radiative impact of NPPs with water discharges on the environment, although this warrants improvement, as NPP operations can have significant environmental consequences. There are several scientific studies that have investigated the non-radiative impacts of wastewater from NPPs. One study examined [19] the release of various chemical substances into the atmosphere and water bodies from NPPs, highlighting the significant non-radiative environmental impacts. Another significant body of work focuses on how national and European regulations address the discharge of pollutants from NPPs [20]. These studies discuss the implementation of EQSs and MPD limits to regulate and minimize the impact of wastewater discharge, assessing pollutant levels in discharged water against environmental norms and evaluating their effects on aquatic ecosystems. Exceeding environmental norms can adversely affect the ecological status of water bodies. The objective of this study is to assess the quality of the makeup, cooling, and return water of the NPP CCS and the natural water of the water body into which the plant discharge water is released.

2. Materials and Methods

The CCS of the Rivne NPP cooling water was chosen as the research object. The Rivne NPP—a nuclear power plant located in the west of Ukraine—has four power units of the VVER type with a total power of 2835 MW. The water intake and discharge of the cooling water CCS of the Rivne NPP are carried out in the Styr River [21], a reservoir for fishing purposes, according to environmental standards [12,13,14]. For the assessment of surface water quality indicators of the Styr River, MPC was used, for process water, NVs were used, and for the discharge value, MPD was used, as shown in Table 1.
MPD values for the CCS of the Rivne NPP were calculated by the direct calculation method according to [11,14] and are presented in [18]. The value of actual discount AD (t/year) for the indicator was calculated for (1).
AD = MEC · BD
where MEC is the measured environmental concentration, t/m3; BD is the blow-down water rate of the CCS, m3/year.
In addition, the correlation of water quality indicators for the Styr River water and the makeup and cooling water CCS of the Rivne NPP was determined using Pearson’s correlation coefficient. Principal component analysis (PCA) was used to identify relationships between hydrochemical parameters according to [24]. Sampling and monitoring of water quality indicators was carried out by the Rivne NPP certified measuring laboratory (certificate of recognition of measuring capabilities no. R-8/11-57-5, dated 22.12.17). The concentration of water quality indicators was monitored weekly during 2019–2022. Standard measurement methods were employed as follows: pH and TDS were measured using electrochemical methods; Cl, TH, and COD were determined using titrimetric techniques; SO42−, PO43−, NO3, and N-NH3 were analyzed via photometric methods; TSS was assessed gravimetrically; and ΣNa+ and K+ were quantified using flame photometry methods, in accordance with recommendations [7].

3. Results and Discussion

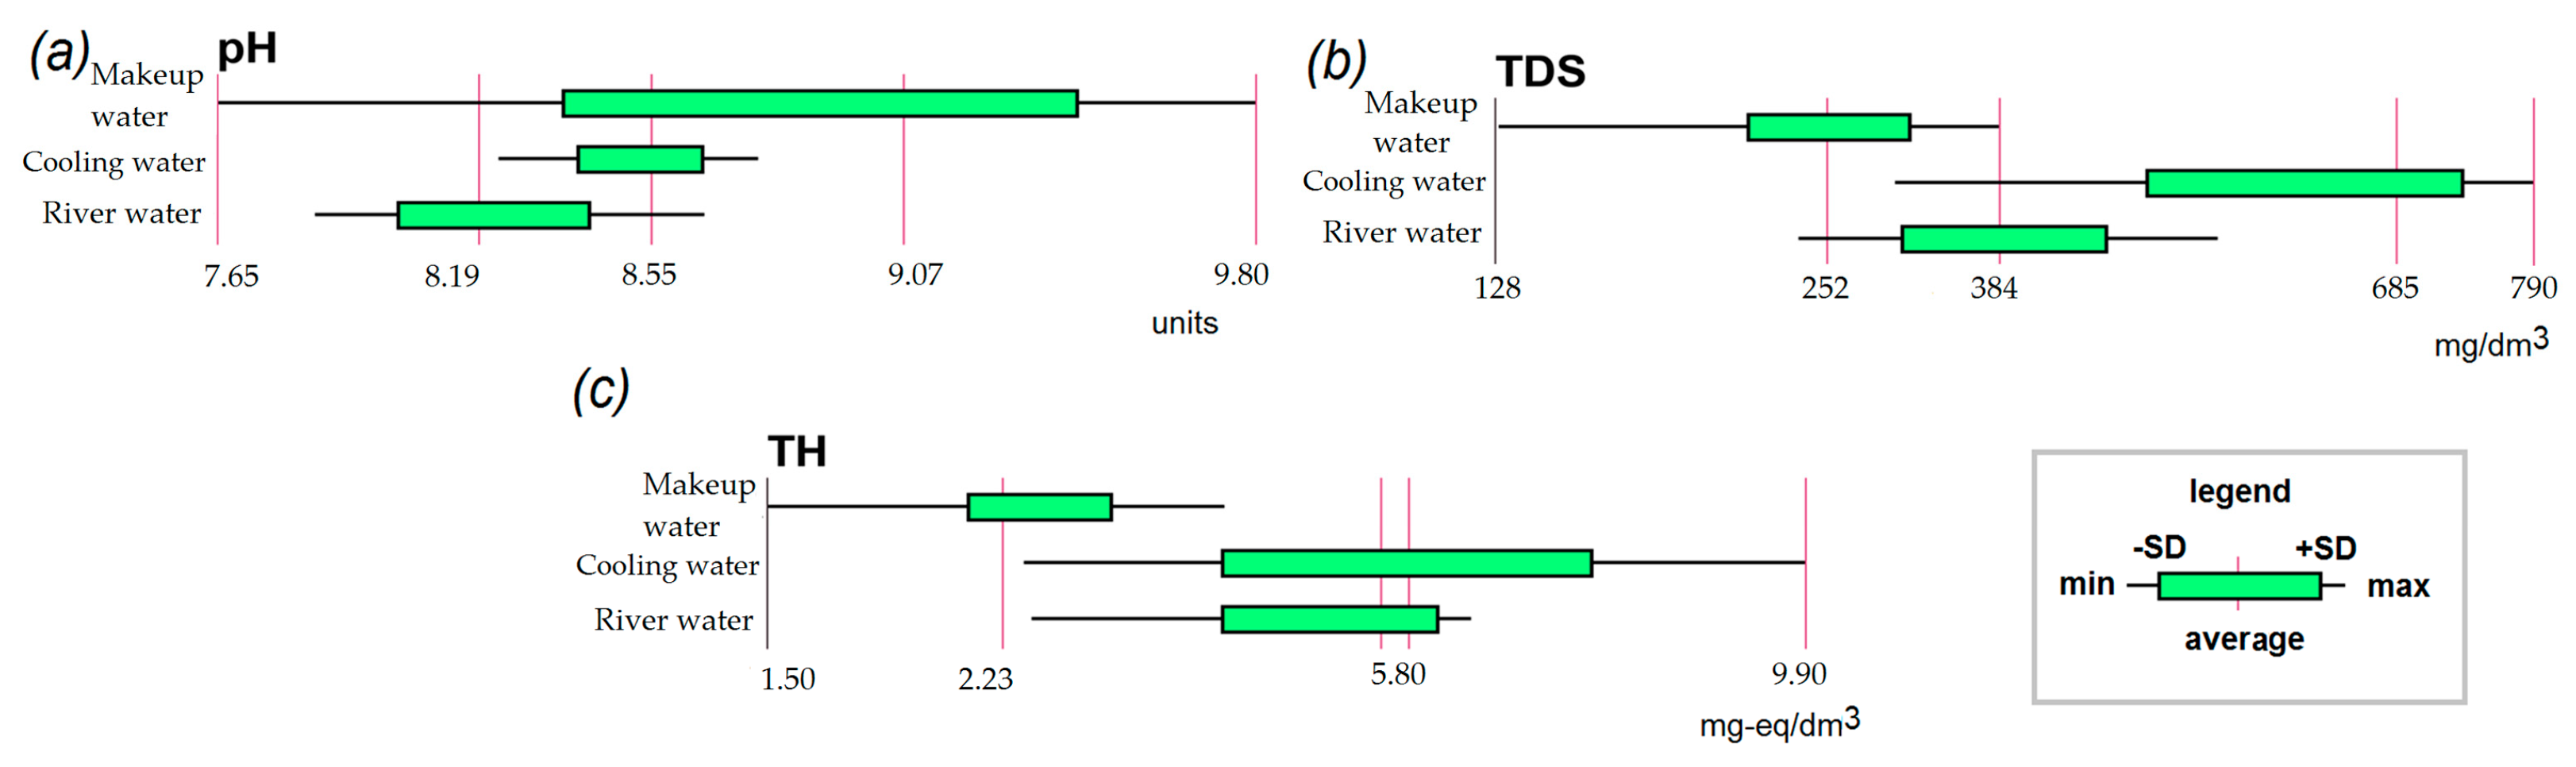
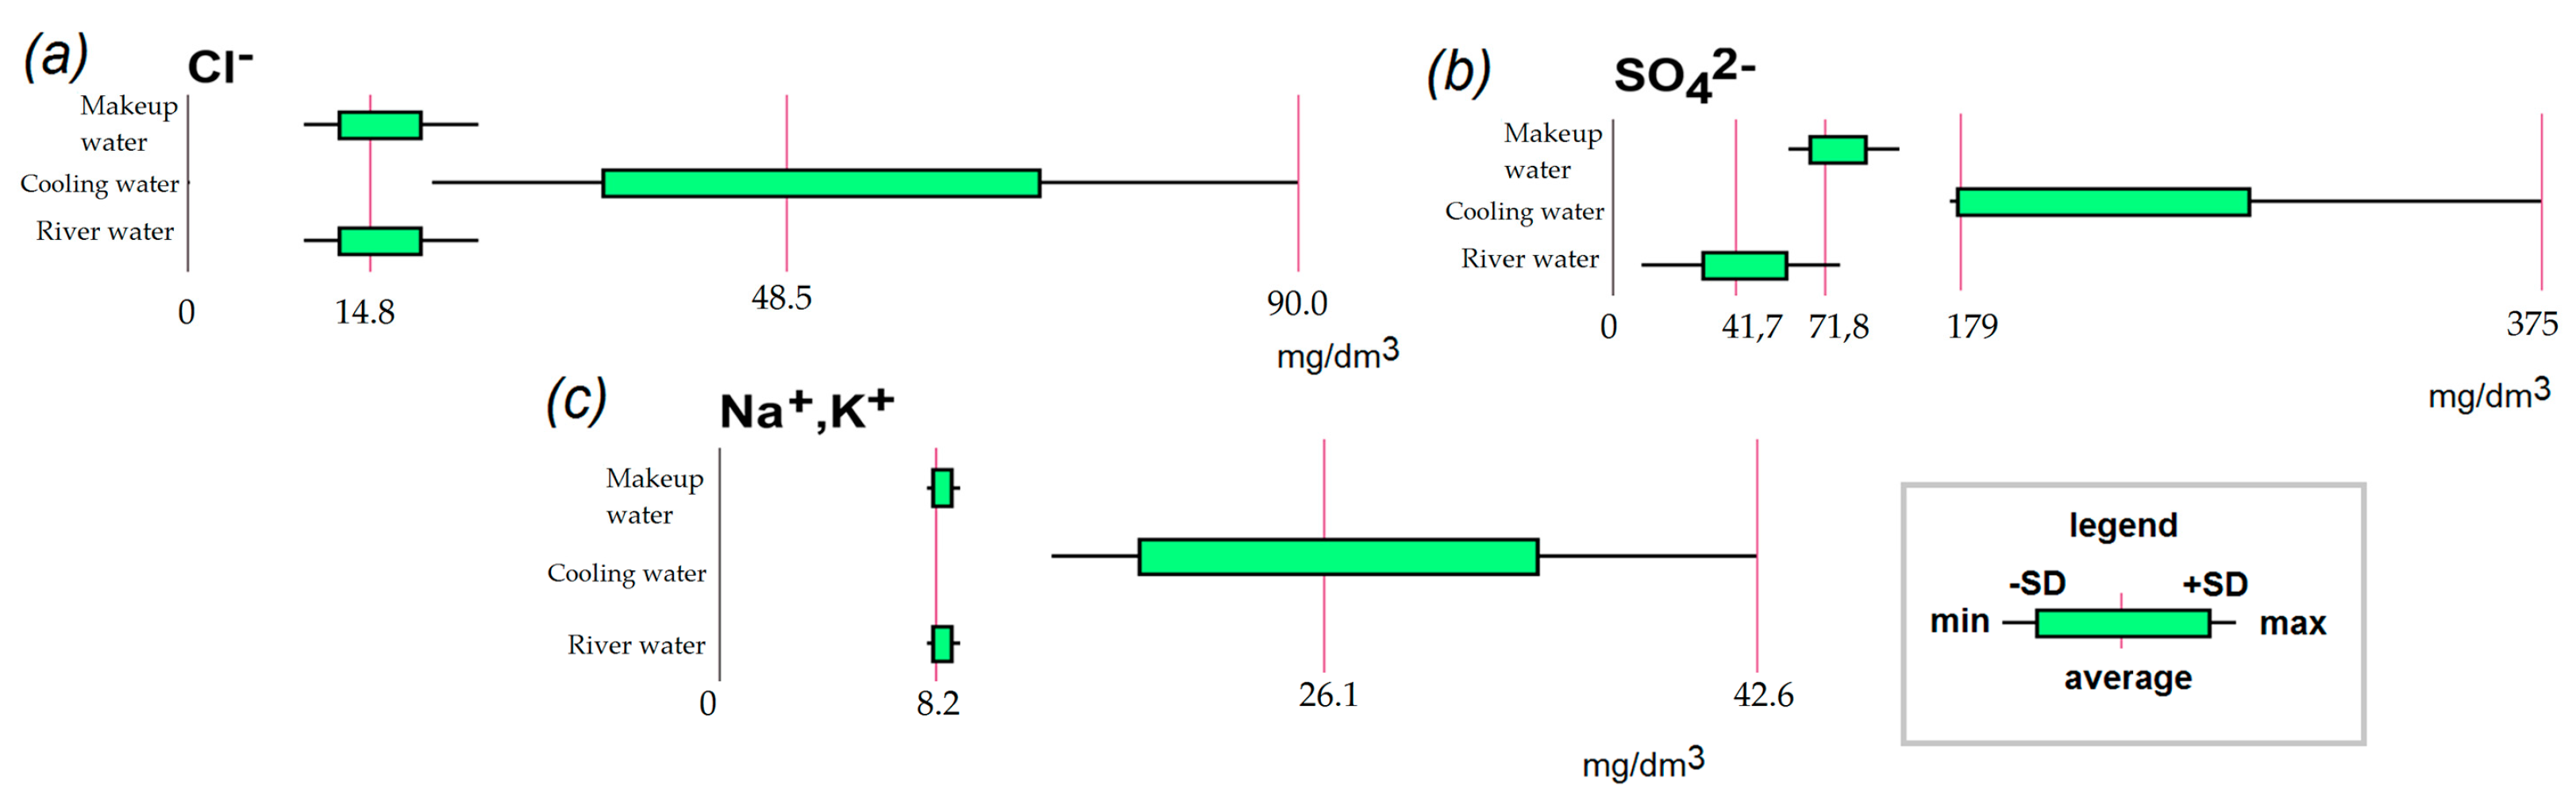
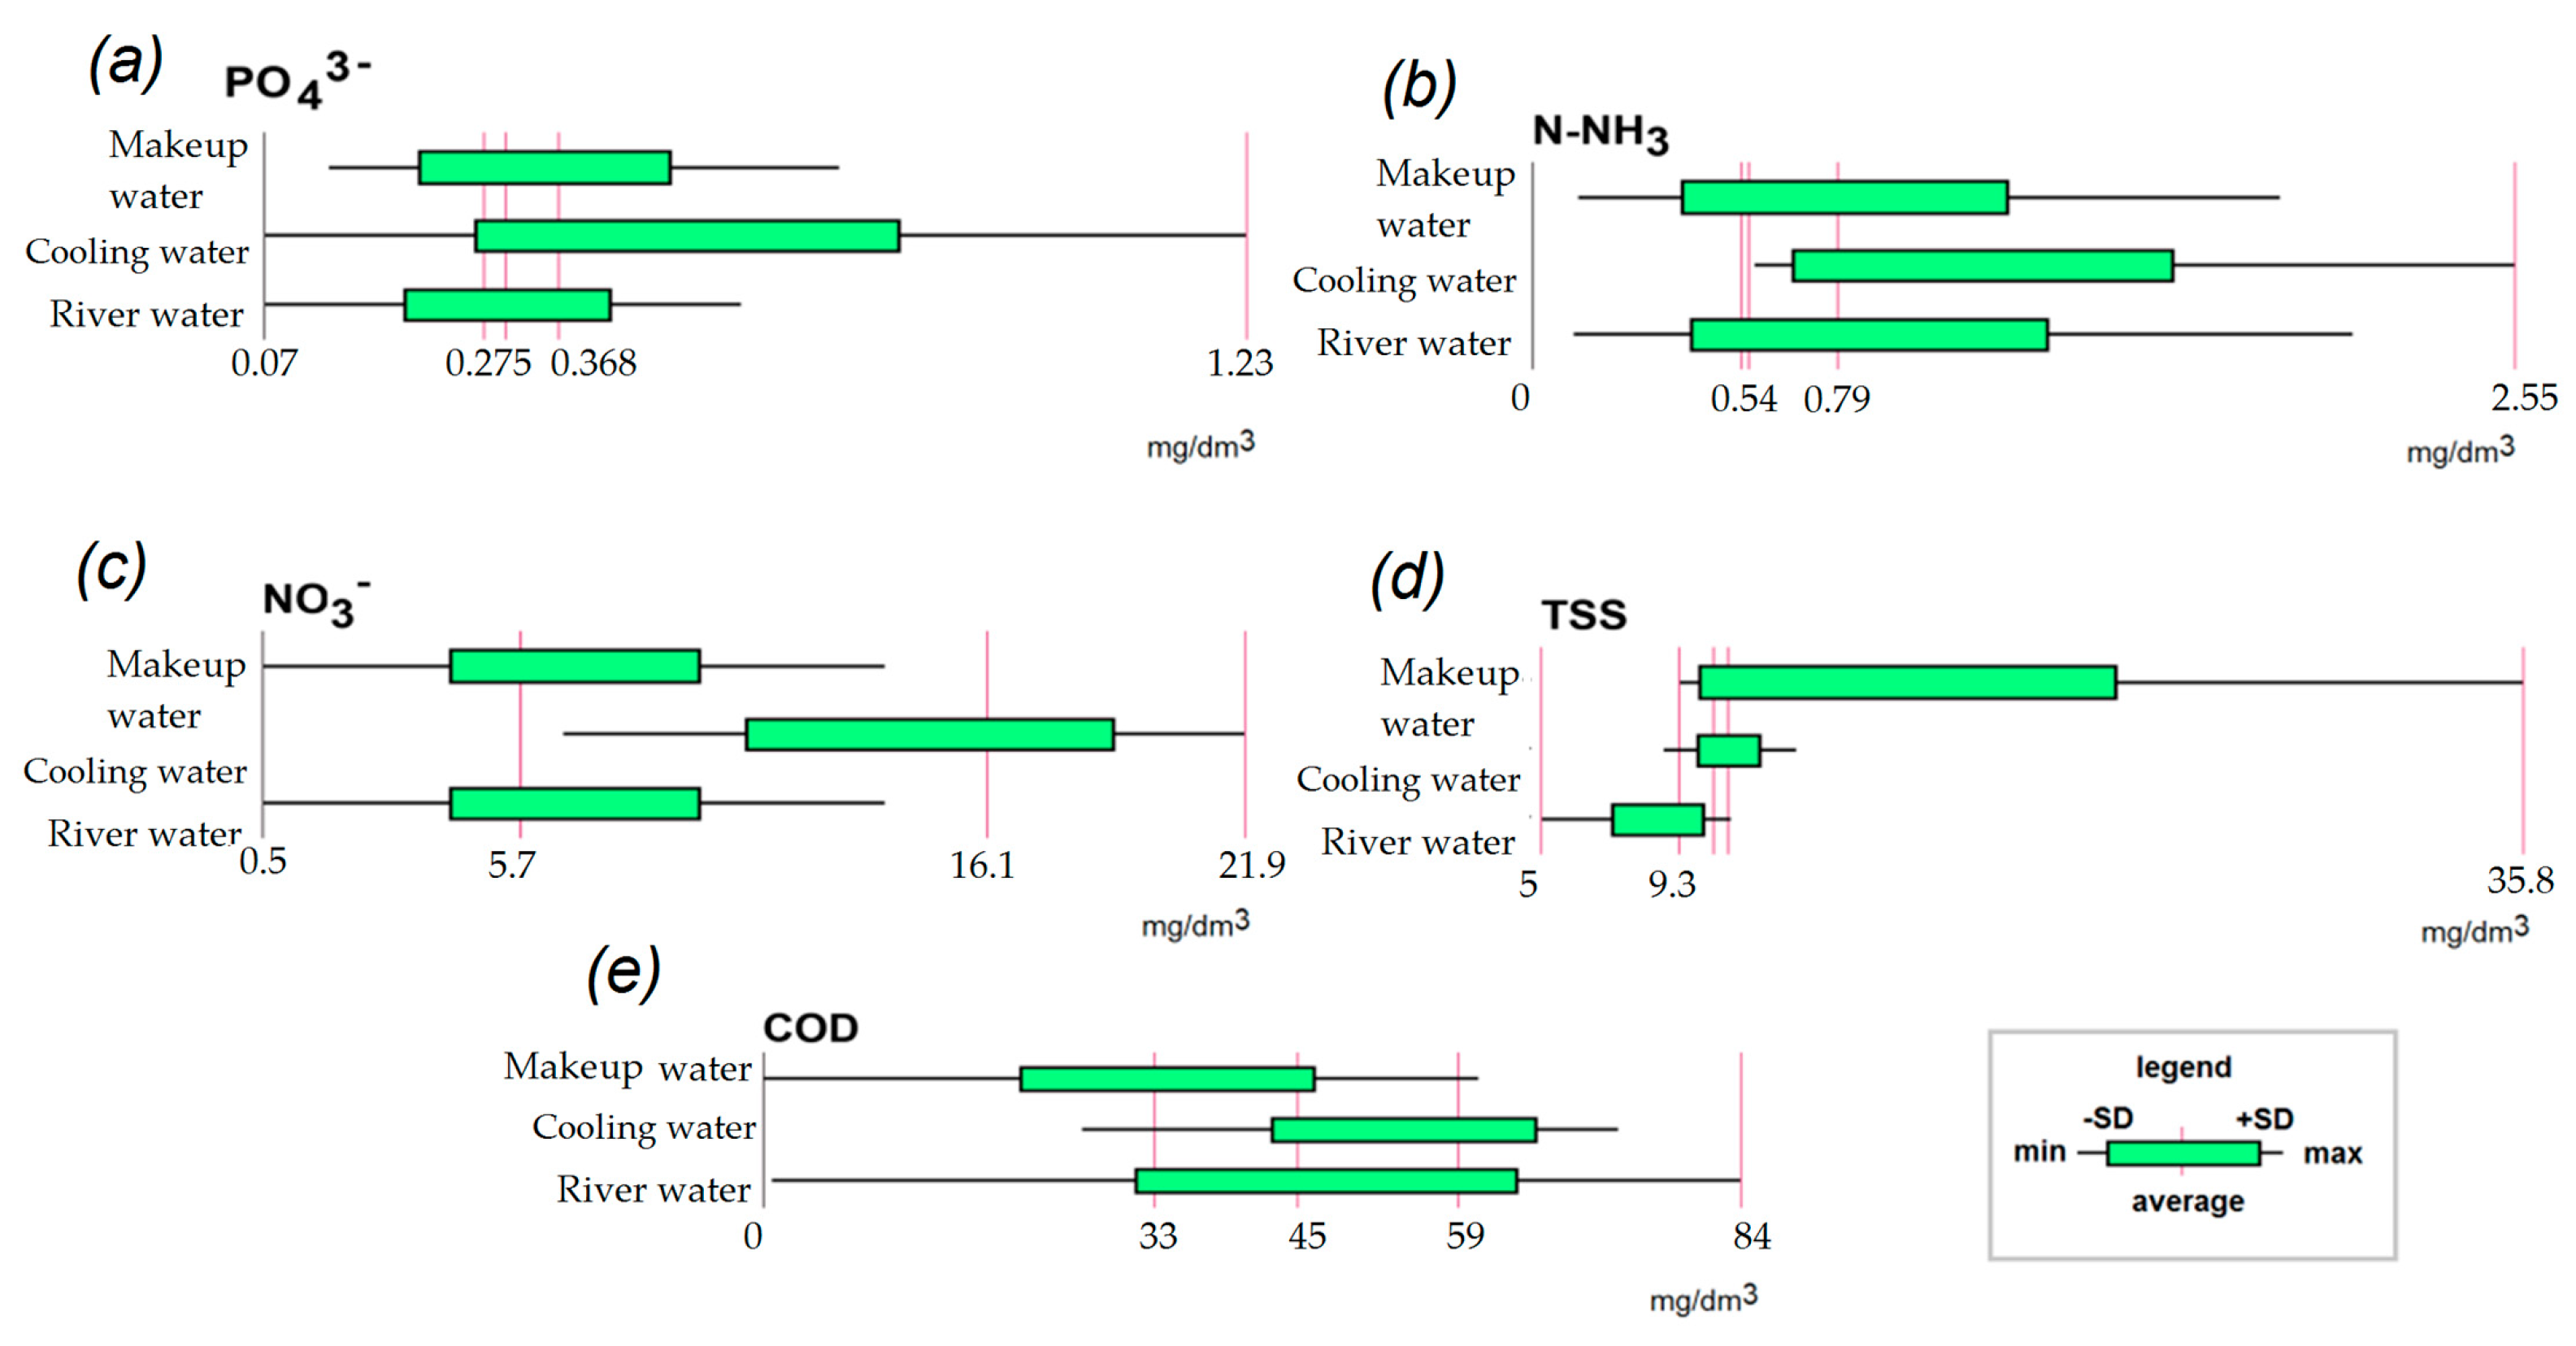
3.1. Analysis of Changes in Styr River Water and Rivne NPP Process Water Indicators

Makeup water is constantly added to the CCS in an amount dependent on the continuous processes of evaporation and water discharge [25]. It is worth noting that the quality parameter requirements for makeup water are more restrictive (Table 1) than for cooling water. Changes in the quality indicators of makeup and cooling water in the CCS of the Rivne NPP and water from the Styr River are illustrated in Figure 1, Figure 2 and Figure 3. The pH values of process waters determine the intensity of corrosive processes; the actual pH values of makeup and cooling water from 2019 to 2022 did not exceed the specified values (Figure 1a). In natural waters, pH is determined by components of the carbonate system and depends on the presence of weak organic acids and hydrolyzing heavy metal salts. The pH variation demonstrates seasonal fluctuations, with higher values in the summer due to intensive photosynthesis and lower values in the winter due to destructive processes, leading to CO2 accumulation in the water. Total dissolved solids (TDS) serve as a measure of dissolved ionic forms in the water; the values increase with higher ion content, and elevated ion levels may lead to scale formation, while TDS values outside the prescribed range may induce metal corrosion and salt deposition on the heat exchanger pipes of the CCS consumers [21]. Actual TDS values did not exceed the specified values, although during warmer periods of the year, they approached the upper limit (Figure 1b) for cooling water. Total hardness (TH) is an indicator determining the total content of Ca2+ and Mg2+ ions and corresponds to scale formation in the CCS; thus, it is important to limit their content [22]. In fact, for makeup and cooling water from 2019 to 2022, TH values did not exceed the specified limits. Discharge of cooling water based on TDS and TH indicators did not exceed the MPC for river water (Figure 1c). Short-term exceedances of the actual TH concentration in the Styr River water, not associated with the activities of the Rivne NPP, were observed even upstream of the Rivne NPP water intake.
The ions Cl, SO42−, Na+, and K+ serve as salinity components (major ions) and enter surface waters through the dissolution of various geological formations, minerals, salts, etc., in water. Consequently, their concentration in surface waters fluctuates due to hydrological factors and exhibits seasonal variability; with increased water runoff in spring, their concentration increases, while conversely, it increases during periods of reduced flow in the summer–autumn and winter. Saline components in process waters contribute to corrosion processes and scale formation in CCSs. Indeed, for makeup and cooling water during the period of 2019–2022, the concentration values of saline components did not exceed the established normative values (NVs), and the discharge of cooling water based on these indicators did not lead to the exceeding of maximum permissible concentrations (MPCs) for water in the river (Figure 2).
Phosphorus (PO43−) and nitrogen compounds (N-NH3, NO3) are classified as biogenic elements and are crucial for the development of organisms. However, the influx of these compounds into technological waters contributes to the proliferation of biological contamination in CCSs, leading to operational issues. Consequently, short-term exceedances of the actual concentrations of N-NH3, NO3, and PO43− in the Styr River water above the MPC are observed, which are not associated with the activity of the Rivne NPP but are recorded in the Styr River water upstream of the Rivne NPP intake (Figure 3a–c). In fact, for makeup and cooling water during 2019–2022, the concentrations of N-NH3, NO3, and PO43− did not exceed the NVs (Figure 3a–c).
The concentration of TSS is formed by insoluble compound particles of sand, clay, iron, and manganese, with the actual TSS values not exceeding the NVs; excesses of the MPC for water in the Styr River were not recorded (Figure 3d). COD is an indicator of the content of organic substances capable of chemical oxidation. For COD concentration in makeup and cooling water, no NVs were established. It is worth noting that the COD concentration in the water of the Styr River exceeded the MPC (Figure 3e). Seasonal temperature variations further influence the operational dynamics of the Rivne NPP’s cooling water systems and the Styr River. During summer, higher water temperatures prevail, driven by increased ambient temperatures, which can affect water quality parameters such as pH and dissolved oxygen levels. Conversely, winter temperatures tend to decrease, potentially leading to lower pH due to increased dissolved CO2 from the atmosphere [25]. These temperature fluctuations impact the thermal regime of the cooling water discharged from the CCS, influencing its interaction with aquatic ecosystems.
The analysis of the Styr water and Rivne NPP process water showed that they mostly comply with the established NVs and do not exceed MPCs for river water. The values of pH, TH, and TDS remained within the norms, although seasonal fluctuations affected these parameters [26]. The concentrations of major ions and nutrients were also under control, although short-term exceedances were observed upstream of the river, not related to NPP activities [27]. The detected exceedances of COD in the Styr water indicate the presence of organic pollution [19]. Seasonal temperature changes affect the water quality and efficiency of NPP cooling systems, which emphasizes the importance of continuous monitoring and adaptive management.

3.2. Correlation of Water Quality Indicators for the Styr River Water and the Rivne NPP Technological Water

The statistical calculation of Pearson’s coefficients was used to identify the closeness of the relationship between the monitored indicators (Table 2), which allows us to determine the limiting parameters and increase the efficiency of CCS operation [28]. Strong correlations (|0.7–1.0|) have been observed between indicators of the Styr River: TSD and salinity components (Cl, SO42−); and TDS and TH. Additionally, strong correlations (|0.5–0.7|) are evident between pH and TDS; salinity components; and biogenic element compounds (PO43−, N-NH3, NO3), as well as between COD and biogenic element compounds. Other correlation links are noted as weak (|0.3–0.5|), and if the connection is very weak, they are not considered (−0.3–0.3). Therefore, the correlation values for the makeup water (Table 2) replicate the identified correlation tendencies for the Styr River, except for the inverse relationship between pH and TH, which is attributed to the water treatment process, as softening by lime reduces TH and increases pH [4]. On the other hand, the correlation values for cooling water (Table 2) also replicate the identified tendencies; however, the relationship between pH and TH is positively average, which can be explained by scaling processes in the CCS.
For the identified correlation dependencies, it can be generalized for the investigated indicators that the content of soluble components is closely associated with TDS and is independent of pH, while the contents of compounds are closely associated with each other and with COD. Clusters of principal components of makeup water, cooling water, and the Styr River water with a confidence ellipse at a 95% level of confidence are presented in Figure 4. Overlapping ellipses with closed parameter values indicate that there is not a high spatial statistical difference in principal components of parameters, suggesting similar compositions and patterns in makeup water, cooling water, and Styr River water. Moreover, the loading biplot of principal components demonstrates that PC1 accounts for 57.33% of variance, followed by 18.66% by PC2 scattered in distinct vector groups. In this context, SO42−, N-NH3, and PO43− are more closely related to each other and have an influence on PC1, while Na+, K+, COD, pH, and Cl are closely related to each other and have negative loadings on PC1 and positive loadings on PC2. Overall, PCA showed a close association between all variables influencing the two PCs. Pearson correlation also reveals a good deal of significant positive or negative relationships of parameters of makeup water, cooling water, and the Styr River water [29,30].

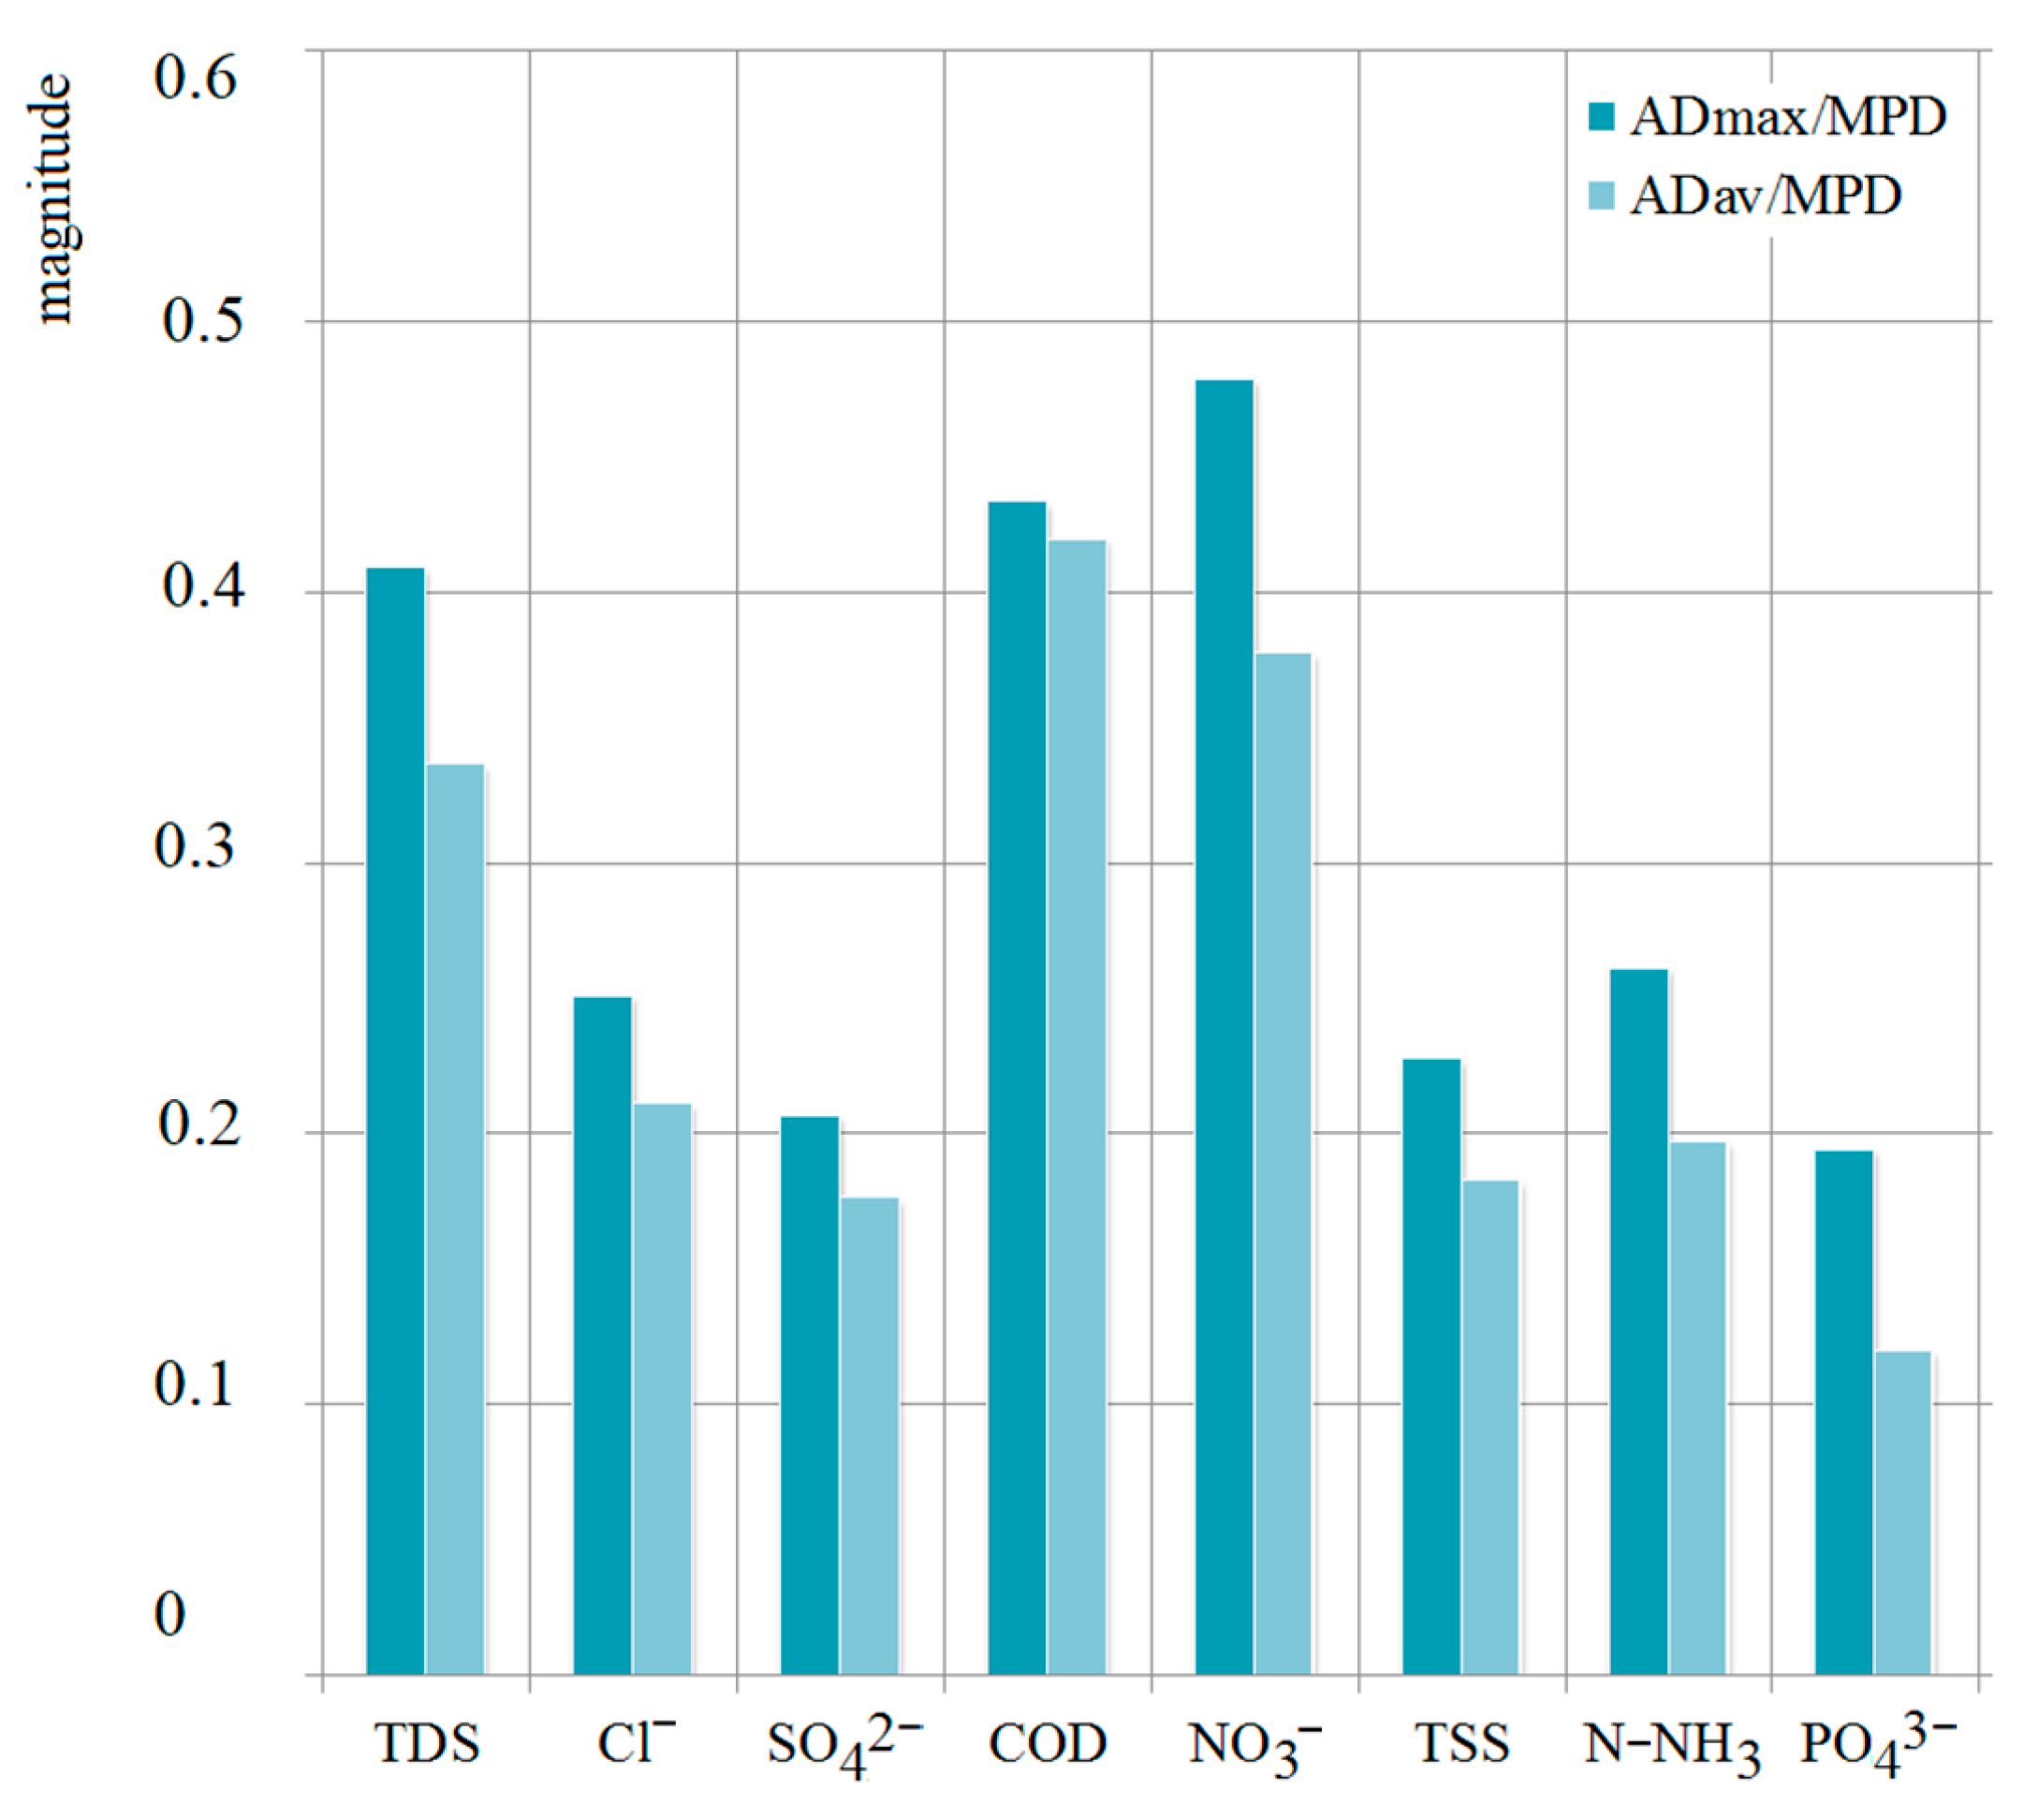
3.3. Identification of Dominant Components of CCS Water Discharge from Rivne

The analysis of the distribution of indicators of cooling water quality, which form the water discharge CCS of the Rivne NPP, indicates that among the components of the cooling water discharge CCS of the Rivne NPP, SO42− and TH (Ca2+, Mg2+) predominate, comprising up to 68%. However, the contribution of the total content of NO3, Cl, K+, Na+, and COD accounts for up to 26% of the total quantity. The actual annual discharge of components based on average (ADav) and maximum (ADmax) values of water discharge is significantly lower than the prescribed MPD values, indicating a limitation in the influx of pollutants with discharged waters (Figure 5). To maintain the optimal water–chemical regime of the cooling water CCS, corrective treatment with the addition of chemical reagents should be conducted; however, this affects the discharge of corrective reagents and requires the establishment of MPD for the water discharge component [22].
Based on this study, it can be argued that proper monitoring and chemical control of the quality indicators of technological, return, and natural waters help ensure the ecological state of the water body. Considering the impact of chemical quality indicators on technological processes regarding damage and failures related to chemistry, proper attention should be given not only from an environmental but also from a technological point of view regarding NPP operation. The above-mentioned research results provide some insight into how to prevent technological failures related to chemistry and ensure compliance with environmental standards. Further research is needed in terms of modeling and testing general industrial conditions rather than those specific to one NPP. After all, there is a risk of pollutants from discharged waters reaching the Styr River and reaching the discharge limit. However, it is advisable to continuously monitor parameters and assess the quality of technological water CCSs and water in the water body within the influence zone of NPP water discharges in order to prevent unwanted phenomena.

4. Conclusions

Over the monitoring period from 2019 to 2022, it was observed that the quality of makeup and cooling water generally adhered to regulatory standards, with parameters such as pH, TDS, and TH within acceptable limits. However, occasional exceedances of MPCs for PO43− and N-NH3 in the receiving Styr River suggest the need for more stringent monitoring and control measures. COD levels, although consistently below regulatory thresholds, warrant continued attention. The Pearson’s correlation coefficient and PCA provided insights into the relationships between water quality indicators, aiding in the identification of dominant components in CCS water discharge. Strong correlations were identified between quality indicators, particularly TDS, pH, and composite indicators (salinity and biogenic element compounds). Actual discharge of pollutants does not exceed 50% of the MPD values, with up to 68% dominated by SO42− and TH (Ca2+, Mg2+). Overall, this study emphasizes the necessity of comprehensive monitoring programs and adaptive management strategies to safeguard the ecological integrity of water bodies surrounding NPPs. Continued research efforts are warranted to assess long-term environmental impacts for sustainable NPP operation.

Author Contributions

Conceptualization, P.K. and O.B.; methodology, A.P. and O.Y.; formal analysis, P.K.; investigation, P.K. and O.Y.; resources, A.P.; writing—original draft preparation, P.K. and O.B.; writing—review and editing, P.K. and A.P.; visualization, P.K.; supervision, A.P. All authors have read and agreed to the published version of the manuscript.

Funding

This research received no external funding.

Institutional Review Board Statement

Not applicable.

Informed Consent Statement

Not applicable.

Data Availability Statement

Data are contained within the paper.

Conflicts of Interest

The authors declare no conflicts of interest.

References

  1. Mohamed, M.; Zakuan, N.D.; Tengku Hassan, T.N.A.; Lock, S.S.M.; Mohd Shariff, A. Global Development and Readiness of Nuclear Fusion Technology as the Alternative Source for Clean Energy Supply. Sustainability 2024, 16, 4089. [Google Scholar] [CrossRef]
  2. Khajuria, A.; Alajangi, H.; Singh, J.; Passi, G.; Barnwal, R.P.; Singh, G.; Kaur, I.P. Applications of Nanotechnology in Converging the Biomarker Science for Advancement in Cancer Detection and Treatment. In Handbook of Oncobiology: From Basic to Clinical Sciences; Sobti, R.C., Ganguly, N.K., Kumar, R., Eds.; Springer: Singapore, 2023. [Google Scholar] [CrossRef]
  3. Kuznietsov, P.; Biedunkova, O. Experimental Tests of Biocidal Treatment for Cooling Water of Safety Systems at Rivne NPP Units. Nucl. Radiat. Saf. 2023, 97, 30–40. [Google Scholar] [CrossRef] [PubMed]
  4. Kuznietsov, P.; Biedunkova, O. Evaluating the impact of dispersed particles in the water of a power plant recirculating cooling system on the discharge of suspended solids into a natural water body. East.-Eur. J. Enterp. Technol. 2023, 6, 6–16. [Google Scholar] [CrossRef]
  5. Kuznietsov, P.; Biedunkova, O. Assessment of the Impact of Organic Matter Discharge from a Nuclear Power Plant with a Recirculating Cooling Water System. Water Air Soil Pollut. 2024, 235, 221. [Google Scholar] [CrossRef]
  6. Kuznietsov, P. Evaluation of the scaling and corrosive potential of the cooling water supply system of a nuclear power plant based on the physicochemical control dataset. Data Brief 2024, 54, 110347. [Google Scholar] [CrossRef] [PubMed]
  7. Engineering, Scientific and Technical Support. The Water-Chemical Regime of the Technical Water Supply System of Responsible Consumers of NPP with VVER. General Requirements. SOU NAEK 067:2023. 2023, p. 70. Available online: https://online.budstandart.com/ua/catalog/doc-page.html?id_doc=109230 (accessed on 4 July 2024). (In Ukrainian).
  8. The Water Code of Ukraine. 1995. Available online: https://zakon.rada.gov.ua/laws/show/213/95-%D0%B2%D1%80#Text (accessed on 4 July 2024). (In Ukrainian)
  9. Directive 2000/60/EC of the European Parliament and of the Council of 23 October 2000 Establishing a Framework for Community Action in the Field of Water Policy. 2000. Available online: https://eur-lex.europa.eu/legal-content/EN/TXT/?uri=celex%3A32000L0060 (accessed on 4 July 2024).
  10. Hygienic Water Quality Standards for Water Bodies to Meet the Drinking, Household and Other Needs of the Population. 2022. Available online: https://zakon.rada.gov.ua/laws/show/z0524-22#Text (accessed on 4 July 2024). (In Ukrainian)
  11. List of Maximum Permissible Concentrations and Approximate Safe Exposure Levels of Harmful Substances for Water of Fishery Reservoirs, Order Dated August 31, 2017 No. 473 On Approval of the List of Industry Standards and Other Normative Documents Equivalent to Them of the Former USSR, Which Will Be Used in Hydrometeorological Activities until January 1, 2025. 1990. Available online: https://online.budstandart.com/ua/catalog/doc-page.html?id_doc=75723 (accessed on 4 July 2024). (In Ukrainian).
  12. Environmental Safety Standards for Water Bodies Used for Fisheries, Regarding Maximum Permissible Concentrations of Organic and Mineral Substances in Sea and Fresh Waters (Biochemical Oxygen Demand (BOD-5), Chemical Oxygen Demand (COD), Suspended Solids and Ammonium Nitrogen). 2012. Available online: https://zakon.rada.gov.ua/laws/show/z1369-12 (accessed on 4 July 2024). (In Ukrainian)
  13. SOU 05.01-37-385:2006. Water of Fishery Enterprises. General Requirements and Norms. 2006. Available online: http://kv.darg.gov.ua/index.php?lang_id=1.&content_id=2345&lp=26 (accessed on 4 July 2024). (In Ukrainian)
  14. GSTU 2284:2010; Live Fish. General Technical Requirements. General Specifications. Ukraine National Standard, Derzhspozhyvstandart Ukrainy: Kyiv, Ukraine, 2012. Available online: https://zakon.rada.gov.ua/laws/show/z1369-12#Text (accessed on 4 July 2024). (In Ukrainian)
  15. Rules for the Protection of Surface Waters from Pollution by Wastewater. 2013. Available online: https://zakon.rada.gov.ua/laws/show/465-99-п (accessed on 4 July 2024). (In Ukrainian)
  16. On Approval of the Procedure for Developing the Maximum Permissible Discharge of Pollutants into Water Bodies and the List of Pollutants to be Regulated. 1999. Available online: https://zakon.rada.gov.ua/laws/show/1100-96-п (accessed on 4 July 2024). (In Ukrainian)
  17. Koseoglu-Imer, D.Y.; Oral, H.V.; Coutinho Calheiros, C.S.; Krzeminski, P.; Güçlü, S.; Pereira, S.A.; Surmacz-Górska, J.; Plaza, E.; Samaras, P.; Binder, P.M.; et al. Current challenges and future perspectives for the full circular economy of water in European countries. J. Environ. Manag. 2023, 345, 118627. [Google Scholar] [CrossRef] [PubMed]
  18. Wiesner-Sękala, M.; Kończak, B. Assessment of the Impact of Industrial and Municipal Discharges on the Surface Water Body Status (Poland). Sustainability 2023, 15, 997. [Google Scholar] [CrossRef]
  19. Kuznietsov, P.; Biedunkova, O. Multivariate regression studies for the investigation of the COD, BOD, and TOC concentrations in the water of the Styr River within the zone of influence of the power plant discharge. Water Pract. Technol. 2024, 19, 1412. [Google Scholar] [CrossRef]
  20. Kuznietsov, P.; Biedunkova, O.; Trach, Y. Monitoring of Phosphorus Compounds in the Influence Zone Affected by Nuclear Power Plant Water Discharge in the Styr River (Western Ukraine): Case Study. Sustainability 2023, 15, 16316. [Google Scholar] [CrossRef]
  21. Trach, Y.; Chernyshev, D.; Biedunkova, O.; Moshynskyi, V.; Trach, R.; Statnyk, I. Modeling of Water Quality in West Ukrainian Rivers Based on Fluctuating Asymmetry of the Fish Population. Water 2022, 14, 3511. [Google Scholar] [CrossRef]
  22. Methodological Recommendations for the Development of Standards for Maximum Permissible Discharge of Pollutants into Water Bodies with Waste Water. 2021. Available online: https://mepr.gov.ua/nakaz-mindovkillya-173-vid-05-03-2021/ (accessed on 4 July 2024). (In Ukrainian)
  23. Permit for Special Water Use of VP RAEP No. 53/RV/49d-20. 2020. Available online: https://e-services.davr.gov.ua/ (accessed on 4 July 2024).
  24. Xiang, R.; Wang, L.J.; Li, H.; Tian, Z.B.; Zheng, B.H. Water quality variation in tributaries of the Three Gorges Reservoir from 2000 to 2015. Water Res. 2021, 195, 116993. [Google Scholar] [CrossRef] [PubMed]
  25. Kuznietsov, P.M.; Biedunkova, O.O. The formation of the carbonate system of circulating cooling water of the Rivne NPP and its influence on changes in the surface waters pH levels of the Styr river. IOP Conf. Ser. Earth Environ. Sci. 2023, 1254, 012102. [Google Scholar] [CrossRef]
  26. Chandrasekaran, S.; Pillai, G.S.; Venkatraman, B. Spatial and heavy metal assessment in beach sands of east coast of Tamil Nadu, India. Environmental Nanotechnology. Monit. Manag. 2020, 14, 100324. [Google Scholar]
  27. Kuznietsov, P.M.; Biedunkova, O.O.; Yaroshchuk, O.V.; Pryshchepa, A.M. Optimization of the Anti-Scale Corrective Treatment of Water by Organic Phosphonate. Sci. Innov. 2024, 20, 79–90. [Google Scholar] [CrossRef]
  28. Jarvie, H.P.; Neal, C.; Withers, P.J.A. Sewage-effluent phosphorus: A greater risk to river eutrophication than agricultural phosphorus? Sci. Total Environ. 2006, 360, 246–253. [Google Scholar] [CrossRef] [PubMed]
  29. Beyene, A.; Kothari, D.; Subbarao, P. Power Generation. In Springer Handbook of Mechanical Engineering; Springer Handbooks; Springer: Cham, Switzerland, 2021. [Google Scholar] [CrossRef]
  30. Huang, J.; Yin, H.; Chapra, S.C.; Zhou, Q. Modelling dissolved oxygen depression in an urban river in China. Water 2017, 9, 520. [Google Scholar] [CrossRef]
Figure 1. Value ranges of pH (a), TDS (b), and TH (c) in the makeup and cooling water of the CCS of the Rivne NPP and the Styr River water.
Engproc 67 00003 g001
Figure 2. Concentration ranges of Cl (a), SO42− (b), Na+, and K+ (c) in the makeup and cooling water of the CCS of the Rivne NPP and the Styr River water.
Engproc 67 00003 g002
Figure 3. Concentration ranges of PO43− (a), N-NH3 (b), NO3 (c), TSS (d), and COD (e) in the makeup and cooling water of the CCS of the Rivne NPP and the Styr River water.
Engproc 67 00003 g003
Figure 4. Principal component analysis of parameters in cooling water (red ellipse), makeup water (black ellipse), and the Styr River water (green ellipse).
Engproc 67 00003 g004
Figure 5. Ratio of the actual annual discharge by average (ADav) and maximum (ADmax) values to the normalized MPD values of the CCS of Rivne NPP water discharge for 2019–2022.
Engproc 67 00003 g005
Table 1. The ranges of MPC [12,13,14], MPD [22,23], and NVs [7].
IndicatorsUnitsMPCs for River WaterNVs for Makeup WaterNVs for Cooling
Water
MPD (t/Year)
pHunit6.5–8.5 6.0–10.3 6.5–9.0not standardized
TDSmg/dm31000not more than 415not more than 800(18,409)
Clmg/dm3300not more than 50not more than 150(2249.2)
SO42−mg/dm3100not more than 100not more than 500(7683)
THmg-eq/dm35.0–7.0not more than 4.0not more than 7-
CODmgO/dm350--(1480.25)
PO43−mgP/dm30.7not more than 1.0not more than 4.0(37.0)
NO3mg/dm340not more than 15not more than 40(817.8)
TSSmg/dm325not more than 10not more than 50(273.21)
ΣNa+, K+mg/dm350not standardizednot standardizednot standardized
N-NH3mg/dm31not standardizednot standardized(15.33)
Table 2. Pearson correlation coefficients for indicators in makeup and cooling water in the CCS of the Rivne NPP and the Styr River water.
IndicatorspHTDSClSO42−THCODPO43−NO3TSSN-NH3
Styr River water
pH1.00
TDS0.611.00
Cl0.240.851.00
SO42−0.110.880.651.00
TH0.250.830.550.111.00
COD0.280.350.230.210.231.00
PO43−0.110.340.220.380.230.551.00
NO30.050.710.530.550.55−0.61−0.431.00
TSS0.01−0.110.17−0.14−0.11−0.050.32−0.171.00
N-NH30.260.290.050.110.240.510.54−0.68−0.021.00
makeup water CCS
pH1.00
TDS0.551.00
Cl0.250.851.00
SO42−0.210.780.551.00
TH−0.850.820.050.271.00
COD0.180.250.23−0.080.121.00
PO43−−0.100.140.420.18−0.110.651.00
NO30.150.760.330.630.61−0.68−0.481.00
TSS0.11−0.120.87−0.340.090.080.020.171.00
N-NH30.220.18−0.090.050.280.550.64−0.590.111.00
cooling water CCS
pH1.00
TDS0.641.00
Cl−0.150.951.00
SO42−0.310.980.551.00
TH0.740.880.050.211.00
COD0.080.310.230.280.311.00
PO43−0.210.220.420.220.140.641.00
NO3−0.150.750.330.590.67−0.65−0.381.00
TSS0.24−0.220.87−0.220.050.260.05−0.151.00
N-NH3−0.050.220.150.26−0.110.630.66−0.620.221.00
Disclaimer/Publisher’s Note: The statements, opinions and data contained in all publications are solely those of the individual author(s) and contributor(s) and not of MDPI and/or the editor(s). MDPI and/or the editor(s) disclaim responsibility for any injury to people or property resulting from any ideas, methods, instructions or products referred to in the content.

