Abstract
Quick moisture absorbency is a requirement of textiles for a wide range of applications, such as sports and work wear, medical and personal care use, agricultural applications, and seating furniture. On the textile level, the absorbency speed depends on the fiber, yarn, and fabric properties and structures, as well as multi-layer combinations. Accordingly, the technical development of these textile products includes selecting appropriate combinations of textile structures. This study presents the absorption speed of different fabric structures. The conclusions on the interaction of porosity and liquid transfer provide guidance for developing and selecting textiles with absorbency requirements.
1. Introduction
A wide range of textile products require the rapid absorption of moisture and a variety of fluids with different surface tensions and viscosities to ensure functionality and comfort during use. These include sportswear, workwear, medical, and personal care textiles, as well as some agricultural applications and textiles for upholstery. Several studies in the field of textile moisture absorption and transport are attracting the interest of researchers. While the research on developing numerical models to simulate moisture transfer and absorption is growing, they mainly focus on simulating water and water vapor [1,2,3,4]. The few studies that include actual testing are limited to water and water vapor as well and do not include liquids with different viscosities [5,6,7,8,9,10]. They are valuable for developing sportswear and workwear. However, the results cannot be applied to liquids with higher viscosity, such as menstrual fluid, which is important for developing applications such as textile menstrual products. Applications such as reusable menstrual pads require fast absorption of higher viscose liquids for comfort and high functionality to provide an attractive alternative to disposable products. Also, findings from single-use diapers and menstrual pads with super absorbents cannot be directly applied. While previous studies revealed a variety of different properties and construction details on the different levels of raw material, fiber, yarn, and textile construction, the aim of this study is to investigate the effect of porosity, determined with an image of the pores of textiles for an efficient characterization in technical product development. As for medical and personal care applications, fluids with viscosities above water are important; this study focuses on liquid absorption and transfer with higher viscosity levels in comparison to water.
Previous investigations with water show that, at the textile level, the absorption rate depends on the fiber, yarn, and fabric properties and structures, as well as multi-layer combinations [8,9]. The fiber material itself may have good adsorption properties, including surface tension. In addition to the fiber material, the number, size, and size distribution of the pores, as well as the degree of interconnection of the pores, are relevant for moisture transport in the textile [9]. A larger volume of liquid can be absorbed in large pores but transported to a lesser distance compared to narrow capillaries. Small, uniform, and interconnected pore channels allow rapid moisture transfer, while a high number of large pores or a high total pore volume is associated with high moisture retention capacity [10]. At the fiber level, cross-section and fineness have a particular impact on the wicking effect because they influence the capillary shape and size of the interface [11]. At the fabric level, mass per area, density, and thickness are particularly relevant parameters because they amplify the effects described above. An increase in these parameters results in improved capillarity, as more fiber material is involved in moisture transport [12]. In layered systems consisting of several textiles, moisture transport depends not only on pore size and volume but also on the applied pressure and the arrangement of the surfaces [13,14]. This paper presents the investigation and results of the absorption speed of three different textile structures. The results provide a basis for improving the comfort and functionality of textiles, especially for personal care products and sportswear.
2. Materials and Methods
Three different textile structures were selected for the test based on their suitability for inner liners for moisture and liquid absorption for a variety of applications, such as period underwear and sportswear. Table 1 provides an overview of the samples and their specifications.

Table 1.
Summary of the samples and their characteristics.
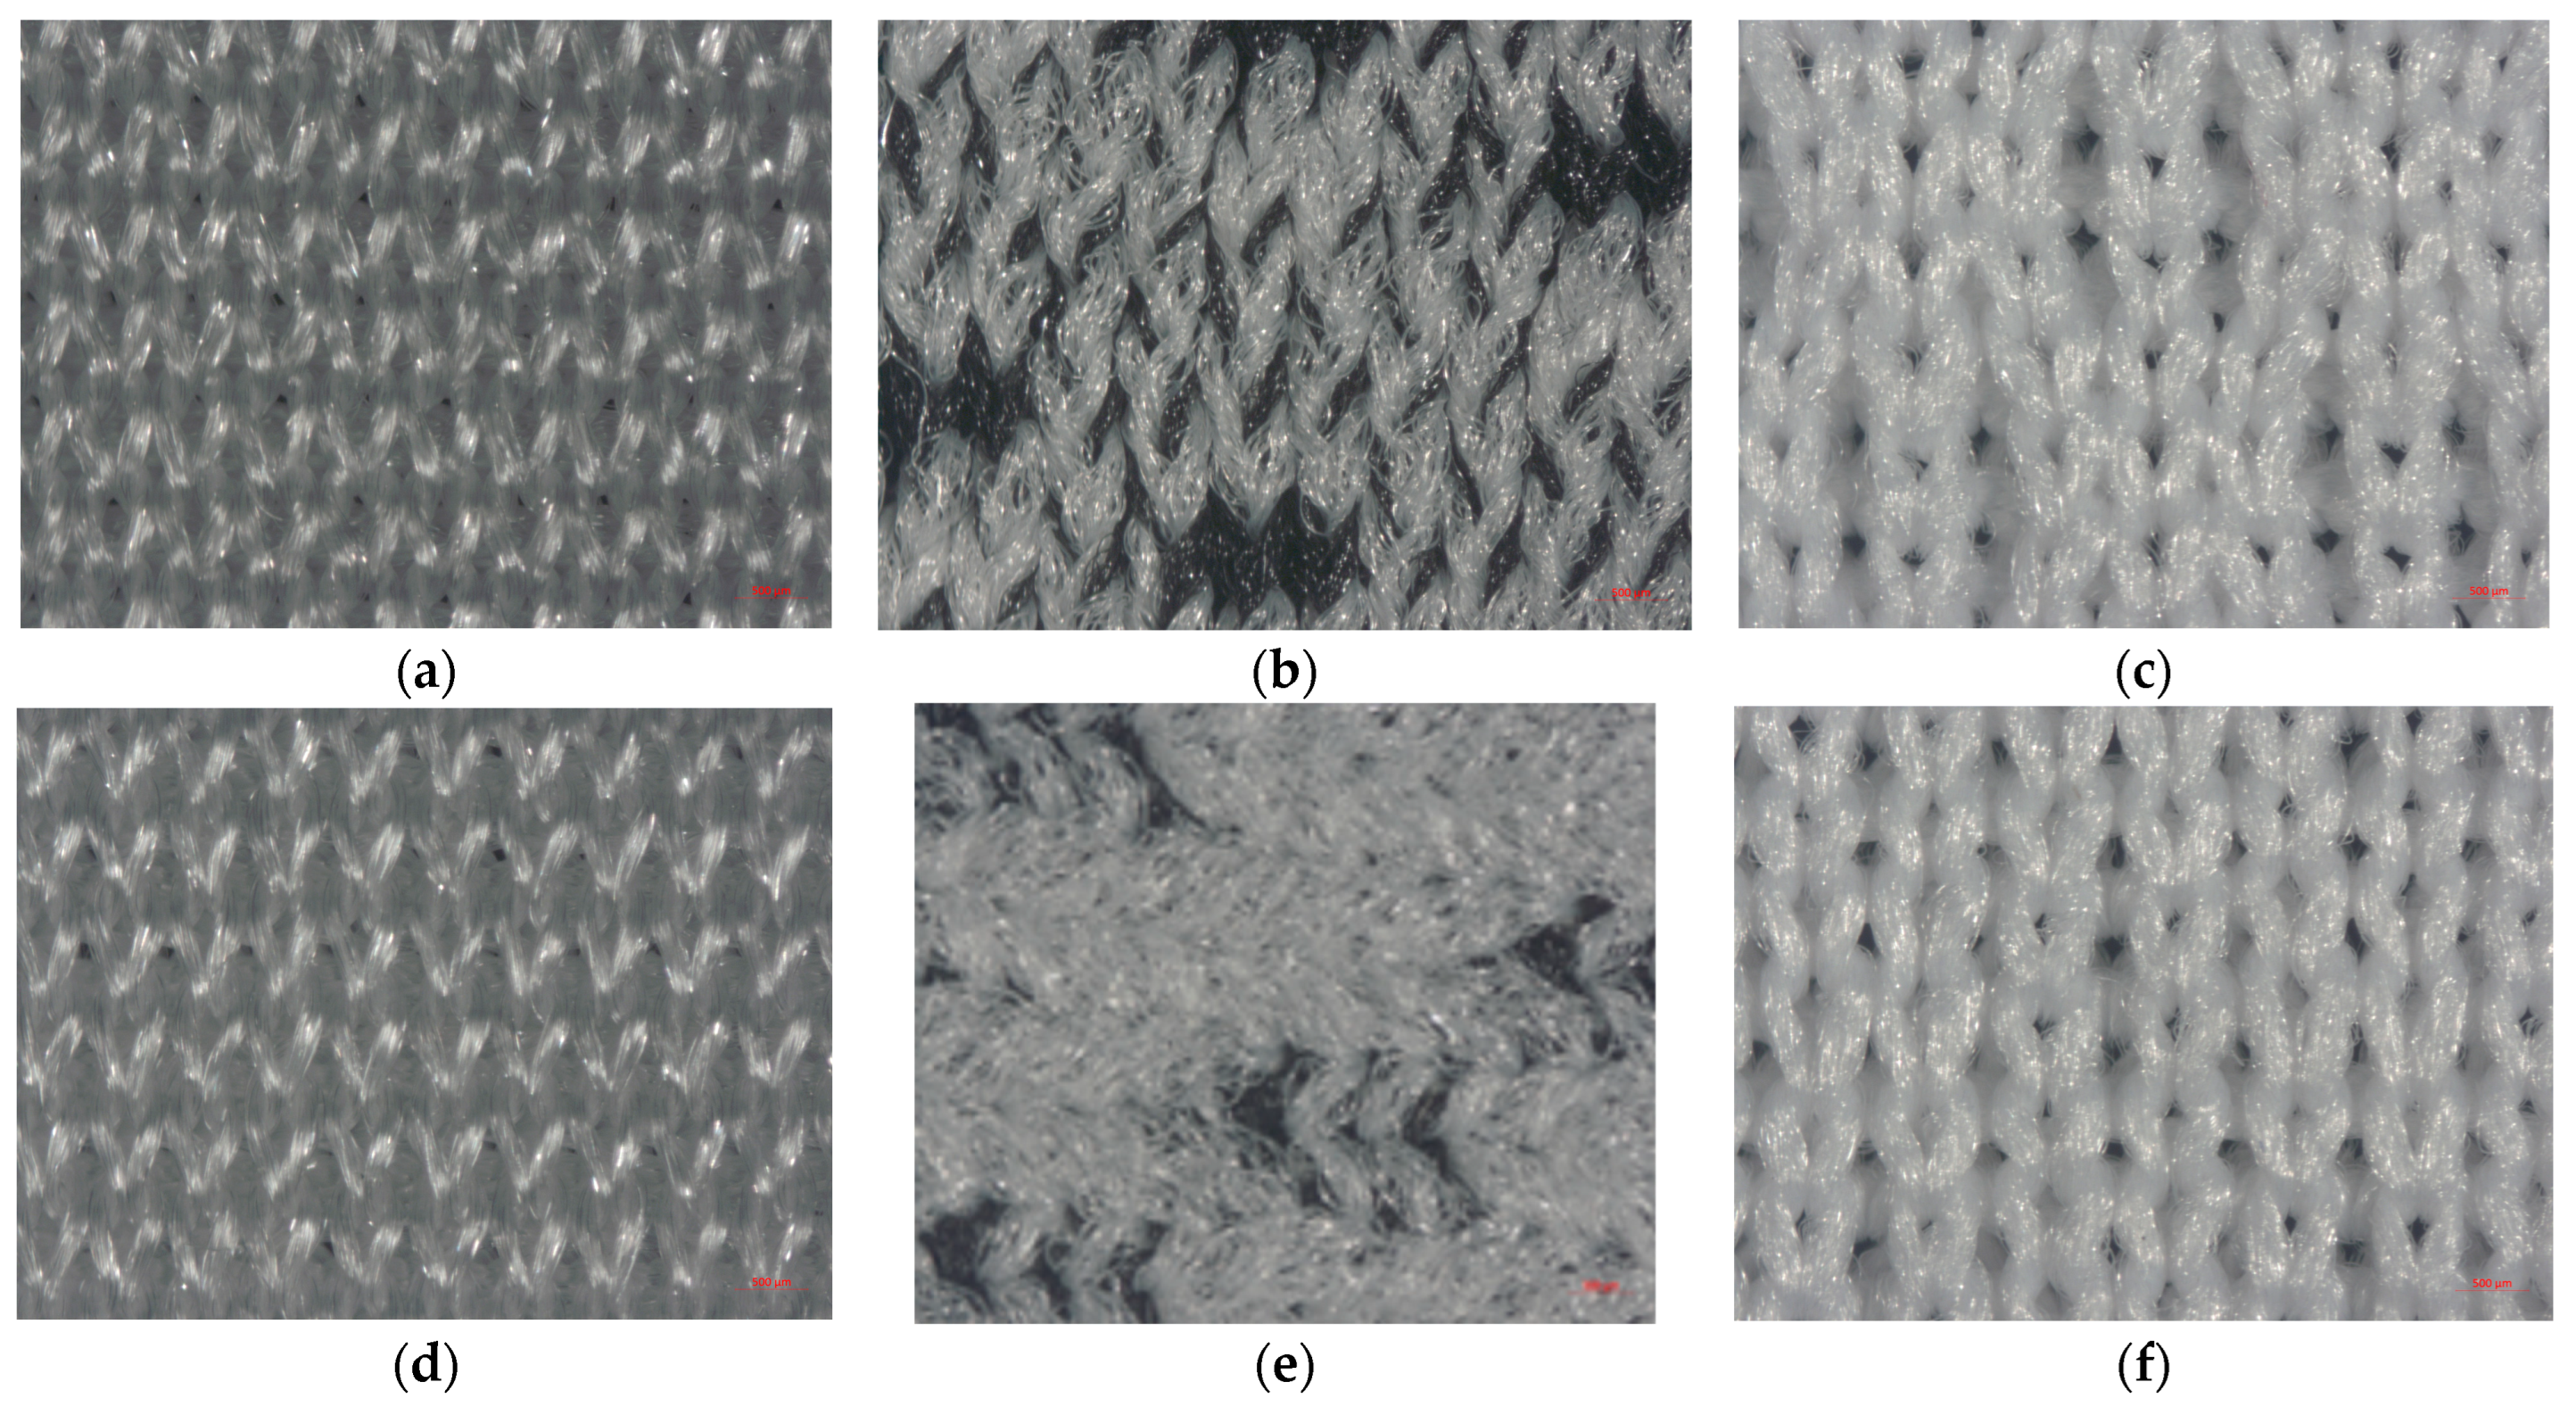
Microscopic images of the front and back samples are shown in Figure 1.
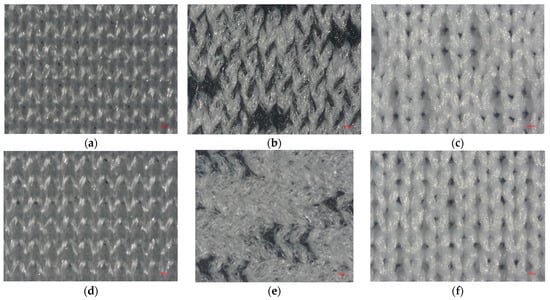
Figure 1.
Reflecting microscope images of the samples: (a) textile A front; (b) textile B front; (c) textile C front; (d) textile A back; (e) textile B back; and (f) textile C back side. The scale indicates 50 μm.
The different textile samples were characterized by using standardized textile testing methods to determine their mass, thickness, and mesh density under standard climate conditions (20 °C/65% RH). Additionally, the porosity of the textiles was investigated using microscopy (Keyence VHX-970FN, Neu-Isenburg, Germany) and digital image processing. The mass per unit area was tested in accordance with DIN EN 12127: 1997-12 [14], with measurements averaged from five samples. The thickness of the samples was determined in accordance with DIN EN ISO 5084: 1996-10 [15], using five samples for an accurate measure. Mesh density, defined as the number of meshes per unit length and area, was determined in accordance with DIN EN 14971: 2006-04 [16] based on the average of five measured values. To determine the optical porosity, digital microscopy images were processed and evaluated using the open source image software “ImageJ” version 1.53k from 6 July 2021 in accordance with existing research [17]. High-quality microscope images were essential for accurate analysis, requiring good illumination and sharpness to enable even binarization. Binarization involves converting all grey values within an image into two values, with a threshold representing the grey value limit [17], allowing segmentation into black-and-white pixel areas. An inappropriate threshold value could lead to textile areas being incorrectly identified as pore areas [17,18]. In the image processing stage, microscopy images were first converted to grayscale (8-bit) and calibrated by setting the scale (see Figure 2).

Figure 2.
Image binarization process to determine the optical porosity based on the pore areas close to the surface.
The threshold value was determined experimentally, considering the respective histogram and textile structure. Black pixels represent the pores, while white pixels represent the textile surface. To filter out artifacts from small black pixel areas, a pixel limit of 50 pixels was empirically determined and applied uniformly across all images. After image analysis, the measured values of the following parameters were recorded: the image area, the number of pores, the total black pixel area, maximum perimeter, minimum diameter, and maximum diameter. Formula 1 was used to determine the optical porosity P with the unit %. Finally, the mean value and standard deviation were calculated for each sample with the following equation [17,19]:
The surface porosity was calculated for each surface of the samples using this formula. Transverse porosity was calculated from a sample consisting of two images of the fabric side with better visibility of the continuous pores and one image of the reverse side of the fabric. For both measures—surface and transverse porosity—three different areas of the textile samples were analyzed.
A camera (Nikon Z 30—VOA110AE, Nikon Deutschland, Düsseldorf, Germany) was mounted in a frame above the samples to document the adsorption and absorption (size of the wetted area and time).
Liquids with three different viscosity levels were used to compare the absorption properties of the textiles: L1: deionized water, L2: deionized water with xanthan gum 200 mg/L, and L3: deionized water with xanthan gum 600 mg/L. Liquid properties such as density, surface tension, and viscosity were measured (rotational viscometer, ViscoQC 100 L, Anton Paar Germany GmbH, Baden-Württemberg, Germany). The surface tension of the liquids was measured at room temperature by taking five measurements each and then averaging them.
3. Results and Discussions
Table 2 below shows the average results of two measurements each for shear stress and viscosity at different revolutions per minute of the two liquids: L2 and L3. Viscosity decreases with increasing shear stress, with L2 and L3 having the largest difference in viscosity at 5 rpm. The surface tension of L1 was 60.32 mN/m at 19.7 °C, L2 was 50.86 mN/m at 19.4 °C, and L3 was 61.02 mN/m at 19.5 °C.

Table 2.
Viscosity of L2 and L3.
In experimental tests, the absorption rate and the dimensions of the wetted surface of the different textile structures in combination with an absorbent layer were evaluated. The textiles were placed flat on a glass plate. In total, 1 mL of the liquids was applied with a plunger pipette. The evaluation was carried out using video analysis and digital image processing. Figure 3 shows the wet surface area of textile A with liquid L3 at the beginning, at the end, and 10 s after the end point of the adsorption.

Figure 3.
Wet surface area of textile A with liquid L3 (a) at the start of the adsorption; (b) at the end of the adsorption; and (c) 10 s after the end point of the adsorption.
Table 3 provides the results of the adsorption duration (s) and speed (mL/s) of the three different liquids for all three textile structures. Textiles B and C were tested at the front and at the reverse side. Textile A was tested only on the front side, as both sides have the same look. Generally, the higher the viscosity, the lower the adsorption speed.

Table 3.
Results of the absorption tests.
Overall, there was a clear difference in the absorption speed when using F1 compared to F2 and F3. Textiles A and C instantly adsorbed the deionized water L1, and this is why there is no measurement of the absorption speed with the used camera technology. Sample C’s front showed the highest absorption rate with L1 and L2 but performed only second highest with the higher viscose, despite hydrophilic finishing for liquid L3.
Liquid L1 was also adsorbed by fabric B—both the front and back side—and absorbed faster than L2 and L3. The surface porosity of fabric B—both the front and back side—was lower than the surface porosity of fabric A and C, although the loop density of fabric B was similar to fabric A. However, fabric B also had the lowest mass per area and thickness, hence, less fiber material to absorb the liquids.
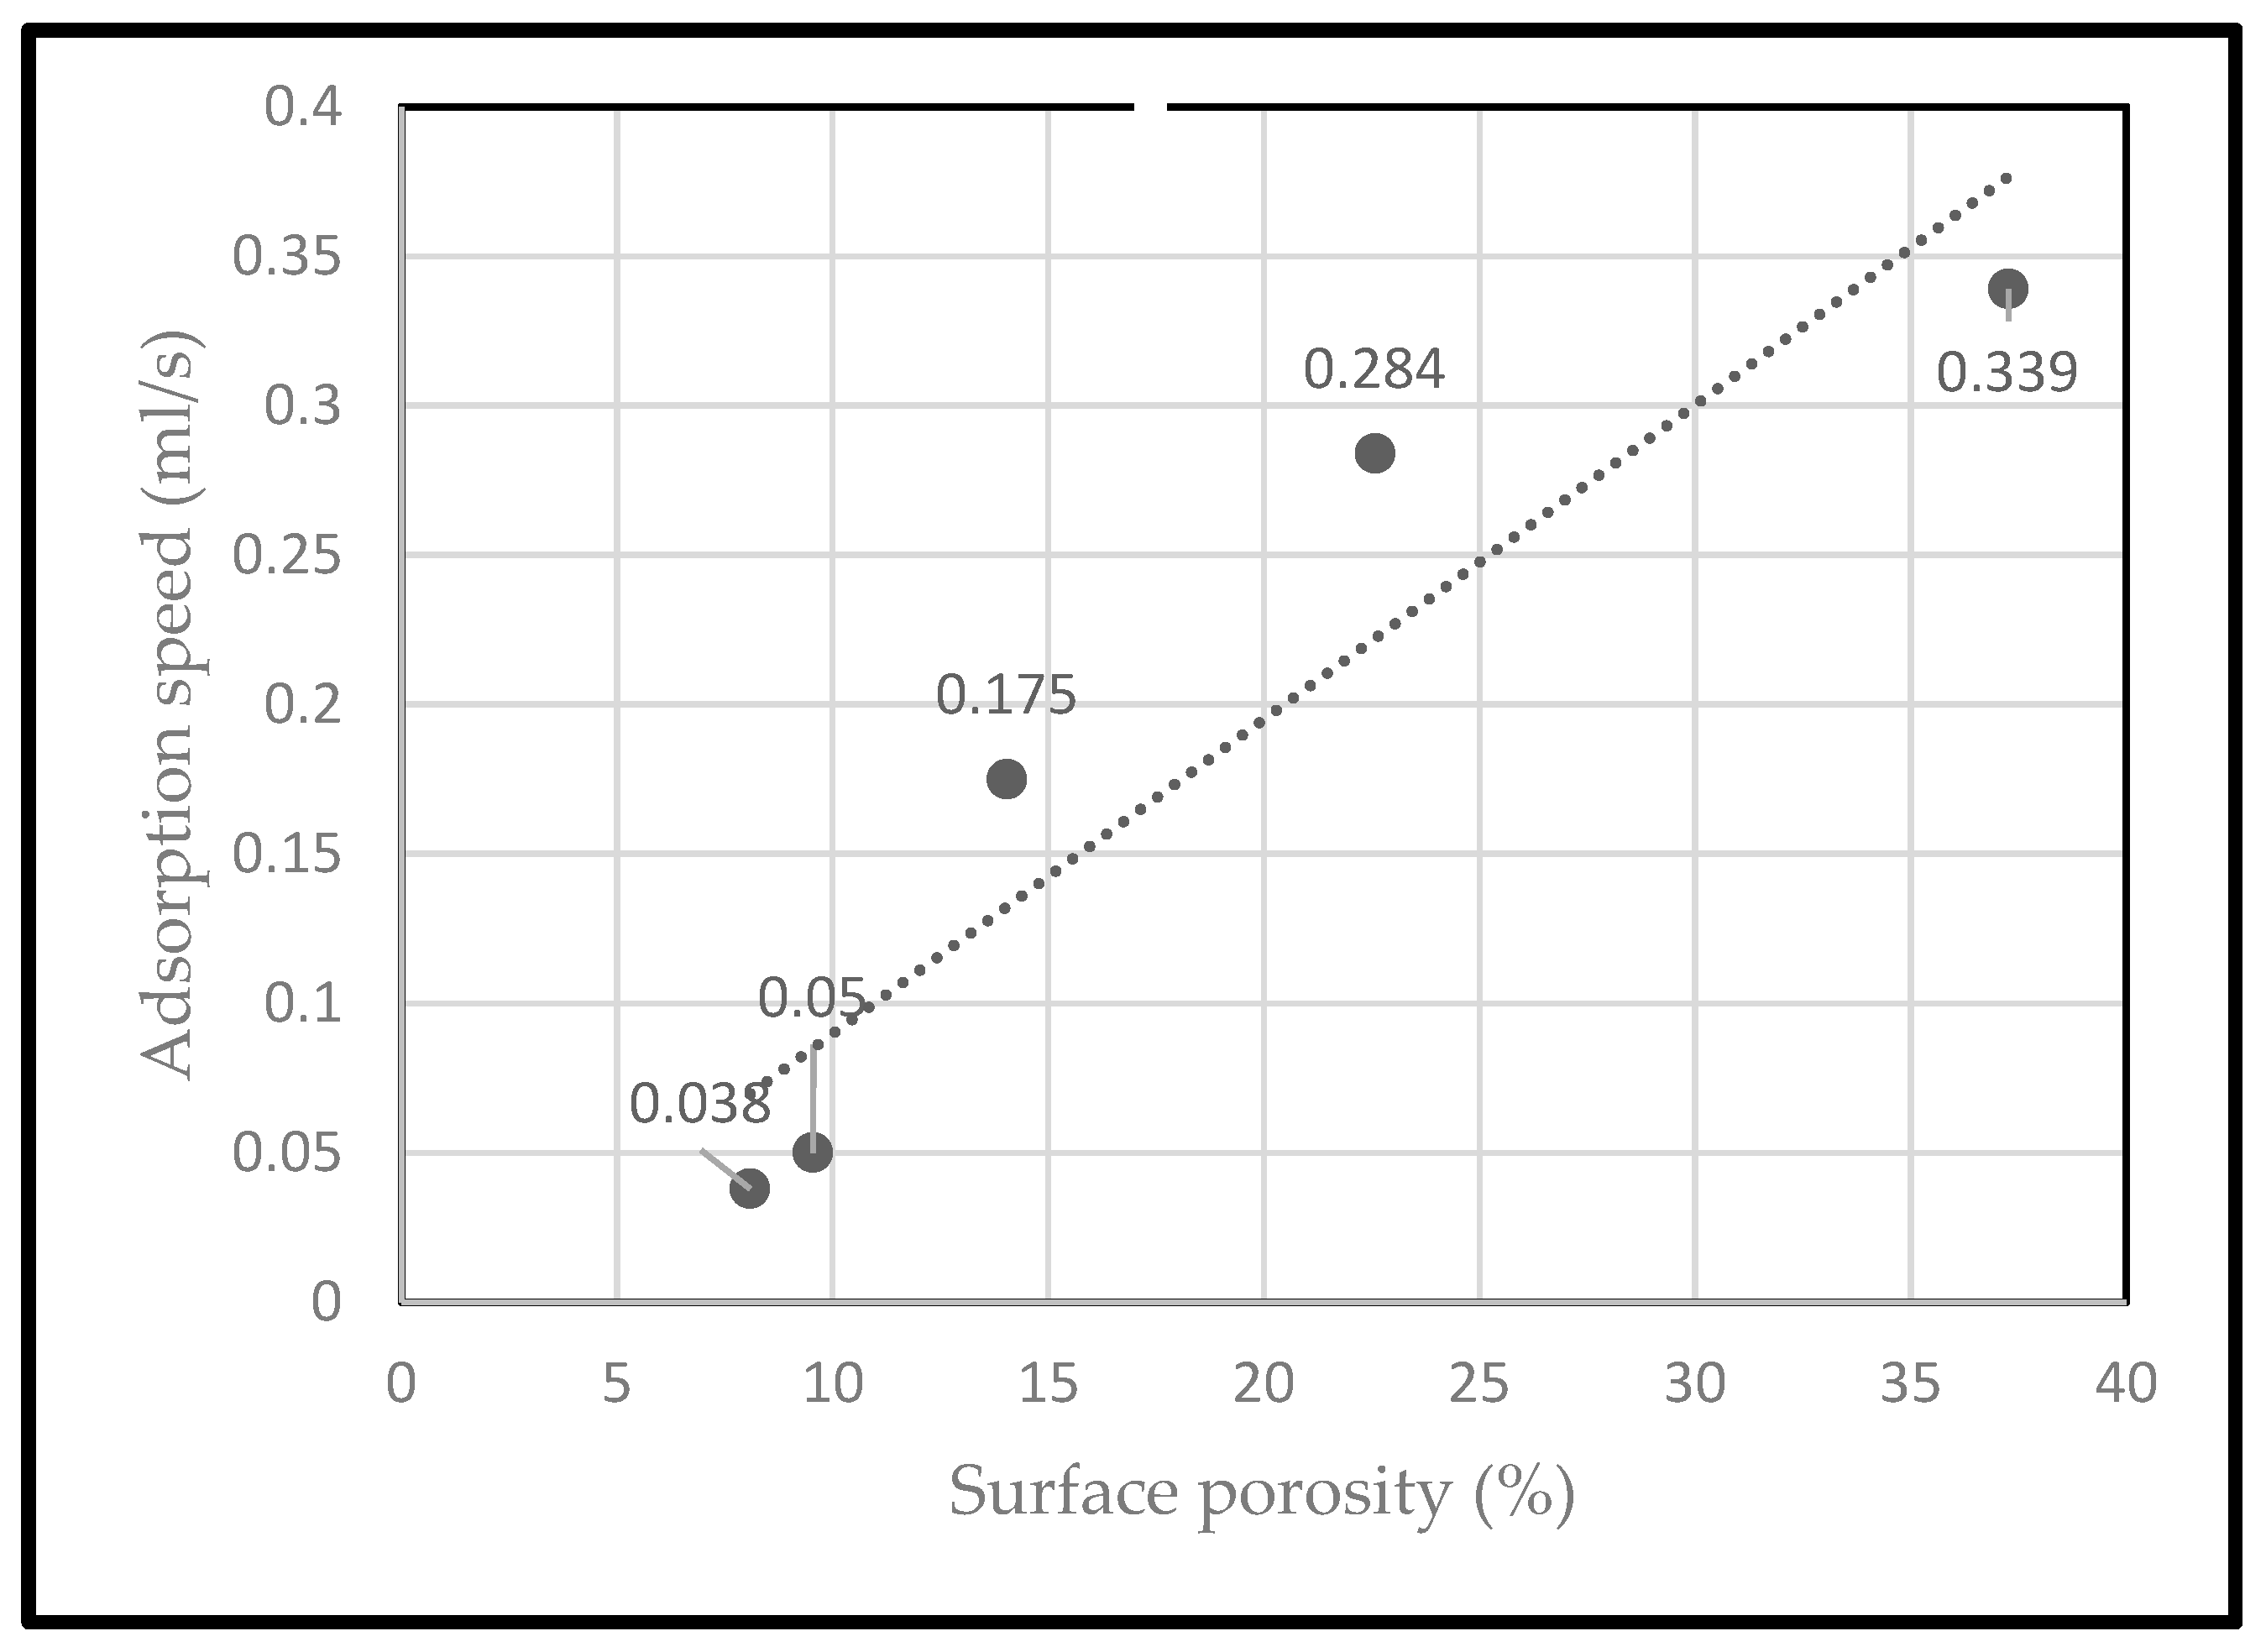
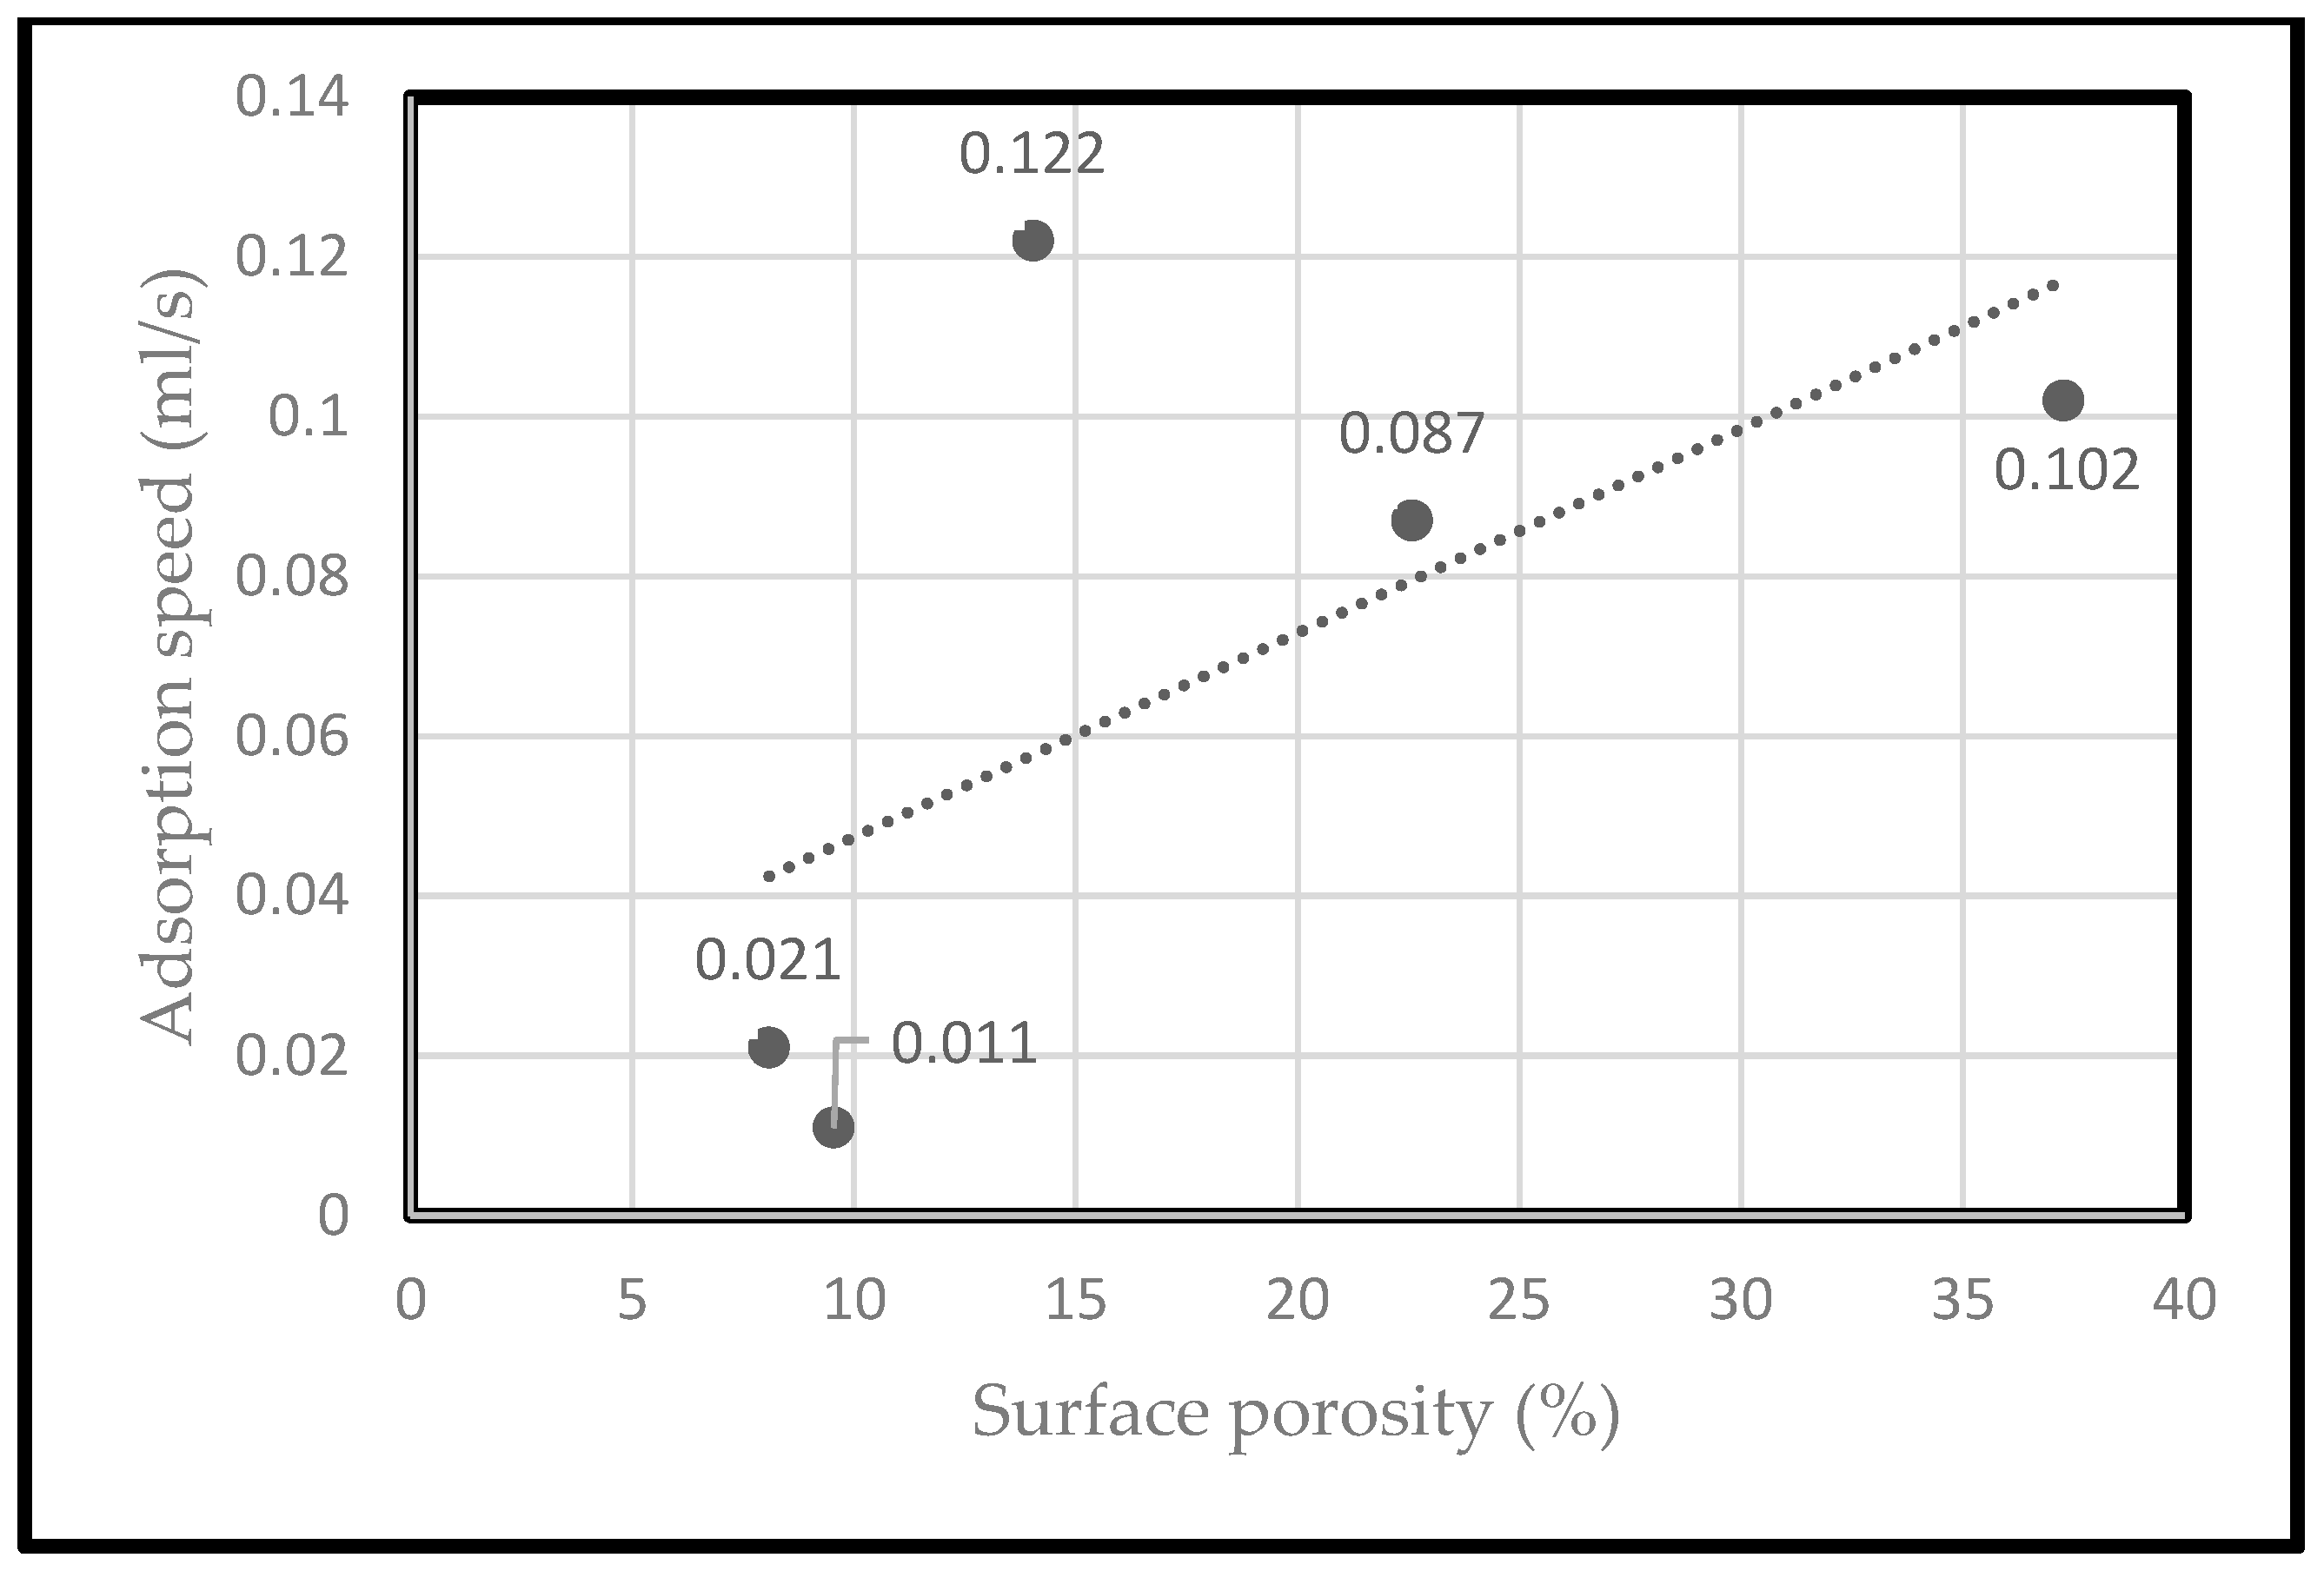
The results with L2 show that fabric C—on the front—side had the highest absorption rate, followed by sample A (see Figure 4). For the liquid with the highest xanthan concentration, L3, the C-reverse side achieved the highest absorption rate, followed by C’s front and A (see Figure 5). Sample B had the slowest absorption, with the reverse side being even lower than the front despite the surface porosity of the reverse side being slightly higher than the surface porosity of the front.
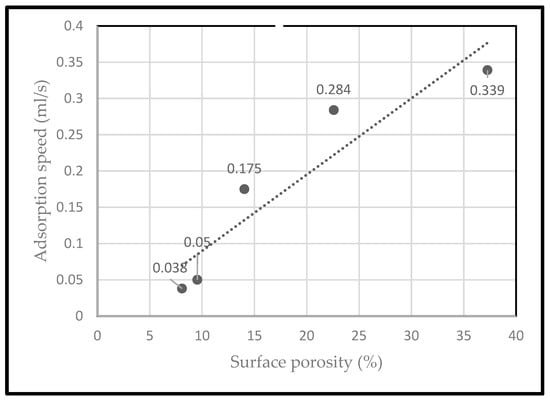
Figure 4.
Adsorption speed of L2 in relation to surface porosities.
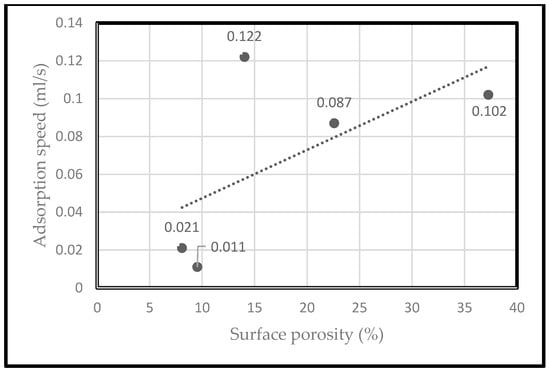
Figure 5.
Adsorption speed of L3 in relation to surface porosities.
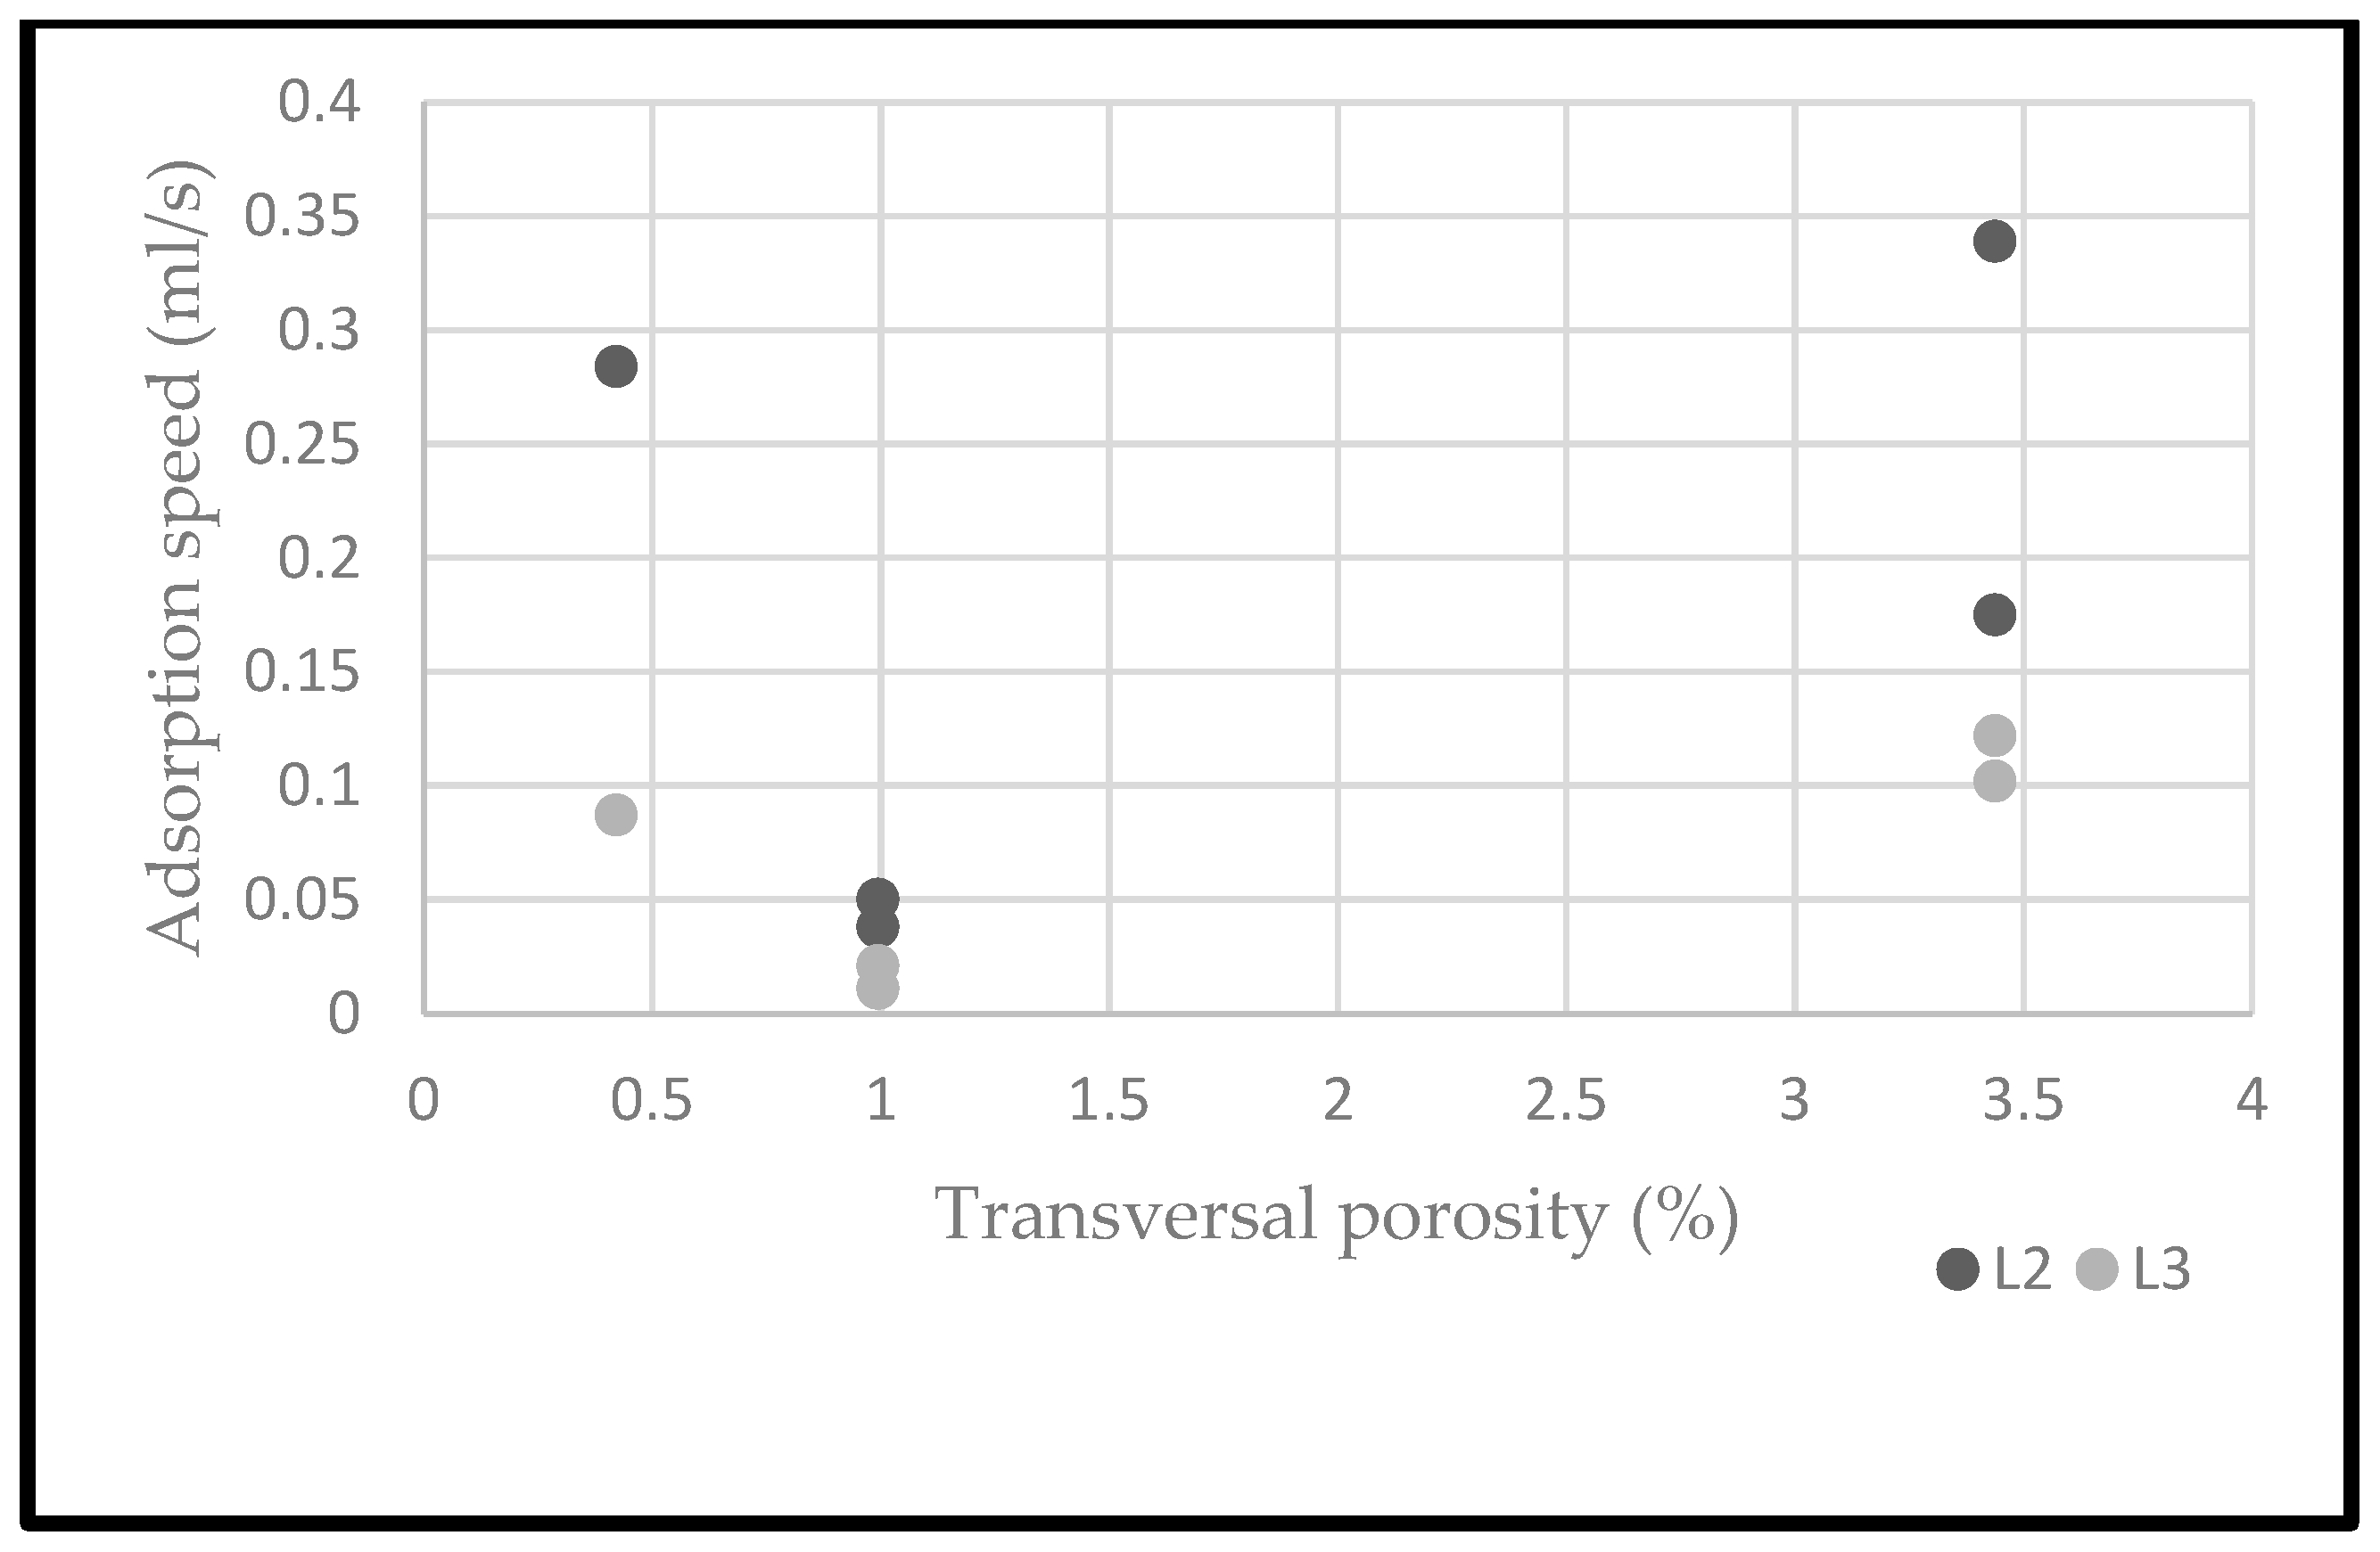
The results show that high surface porosity, high transverse porosity, and higher fabric weight (mass per unit area) are associated with higher absorption rates and rapid transverse liquid transfer, even for viscous liquids (see Figure 6). In addition, a small, wetted area tends to be associated with large, uniformly distributed through-pores.
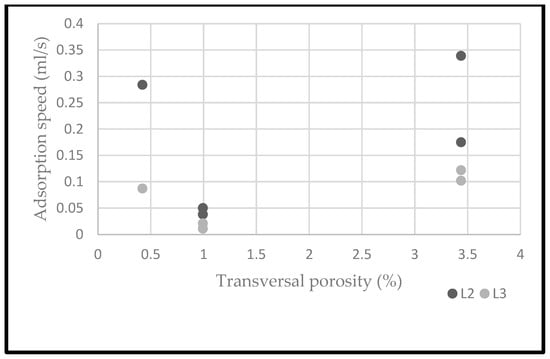
Figure 6.
Adsorption speed of L2 and L3 in relation to transversal porosities.
As for the different sizes of the wet area, an indication of whether the liquid was absorbed instantly into the core of the fabric or spread horizontally was a slight or stagnant increase initially observed, with a stronger increase at ten seconds after the end of absorption. In the case of B’s reverse side, the surface area decreased slightly overall. Accordingly, the liquid was absorbed into and through the fabric. As specimen B had the lowest fabric weight and lowest surface porosity, and hence less material to absorb the liquid, this was likely due to the higher count of courses and wales.
In the first run with L1, sample A showed the largest diameter at the start of absorption, followed by B’s front, then C’s front, and C’s back side. The smallest surface area was sample B’s back side. At the end of absorption, sample B’s front side, in particular, showed a large area. Ten seconds after the end of absorption, sample A had the largest wet area, followed by C’s front side. In relation to the viscosity, the results of the wet surface area showed a tendency for higher viscose liquids within initially smaller, wetter areas to then spread more after ten seconds. Overall, initially, at the end of absorption and after ten seconds for higher viscose liquids, specimen C showed the lowest surface areas. This was expected as specimen C had the highest weight and highest surface and transversal porosity.
4. Conclusions
The results of previous research described in the literature show that high thickness, mass per unit area, through porosity, and surface porosity result in high liquid absorption rates. In addition, high porosity is associated with a high absorption rate for a high-viscosity (L3) liquid. Overall, the absorption rate results are largely conclusive. As expected, higher surface porosity and transverse porosity, are associated with a higher adsorption rate. However, since the low surface porosity and low transverse porosity of sample B is also associated with the lowest thickness and mass per unit area, further investigation with samples that decouple these properties may provide further insight into the limits and dominant factors.
While the results of the wet surface area show a tendency for higher viscose liquids within initially smaller wetter areas to then spread more after ten seconds, this indicates that for the comfort and functionality testing of textiles for menstrual products, it is important to characterize the fabric structure with liquids with appropriate viscosity levels. The results also showed that higher surface and transversal porosity, in combination with a higher mass per unit area, improves absorption even for higher viscose liquids.
Textiles A and C adsorbed the deionized water L1 immediately, so the camera technology used did not allow the measurement of the absorption rate. A camera with more frames per second will be needed to measure the absorption rate.
Author Contributions
Conceptualization B.M. and E.E.; methodology B.M.; validation B.M. and E.E.; formal analysis B.M. and L.S.; investigation B.M.; resources E.E.; data curation B.M. and E.E.; writing—original draft preparation B.M. and E.E.; writing—review and editing L.S.; visualization, B.M. and E.E.; supervision E.E.; All authors have read and agreed to the published version of the manuscript.
Funding
This research received no external funding.
Data Availability Statement
Data available on request.
Acknowledgments
We would like to acknowledge Cornelia Golle and Bernd Schmidt for their support in preparing and testing the materials.
Conflicts of Interest
The authors declare no conflicts of interest.
References
- Zhu, Q.; Li, Y. Effects of Pore Size Distribution and Fiber Diameter on the Coupled Heat and Liquid Moisture Transfer in Porous Textiles. Int. J. Heat Mass Transf. 2003, 46, 5099–5111. [Google Scholar] [CrossRef]
- Wang, Y.; Xu, Y.; Xu, D.; Fan, J. The Heat and Moisture Transfer Model of Firefighter Protective Clothing. Int. J. Therm. Sci. 2024, 197, 108854. [Google Scholar] [CrossRef]
- Hang, X.; Sun, W.; Ye, C. Finite Volume Solution of Heat and Moisture Transfer through Three-Dimensional Textile Materials. Comput. Fluids 2012, 57, 25–39. [Google Scholar] [CrossRef]
- Guo, Y.; Ng, F.S.; Hui, P.C.; Li, Y.; Ip, C.; Wong, K.Y.; Mao, A.H. Heat and Mass Transfer of Adult Incontinence Briefs in Computational Simulations and Objective Measurements. Int. J. Heat Mass Transf. 2013, 64, 133–144. [Google Scholar] [CrossRef]
- Miao, D.; Cheng, N.; Wang, X.; Yu, J.; Ding, B. Sandwich-Structured Textiles with Hierarchically Nanofibrous Network and Janus Wettability for Outdoor Personal Thermal and Moisture Management. Chem. Eng. J. 2022, 450, 138012. [Google Scholar] [CrossRef]
- Selvakarthi, D.; Ragupathy, U.S. Textile effluent treatments using natural adsorbents and vapor absorption technology: A box behnken design approach. Desalination Water Treat. 2024, 319, 100443. [Google Scholar] [CrossRef]
- Abdela, A.; Vandaele, M.; Haenen, S.; Buffel, B.; Sirahbizu, B.; Desplentere, F. Moisture Absorption Characteristics and Subsequent Mechanical Property Loss of Enset–PLA Composites. J. Compos. Sci. 2023, 7, 382. [Google Scholar] [CrossRef]
- Kim, H.-A. Eco-Friendly Fibers Embedded Yarn Structure in High-Performance Fabrics to Improve Moisture Absorption and Drying Properties. Polymers 2023, 15, 581. [Google Scholar] [CrossRef] [PubMed]
- Zhong, W. Surface tension, wetting and wicking. In Thermal and Moisture Transport in Fibrous Materials; Pan, N., Gibson, P., Eds.; Woodhead Publishing: Sawston, UK, 2006; pp. 136–155. [Google Scholar] [CrossRef]
- Samuel, B.T.; Barburski, M.; Witczak, E.; Jasińska, I. The Influence of Physical Properties and Increasing Woven Fabric Layers on the Noise Absorption Capacity. Materials 2021, 14, 6220. [Google Scholar] [CrossRef] [PubMed]
- Brnada, S.; Pušić, T.; Dekanić, T.; Kovačević, S. Impact of Fabric Construction on Adsorption and Spreading of Liquid Contaminations. Materials 2022, 15, 1998. [Google Scholar] [CrossRef] [PubMed]
- Rengasamy, R.S. Wetting phenomena in fibrous materials. In Thermal and Moisture Transport in Fibrous Materials; Pan, N., Gibson, P., Eds.; Woodhead Publishing: Sawston, UK, 2006; pp. 156–187. [Google Scholar] [CrossRef]
- Patnaik, A.; Rengasamy, R.S.; Kothari, V.K.; Ghosh, A. Wetting and Wicking in Fibrous Materials. Text. Prog. 2006, 38, 1–105. [Google Scholar] [CrossRef]
- DIN EN 12127: 1997-12; Textilien—Textile Flächengebilde—Bestimmung der Flächenbezogenen Masse Unter Verwendung kleiner Proben. Beuth: Berlin, Germany; Deutsches Institut für Normung e. V.: Berlin, Germany, 1997.
- DIN EN ISO 5084: 1996-1; Textilien—Bestimmung der Dicke von Textilien und Textilen Erzeugnissen. Beuth: Berlin, Germany; Deutsches Institut für Normung e. V.: Berlin, Germany, 1996.
- DIN EN 14971: 2006-04; Textilien—Maschenwaren—Bestimmung der Maschenzahl je Längeneinheit und Flächeneinheit. Beuth: Berlin, Germany; Deutsches Institut für Normung e. V.: Berlin, Germany, 2006.
- Angelova, R.A. Determination of Porosity of Textiles with an Uneven Pore Size. Comptes Rendus l’Acade’mie Bulg. Sci. 2020, 73, 96–102. [Google Scholar] [CrossRef]
- Nischwitz, A.; Fischer, M.; Haberäcker, P.; Socher, G. Bildverarbeitung: Band II des Standardwerks Computergrafik und Bildverarbeitung, 4th ed.; Springer: Berlin/Heidelberg, Germany, 2020. [Google Scholar] [CrossRef]
- Doczyova, K.; Glombikova, V.; Komarkova, P. Application of Microtomography in Textile Metrology. Tekstilec 2014, 57, 4–11. [Google Scholar] [CrossRef]
Disclaimer/Publisher’s Note: The statements, opinions and data contained in all publications are solely those of the individual author(s) and contributor(s) and not of MDPI and/or the editor(s). MDPI and/or the editor(s) disclaim responsibility for any injury to people or property resulting from any ideas, methods, instructions or products referred to in the content. |
© 2024 by the authors. Licensee MDPI, Basel, Switzerland. This article is an open access article distributed under the terms and conditions of the Creative Commons Attribution (CC BY) license (https://creativecommons.org/licenses/by/4.0/).

