
Measuring the Efficiency of Introducing Businesses’ Digitalization Elements over Time in Relation to Their Performance †


Abstract
1. Introduction
2. Literature Review
3. Data and Methodology
4. Results and Discussion
5. Conclusions
Author Contributions
Funding
Institutional Review Board Statement
Informed Consent Statement
Data Availability Statement
Conflicts of Interest
References
- European Commission. Europe’s Digital Decade: Digital Targets for 2030. 2023. Available online: https://commission.europa.eu/strategy-and-policy/priorities-2019-2024/europe-fit-digital-age/europes-digital-decade-digital-targets-2030_en (accessed on 24 March 2024).
- European Commission. The Digital Economy and Society Index (DESI). 2023. Available online: https://digital-strategy.ec.europa.eu/en/policies/desi (accessed on 24 March 2024).
- European Investment Bank. g in Europe 2022–2023—Evidence from the EIB Investment Survey. 2023. Available online: https://www.eib.org/attachments/lucalli/20230112_digitalisation_in_europe_2022_2023_en.pdf (accessed on 24 March 2024).
- Lungu, A.E.; Georgescu, M.R.; Işan, V. An entrepreneurial appraisal of The COVID-19 pandemic: Measuring digitalization efficiency. In Proceedings of the FEB Zagreb International Odyssey Conference on Economic and Business, Zagreb, Croatia, 1–4 June 2022. [Google Scholar]
- Rejman Petrovic, D.; Krstic, A.; Nedeljković, I.; Mimovic, P. Efficiency of digital business transformation in the Republic of Serbia. VINE J. Inf. Knowl. Manag. Syst. 2022. ahead-of-print. [Google Scholar] [CrossRef]
- Krstić, A.; Rejman-Petrović, D.; Nedeljković, I.; Mimović, P. Efficiency of the use of information and communication technologies as a determinant of the digital business transformation process. Benchmarking 2023, 30, 3860–3883. [Google Scholar] [CrossRef]
- Bozkurt, E.; Topçuoğlu, Ö.; Altiner, A. Relationship between productivity and digitalization with Tobit model based on Malmquist index. J. Prod. 2022, 67–78. [Google Scholar] [CrossRef]
- Horváthová, J.; Mokrišová, M. Digitalization level of businesses in EU countries in terms of their sustainability and risk of bankruptcy. In Proceedings of the 28th RSEP International Conference on Economics, Finance & Business, Rome, Italy, 24–25 November 2022. [Google Scholar]
- Horváthová, J.; Mokrišová, M.; Kiseľáková, D.; Šofranková, B. Efficiency of the Introduction of Business’ Digitalization Elements in EU countries—Dynamic Approach. In Proceedings of the Economics, Management & Business 2023: Contemporary Issues, Insights and New Challenges—8th International Scientific Conference, High Tatras, Slovakia, 28–29 September 2023. [Google Scholar]
- Ion, E.-I.; Criveanu, M. Organizational performance—A concept that self-seeks to find itself. Ann. Econ. Ser. 2016, 4, 179–183. [Google Scholar]
- Grüning, M. Performance-Measurement-Systeme—Messung und Steuerung von Unterneh-Mensleistung; Springer: Berlin/Heidelberg, Germany, 2002. [Google Scholar]
- Dwight, R. Searching for real maintenance performance measures. J. Qual. Maint. Eng. 1999, 5, 258–275. [Google Scholar] [CrossRef]
- Johnson, G.; Kevan, S. Cesty k Úspešnému Podnikaniu [Paths to a Successful Business]; Computer Press: Prague, Czech Republic, 2000. [Google Scholar]
- Zammuto, R.F. A comparison of multiple constituency models of organizational effectiveness. Acad. Manag. Rev. 1984, 9, 606–616. [Google Scholar] [CrossRef]
- Smith, T.M.; Reece, J.S. The relationship of strategy, fit, productivity, and business performance in a services setting. J. Oper. Manag. 1999, 17, 145–161. [Google Scholar] [CrossRef]
- Neumaierová, I. Aplikace Řízení Hodnoty [The Application of Value Management]; Vysoká škola ekonomická v Praze; Nakladatelství Oeconomica: Prague, Czech Republic, 2003. [Google Scholar]
- Porter, M. What is strategy? Harv. Bus. Rev. 1996, 74, 61–78. [Google Scholar]
- Neely, A.D.; Adams, C.; Kennerley, M. Performance Prism: The Scorecard for Measuring and Managing Stakeholder Relationships; Prentice-Hall Financial Times: Harlow, UK, 2002. [Google Scholar]
- Siminica, M.; Berceanu, D.; Circiumaru, D. The performances of industrial firms from Romania. Correlation dimension €“ indicators of results. Theor. Appl. Econ. 2008, 12, 71–78. [Google Scholar]
- Sedláček, M.; Suchánek, P.; Špalek, J. Kvalita a Výkonnost Průmyslových Podniků [Quality and Performance of Industrial Enterprises]; Masarykova univerzita: Brno, Czech Republic, 2012. [Google Scholar]
- Richard, P.J.; Devinney, T.M.; Yip, G.S.; Johnson, G. Measuring organizational performance: Towards methodological best practice. J. Manag. 2009, 35, 718–804. [Google Scholar] [CrossRef]
- Howell, T.M. Actionable Performance Measurement; ASQ Quality Press: Milwaukee, WI, USA, 2005. [Google Scholar]
- Van Looy, A.; Shafagatova, A. Business process performance measurement: A structured literature review of indicators, measures and metrics. SpringerPlus 2016, 5, 1797. [Google Scholar] [CrossRef]
- Agrawal, R.; Wankhede, V.A.; Kumar, A.; Upadhyay, A.; Garza-Reyes, J.A. Nexus of circular economy and sustainable business performance in the era of digitalization. Int. J. Product. Perform. Manag. 2022, 71, 748–774. [Google Scholar] [CrossRef]
- Tohanean, D.; Toma, S.-G.; Dumitru, I. Organizational performance and digitalization in Industry 4.0. J. Emerg. Trends Mark. Manag. 2018, 1, 282–288. [Google Scholar]
- Ribeiro-Navarrete, S.; Botella-Carrubi, D.; Palacios-Marqués, D.; Orero-Blat, M. The effect of digitalization on business performance: An applied study of KIBS. J. Bus. Res. 2021, 126, 319–326. [Google Scholar] [CrossRef]
- Sommarberg, M.; Mäkinen, S.J. A method for anticipating the disruptive nature of digitalization in the machine-building industry. Technol. Forecast. Soc. Chang. 2019, 146, 808–819. [Google Scholar] [CrossRef]
- Kádárová, J.; Lachvajderová, L.; Sukopová, D. Impact of Digitalization on SME Performance of the EU27: Panel Data Analysis. Sustainability 2023, 15, 9973. [Google Scholar] [CrossRef]
- Kuntsman, A.; Arenkov, I.A. Method for assessing effectiveness of company digital transformation: Integrated approach. IBIMA Bus. Rev. 2019, 2019, 334457. [Google Scholar] [CrossRef]
- Georgescu, M.R.; Stoica, E.A.; Bogoslov, I.A.; Lungu, A.E. Managing efficiency in digital transformation—EU member states performance during the COVID-19 pandemic. Procedia Comput. Sci. 2022, 204, 432–439. [Google Scholar] [CrossRef] [PubMed]
- Yalcin, E.C. Efficiency measurement of digitalization on EU countries: A study based on data envelopment analysis. Int. J. Manag. Knowl. Learn. 2021, 10, 323–333. [Google Scholar] [CrossRef]
- İnel, M. An empirical study on measurement of efficiency of digital transformation by using data envelopment analysis. Manag. Sci. Lett. 2019, 9, 549–556. [Google Scholar] [CrossRef]
- Eurostat. Database. 2024. Available online: https://ec.europa.eu/eurostat/web/main/data/database (accessed on 15 March 2024).
- Damodaran. Data. 2024. Available online: https://pages.stern.nyu.edu/~adamodar/ (accessed on 15 March 2024).
- Färe, R.; Grosskopf, S.; Norris, M.; Zhang, Z. Productivity growth, technical progress and efficiency change in industrialized countries. Am. Econ. Rev. 1994, 84, 66–83. [Google Scholar]
- Zhu, J. Quantitative Models for Performance Evaluation and Benchmarking: Data Envelopment Analysis with Spreadsheets, 3rd ed.; Springer: New York, NY, USA, 2014. [Google Scholar]


| Variable | Valid N | Median 2019 | Median 2021 | Median 2023 |
|---|---|---|---|---|
| E-commerce sales | 27 | 20.8 | 22.60 | 23.5 |
| Use of computers and the Internet by employees | 27 | 47.20 | 53.00 | 59.9 |
| Types of connections to the Internet | 27 | 94.00 | 94.80 | 94.8 |
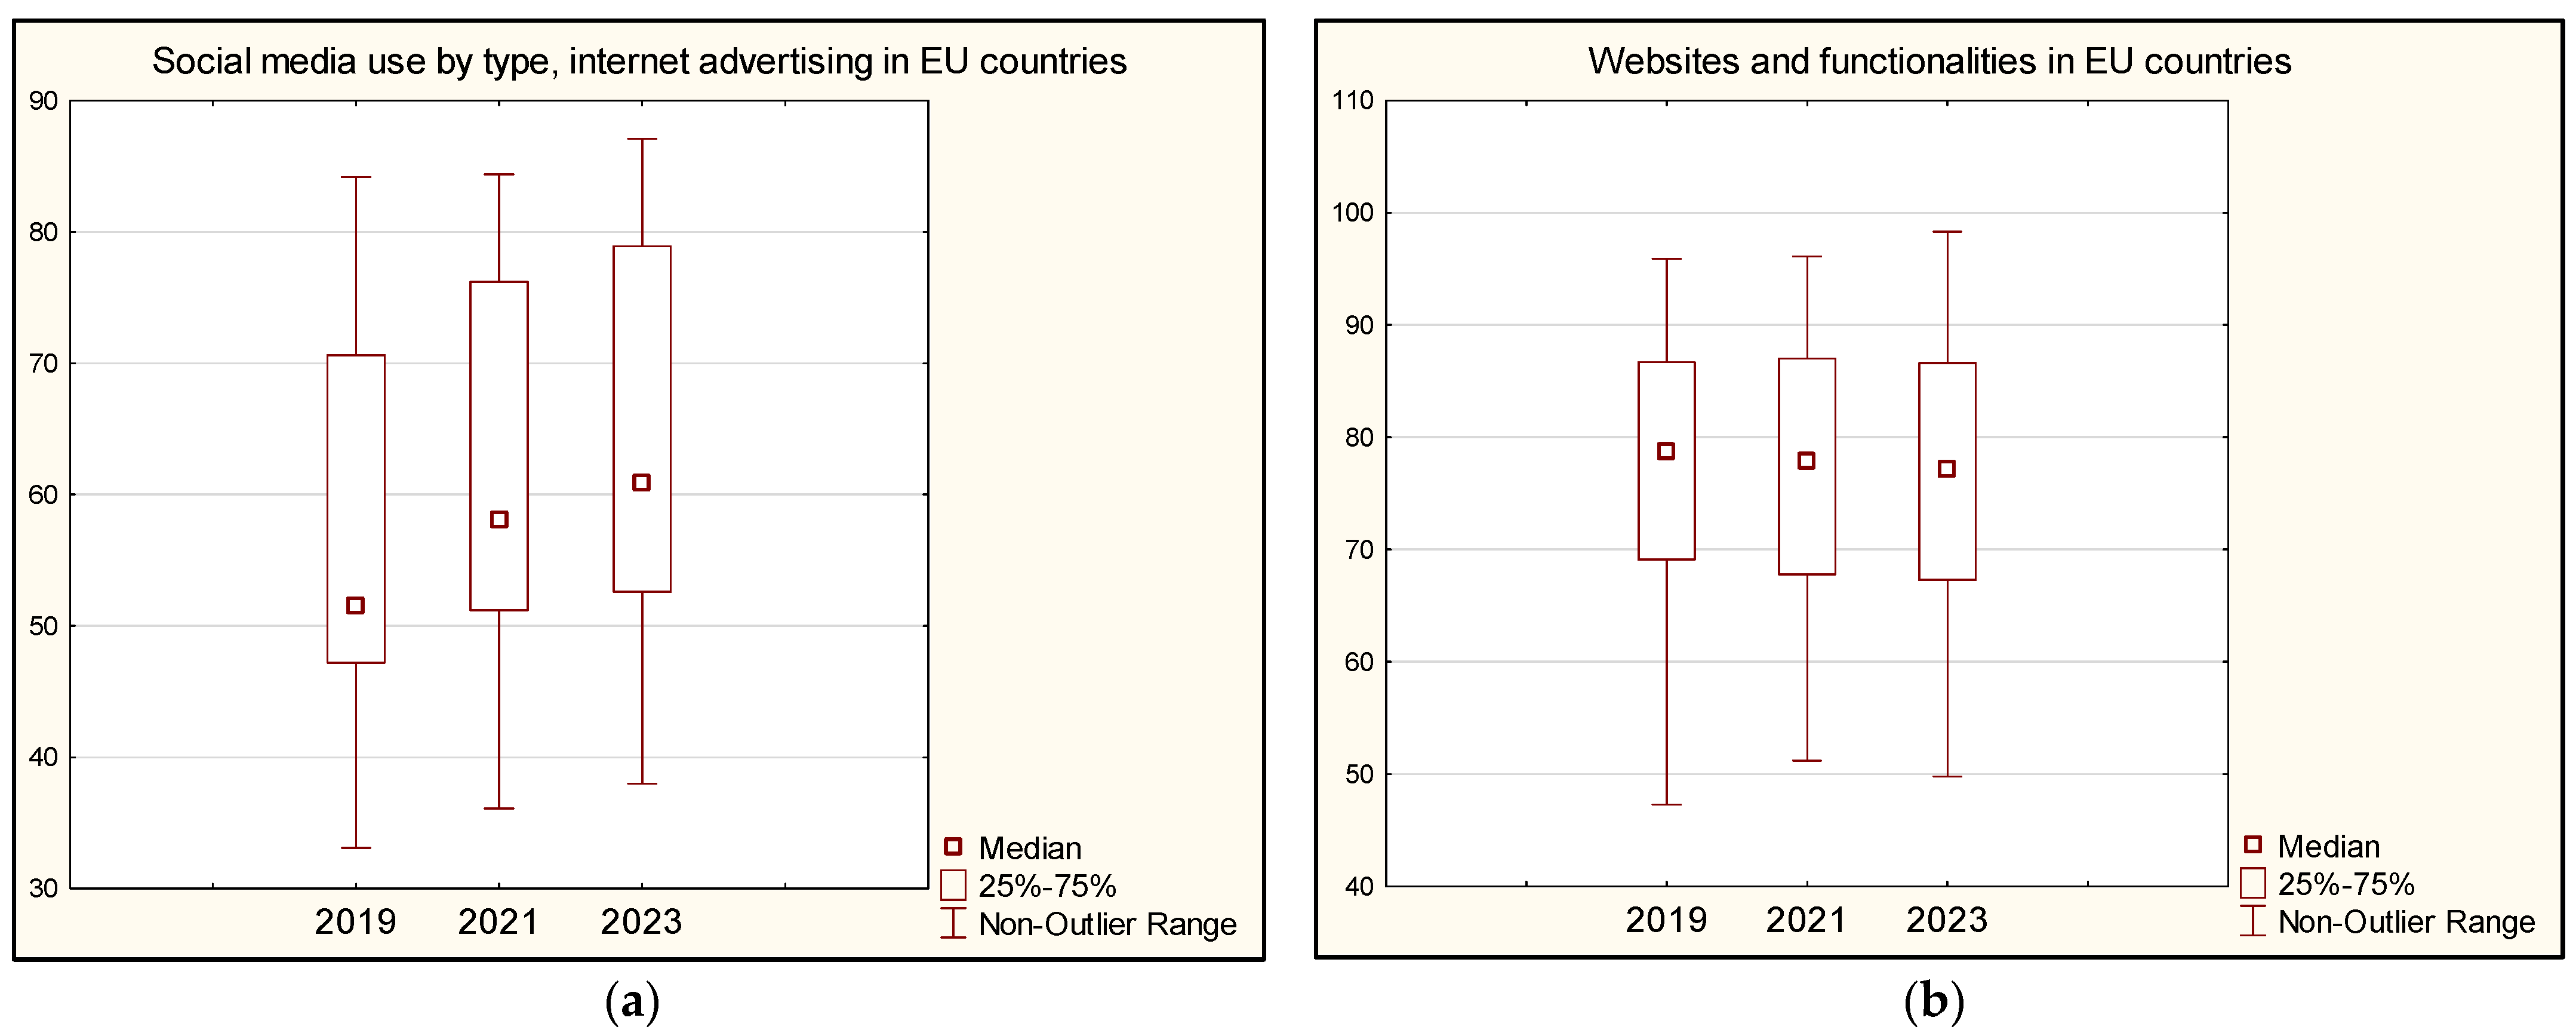
| Websites and functionalities | 27 | 78.70 | 77.90 | 77.1 |
| Social media use by type, Internet advertising | 27 | 51.50 | 58.10 | 60.8 |
| Cloud computing services | 27 | 33.30 | 40.40 | 46.5 |
| Cash/Firm Value | 27 | 10.22 | 5.12 | 5.27 |
| Enterprise Value/EBIT | 27 | 16.23 | 16.41 | 14.33 |
| Enterprise Value/Sales | 27 | 2.22 | 2.22 | 1.77 |
| Variable | Valid N | Mean | Median | Minimum | Maximum | Std. Dev. |
|---|---|---|---|---|---|---|
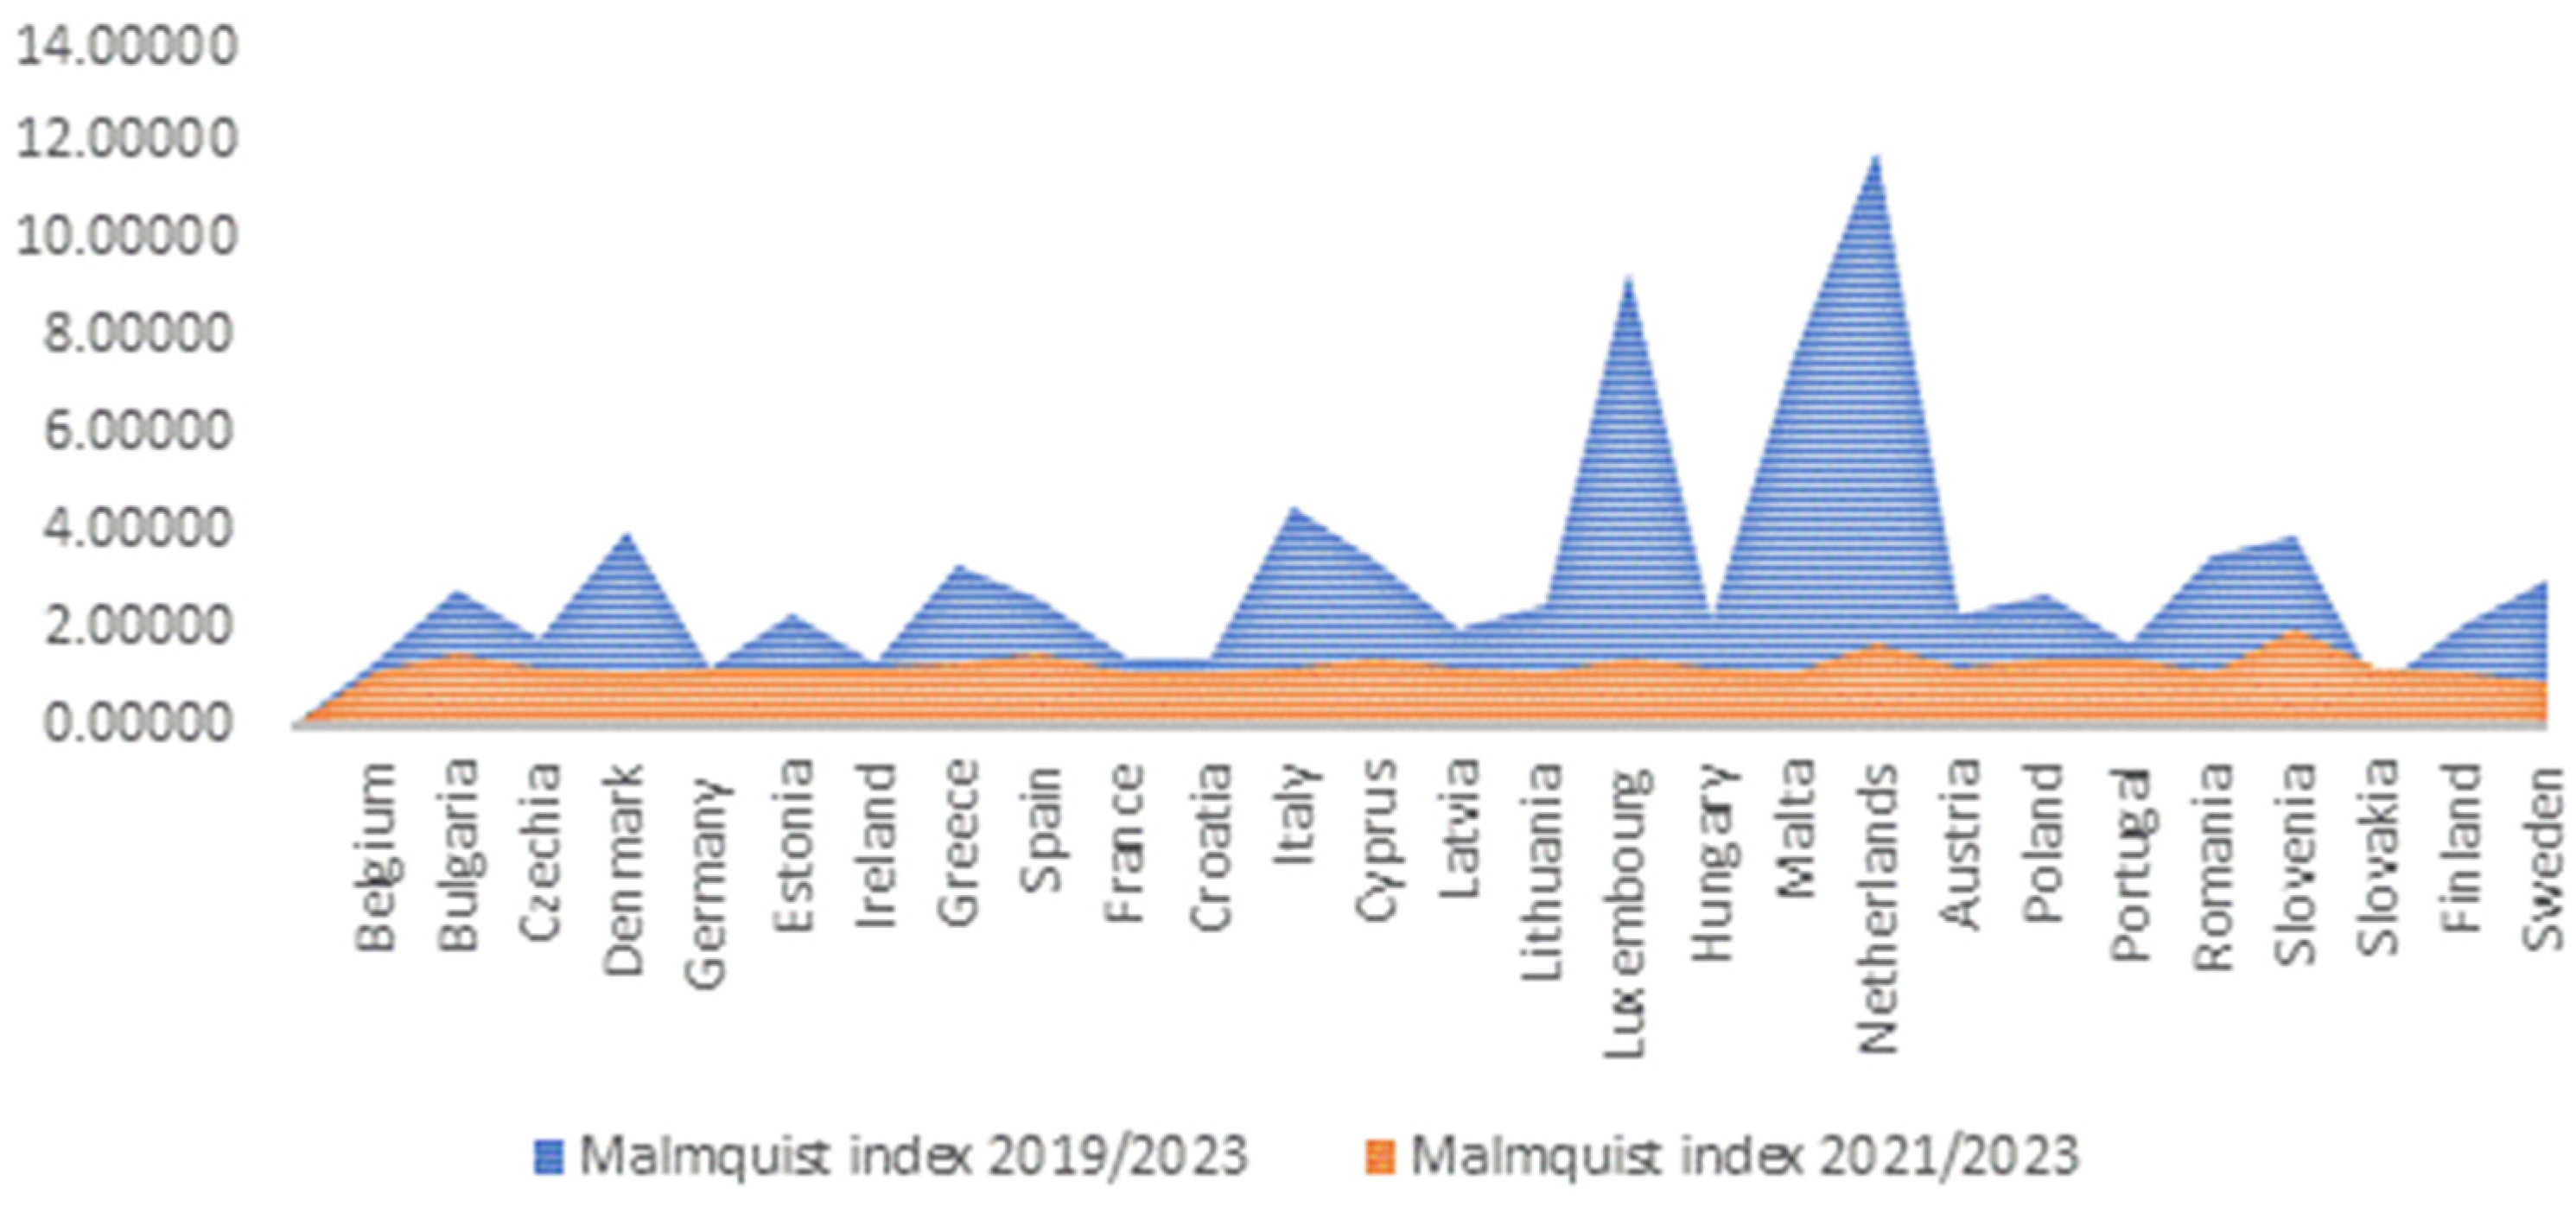
| Malmquist index 19_23 | 27 | 3.23 | 2.54 | 0.78 | 11.83 | 2.54 |
| Malmquist index 21_23 | 27 | 1.27 | 1.18 | 0.96 | 2.04 | 0.22 |
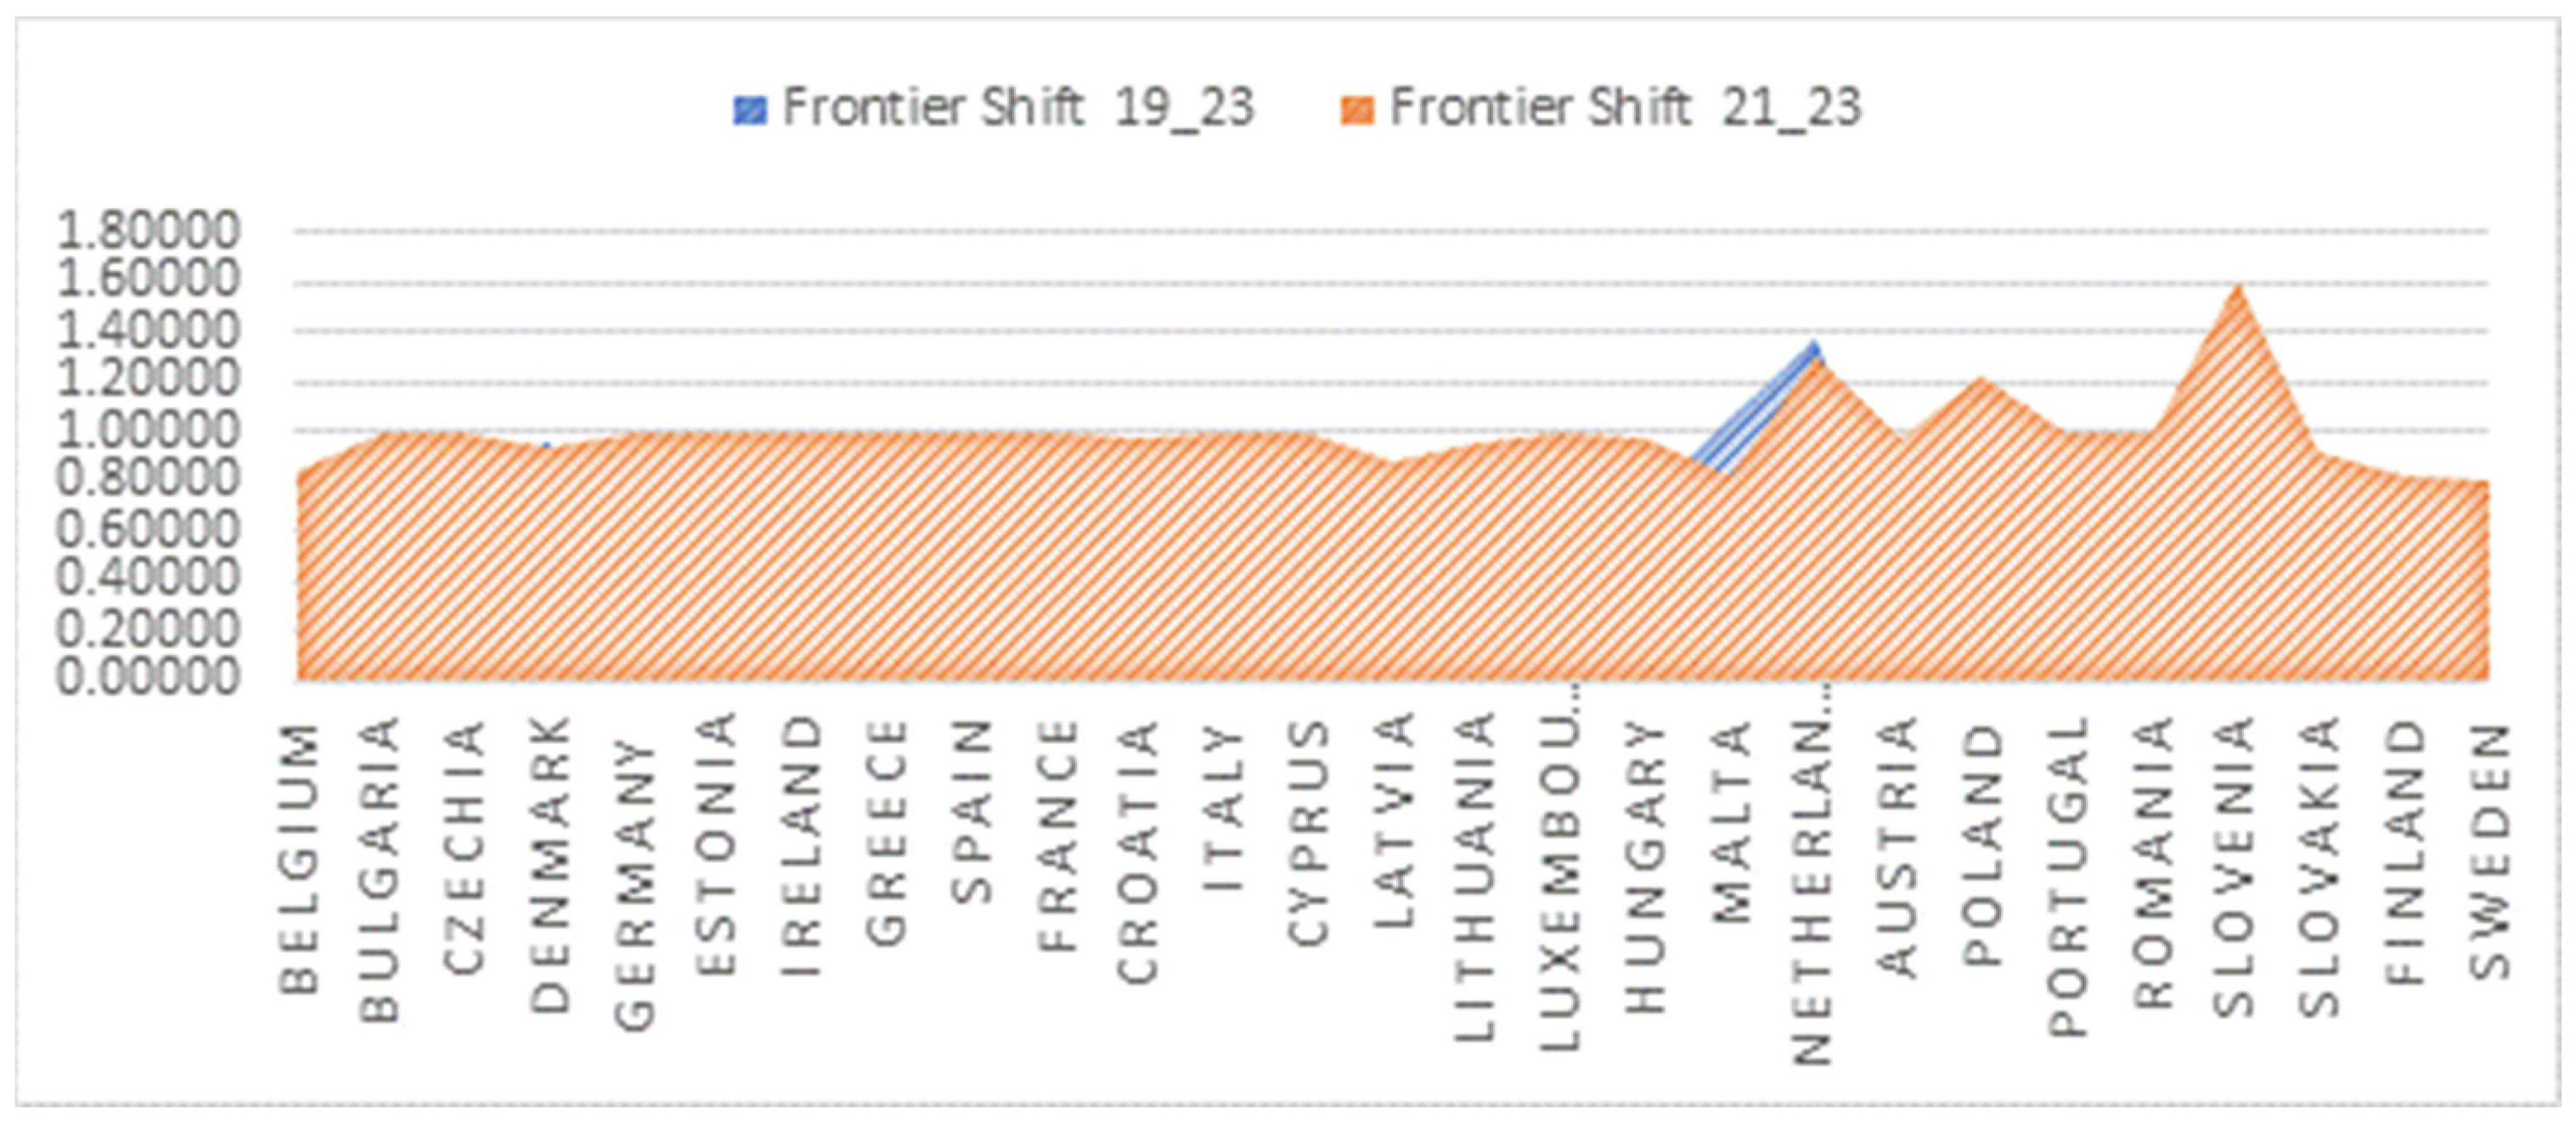
| Frontier shift 19_23 | 27 | 0.79 | 0.83 | 0.40 | 1.37 | 0.26 |
| Frontier shift 21_23 | 27 | 1.00 | 1.00 | 0.81 | 1.61 | 0.16 |
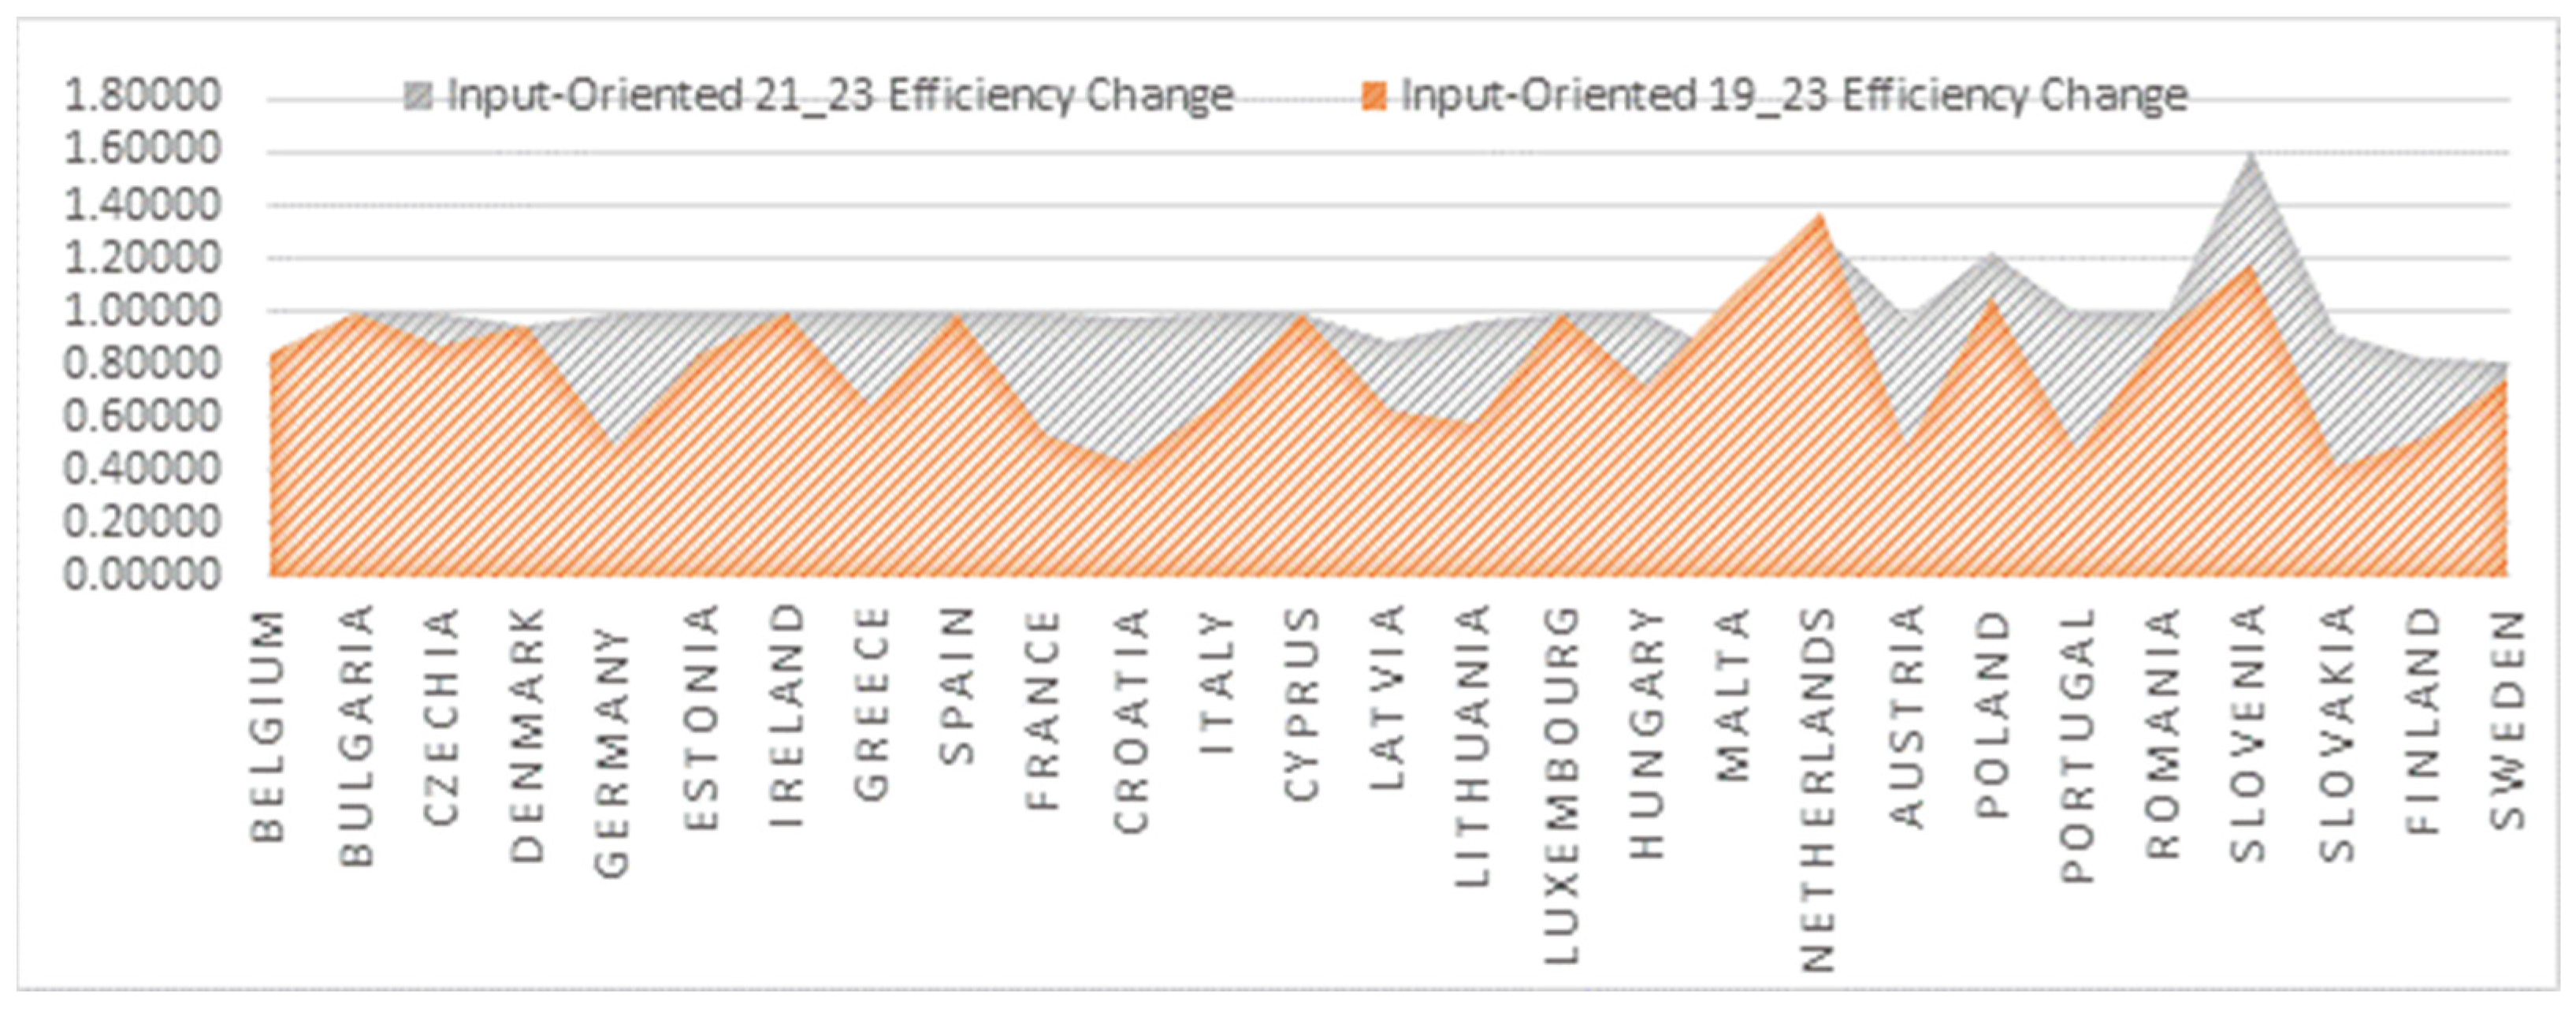
| Efficiency change 19_23 | 27 | 0.79 | 0.83 | 0.43 | 1.37 | 0.26 |
| Efficiency change 21_23 | 27 | 1.00 | 1.00 | 0.81 | 1.61 | 0.16 |
Disclaimer/Publisher’s Note: The statements, opinions and data contained in all publications are solely those of the individual author(s) and contributor(s) and not of MDPI and/or the editor(s). MDPI and/or the editor(s) disclaim responsibility for any injury to people or property resulting from any ideas, methods, instructions or products referred to in the content. |
© 2024 by the authors. Licensee MDPI, Basel, Switzerland. This article is an open access article distributed under the terms and conditions of the Creative Commons Attribution (CC BY) license (https://creativecommons.org/licenses/by/4.0/).
Share and Cite
Horváthová, J.; Mokrišová, M. Measuring the Efficiency of Introducing Businesses’ Digitalization Elements over Time in Relation to Their Performance. Eng. Proc. 2024, 68, 13. https://doi.org/10.3390/engproc2024068013
Horváthová J, Mokrišová M. Measuring the Efficiency of Introducing Businesses’ Digitalization Elements over Time in Relation to Their Performance. Engineering Proceedings. 2024; 68(1):13. https://doi.org/10.3390/engproc2024068013
Chicago/Turabian StyleHorváthová, Jarmila, and Martina Mokrišová. 2024. "Measuring the Efficiency of Introducing Businesses’ Digitalization Elements over Time in Relation to Their Performance" Engineering Proceedings 68, no. 1: 13. https://doi.org/10.3390/engproc2024068013
APA StyleHorváthová, J., & Mokrišová, M. (2024). Measuring the Efficiency of Introducing Businesses’ Digitalization Elements over Time in Relation to Their Performance. Engineering Proceedings, 68(1), 13. https://doi.org/10.3390/engproc2024068013