Proceeding Paper

Estimation and Prediction of Cereal Production Using Normalized Difference Vegetation Index Time Series (Sentinel-2) Data in Central Spain †

1
Departamento de Ingeniería Agroforestal, ETSIAAB, Universidad Politécnica de Madrid (UPM), Avda. Complutense 3, 28040 Madrid, Spain
2
Quasar Science Resources S.L., Camino de las Ceudas 2, Las Rozas de Madrid, 28232 Madrid, Spain
3
Departamento de Física de la Tierra y Astrofísica, Universidad Complutense de Madrid (UCM), Plaza de Ciencias, 1, Ciudad Universitaria, 28040 Madrid, Spain
4
Centro de Estudios e Investigación para la Gestión de Riesgos Agrarios y Medioambientales (CEIGRAM), Universidad Politécnica de Madrid (UPM), C/Senda del Rey 13 Campus Sur de prácticas de la ETSIAAB, 28040 Madrid, Spain
5
Departamento de Economía Agraria, Estadística y Gestión de Empresas, ETSIAAB, Universidad Politécnica de Madrid (UPM), Avda. Complutense 3, 28040 Madrid, Spain
*
Authors to whom correspondence should be addressed.
Presented at the 10th International Conference on Time Series and Forecasting, Gran Canaria, Spain, 15–17 July 2024.
Eng. Proc. 2024, 68(1), 26; https://doi.org/10.3390/engproc2024068026
Published: 8 July 2024

Abstract

:
Estimating production in cereal fields allows farmers to obtain information on improving management in their following campaigns and avoiding losses. The main objective of this work was to estimate grain production in cereals (wheat and barley) in the 2019 and 2020 campaigns in three provinces of Central Spain. The model was based on the prediction of the maximum values of the Sentinel-2 Normalized Difference Vegetation Index (NDVI) time series with ARIMA and multiple linear regression models. The highest correlation was found between grain yield and the variables’ five-month cumulative rainfall and maximum greenness (NDVImax).

1. Introduction

Agriculture in Spain is an important economic sector, with a usable agricultural area of approximately 17 million hectares, where over 5.8 million hectares are used for grain crops like wheat and barley [1]. In Spain, one of the most important agricultural areas is Castilla y León (CyL), where 3.5 million hectares are sown with a predominance of rainfed arable crops such as wheat, oats, rye, and other cereals. Castilla y León has 2.04 million hectares of cereals, 45.4% of which are in the provinces to be analyzed. This area is divided into the following: (1) Burgos with 19.4%, (2) Palencia with 14.9%, and (3) Soria with 11.1% [2].
Due to the importance of agriculture and the variability of the Mediterranean climate, predicting crop yields is essential for optimizing farming practices and improving the financial management of agri-food farms. Being able to analyze predicted yields is essential for both policy makers and farmers’ organizations to develop and implement appropriate management policies [3]. Access to a large amount of data with sufficient temporal resolution is therefore essential for the development of effective predictive models.
Remote sensing data obtained from satellites such as Sentinel-2 of the European Space Agency (ESA) are very useful for monitoring due to their high resolution, such as spatial resolution (10 m) and temporal (5 days). With these images, different vegetation indices such as the Normalized Difference Vegetation Index (NDVI) can be calculated, allowing us to monitor and understand the health of vegetation.
For this work, the autoregressive integrated moving average (ARIMA) models introduced in the 1970s by Box and Jenkins [4] were used, in which time series are modeled as a stationary stochastic process.
The main objective is to predict the maximum NDVI that crops (wheat and barley) can reach in the study area and, through this maximum NDVI, estimate cereal production.

2. Materials and Methods
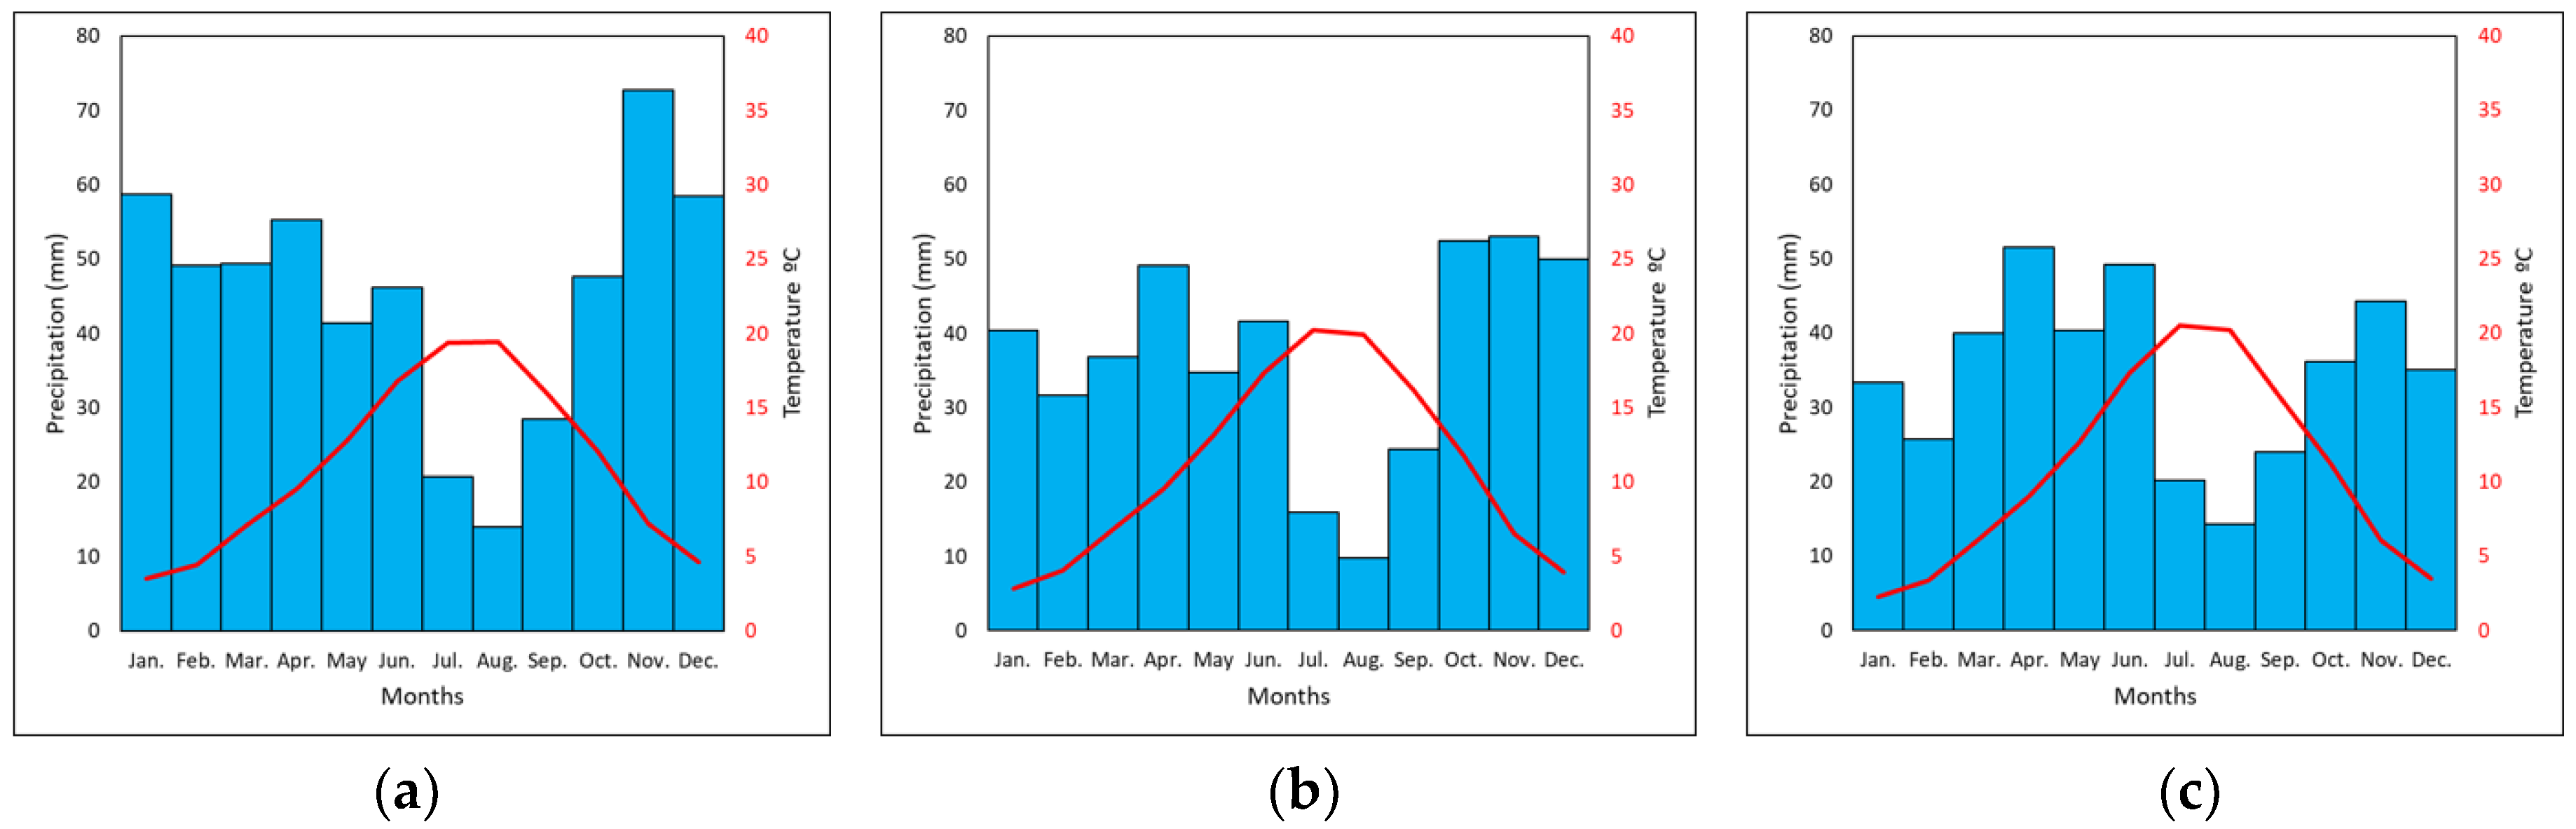
2.1. Study Region

The study area (Figure 1) comprises the provinces of Burgos, Palencia, and Soria, located in the autonomous community of “Castilla y León” in the northern part of the central plateau in the Iberian Peninsula. The high orographic diversity results in considerable variations in terms of climate and landscape.
Palencia and Burgos are the most northern provinces in this study, bounding in the north with the Cantabrian Mountain range. Burgos is also delimited in the northeast by the Sierra de la Demanda, which acts as a boundary between this province and La Rioja and Álava. In the north of Burgos, we can also find the Ebro valley. In the central and southern areas of these provinces, we find a wide plain where we can find the largest number of cultivated hectares in these provinces. In the middle area of Burgos, we find the Duero valley.
Soria is located to the southeast of Burgos and is the southernmost province in the study. In the northern area, we find the Iberian Mountain range, where the Duero River rises, which flows southwards until it reaches the middle area of the province and from there begins to flow westwards.
Crops are mainly distributed among two types of climates, according to the Köppen classification [5]. The Csb is defined by seasonal rainfall and warm summer temperatures with dry summers; it is in Palencia and the southern areas of Burgos and Soria. Meanwhile, Cfb is a temperate climate without dry season, which is located to the north of Burgos and east of Soria. Figure 2 shows the climodiagrams of a representative area for each province in our study area to understand the rainy seasons of each province.

2.2. Data Source and Processing

2.2.1. Meteorological Data

Monthly precipitation data for the period 2017–2021 provided by the State Meteorological Agency (AEMET) were used to estimate the predictive model. The accumulated rainfall of the last five months prior to the NDVImax was used. Rainfall at critical moments within the crop phenological cycle is essential for the crop to obtain its maximum yield [6].

2.2.2. Data Yield of Wheat and Barley

Wheat and barley production information, used for modeling and validation, was obtained from the “Encuesta de Superficies y Rendimientos de Cultivos” (ESYRCE) in the period 2017–2022 [7]. This information was collected by specialists along the whole National Territory between May and September. Only the years 2019 and 2020 were analyzed due to a lack of information on cereal yields. For the analysis, 20 plots were used for 2019 and 21 were used for 2020. Table 1 shows the total area data and annual cereal production in each province.

2.2.3. Sentinel-2 Data
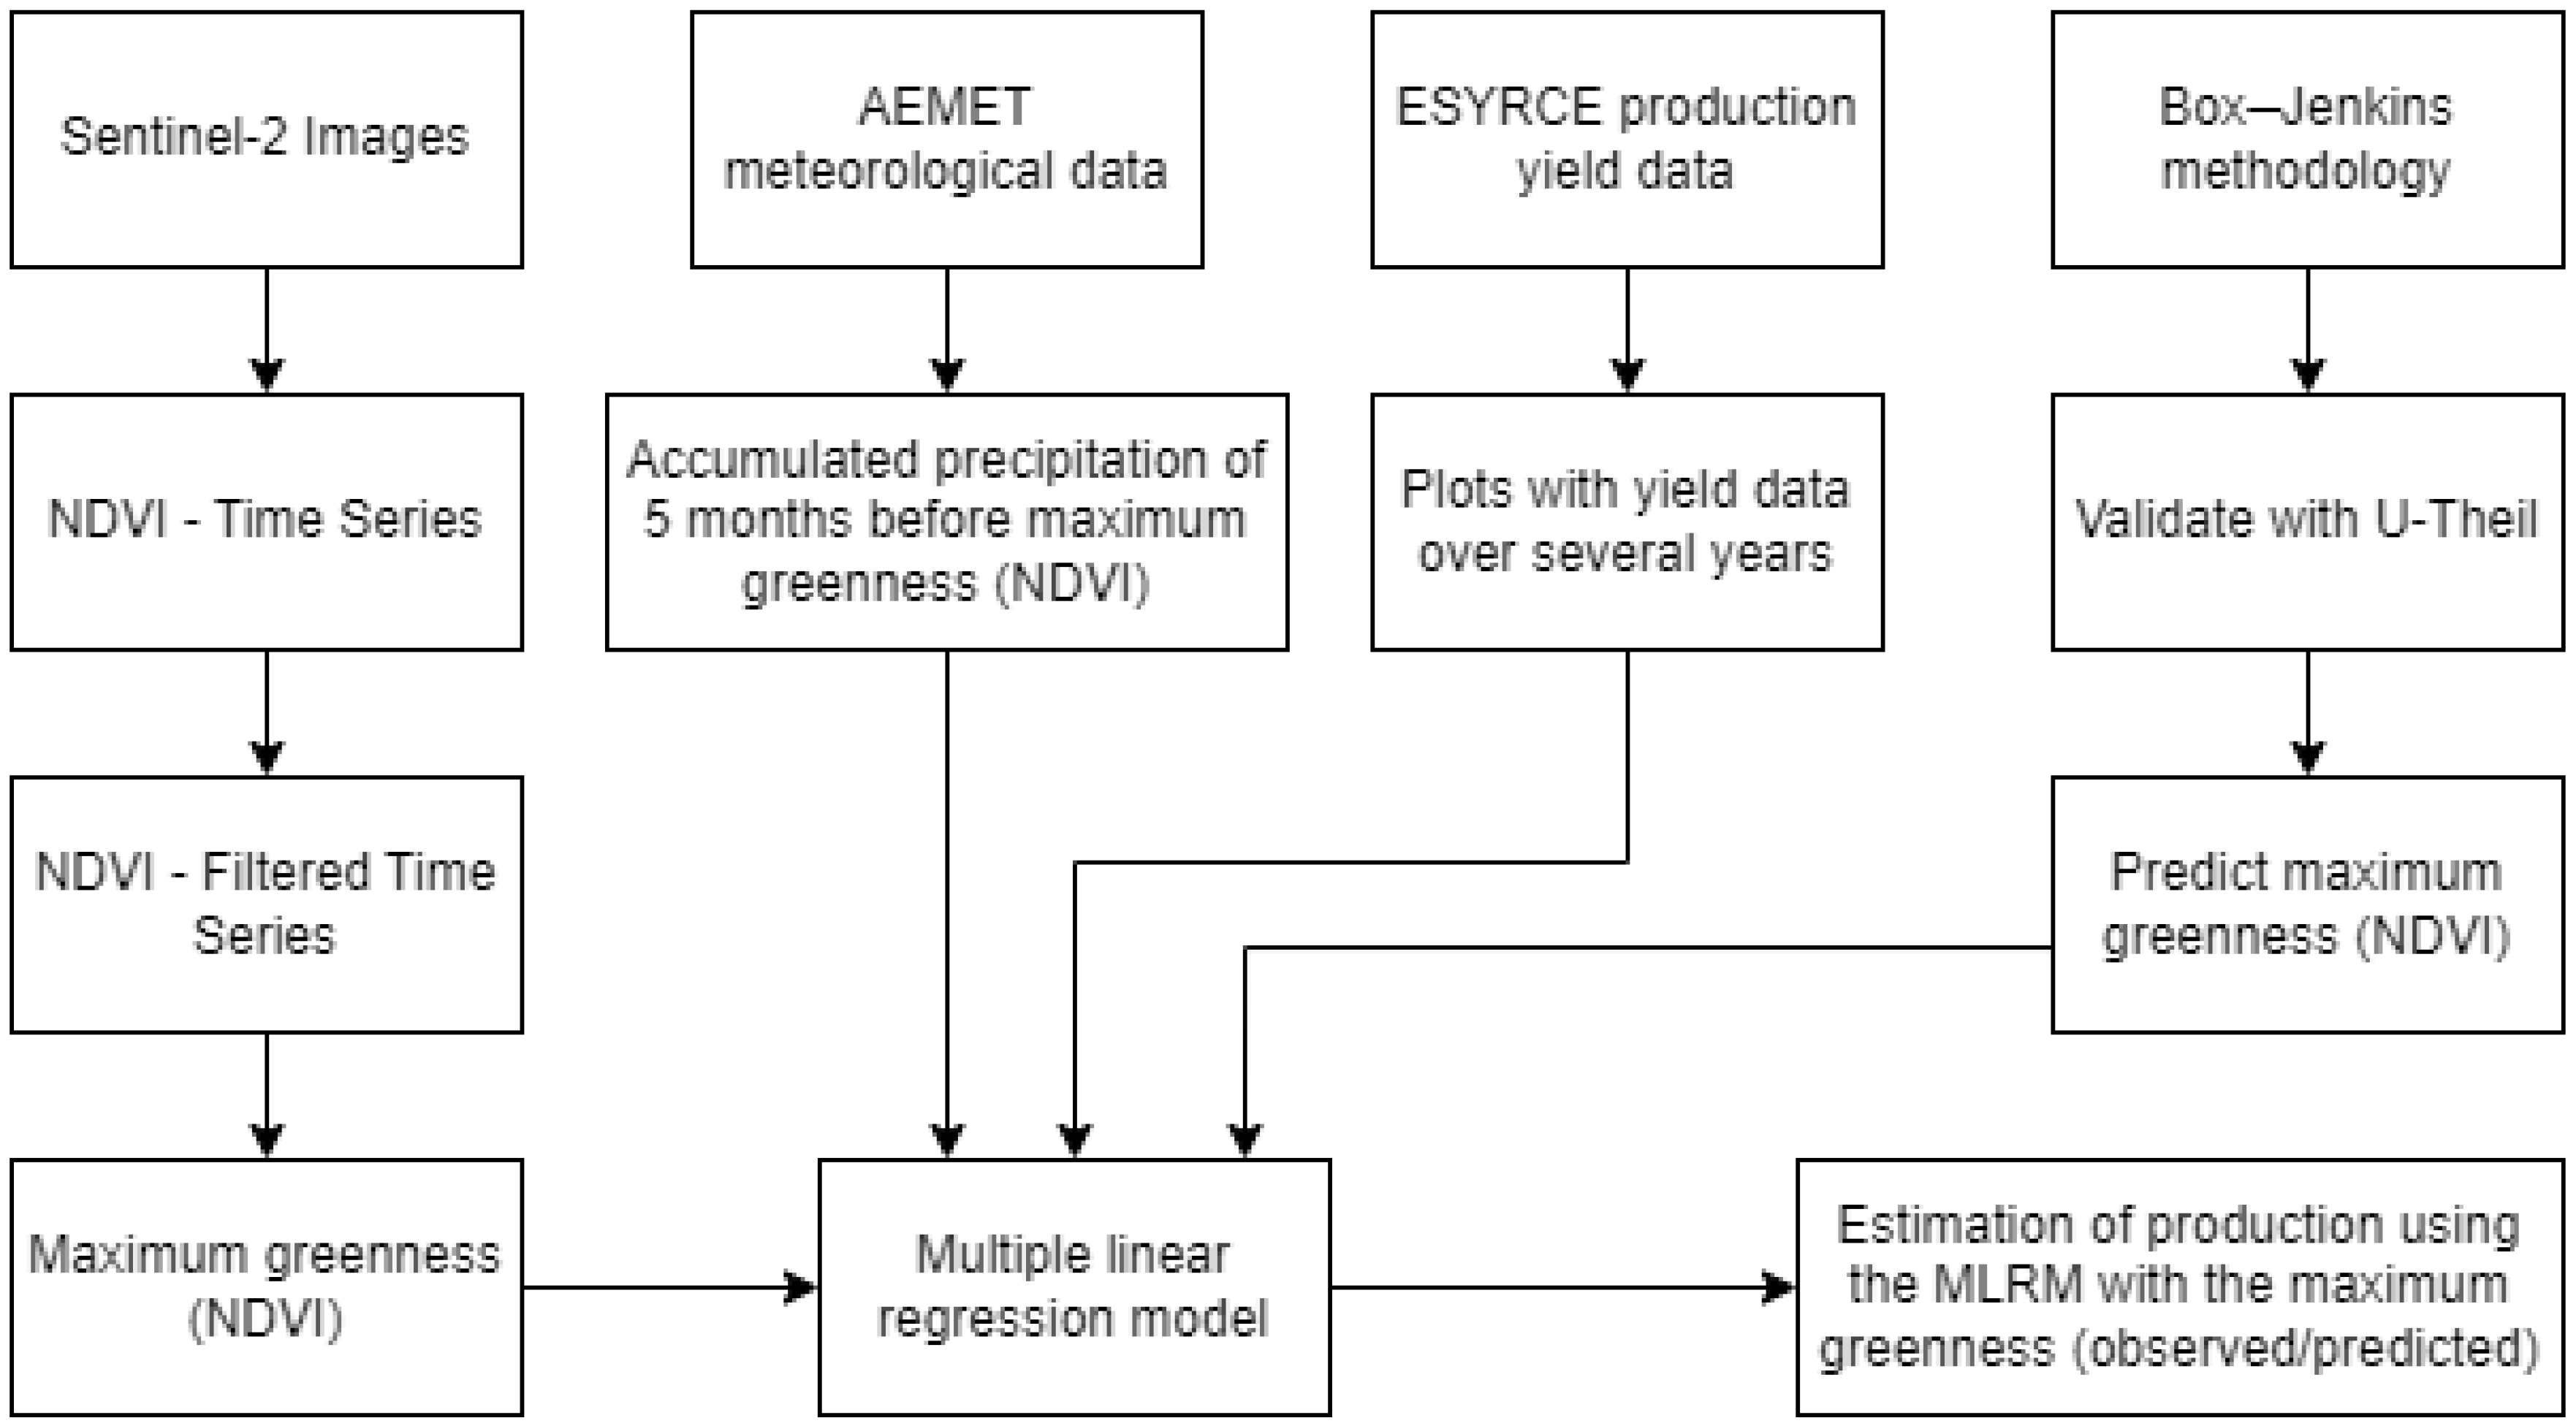
Sentinel is a multi-satellite project developed by the ESA (European Space Agency) in the framework of the Copernicus Program. The Sentinel-2 MSI system includes two satellites with optical sensors that have been acquiring land surface information every 10 days by Sentinel-2A since late 2015 and every 5 days after the launch of Sentinel-2B in 2017.
The availability of a high temporal resolution combined with the high spatial resolution (10, 20, and 60 m) is excellent for the development of indicators to analyze the vegetation functioning in different land covers. This is especially interesting in cases where spatial variability is high due to different crops or environmental gradients.
The Sentinel-2 images (10 m) from the period 2017–2023 and the tiles 30TVM (Burgos), 30TUN (Palencia), and 30TWM (Soria) were downloaded from https://dataspace.copernicus.eu/ (accessed on 30 October 2023).

2.3. Methodology

The methodology followed in this study is shown in Figure 3, and each of the steps are explained in this section.

2.4. Research Methods

2.4.1. Calculation of NDVI and Compilation of Time Series

The Normalized Difference Vegetation Index (NDVI) [8] is a measure used in remote sensing to assess the health and density of vegetation. The NDVI is, worldwide, the most widely used and the most comprehensive source of information for monitoring vegetation. The NDVI value (Equation (1)), calculated for each selected pixel of the image, takes values between −1 and 1 for no vegetation and dense vegetation, respectively.
NDVI = (NIR − RED)/(NIR + RED),
where:
-
RNIR: reflectance in the near-infrared band (NIR) (band b8 in Sentinel-2);
-
RRED: reflectance in the red band (RED) (band b4 in Sentinel-2).
To build the time series, the images of the NDVI were ordered chronologically and compiled (stack). After this procedure, the stack of each tile was filtered with the Whittaker filter [9] to reduce noise (i.e., clouds, atmospheric conditions, sensor failures).

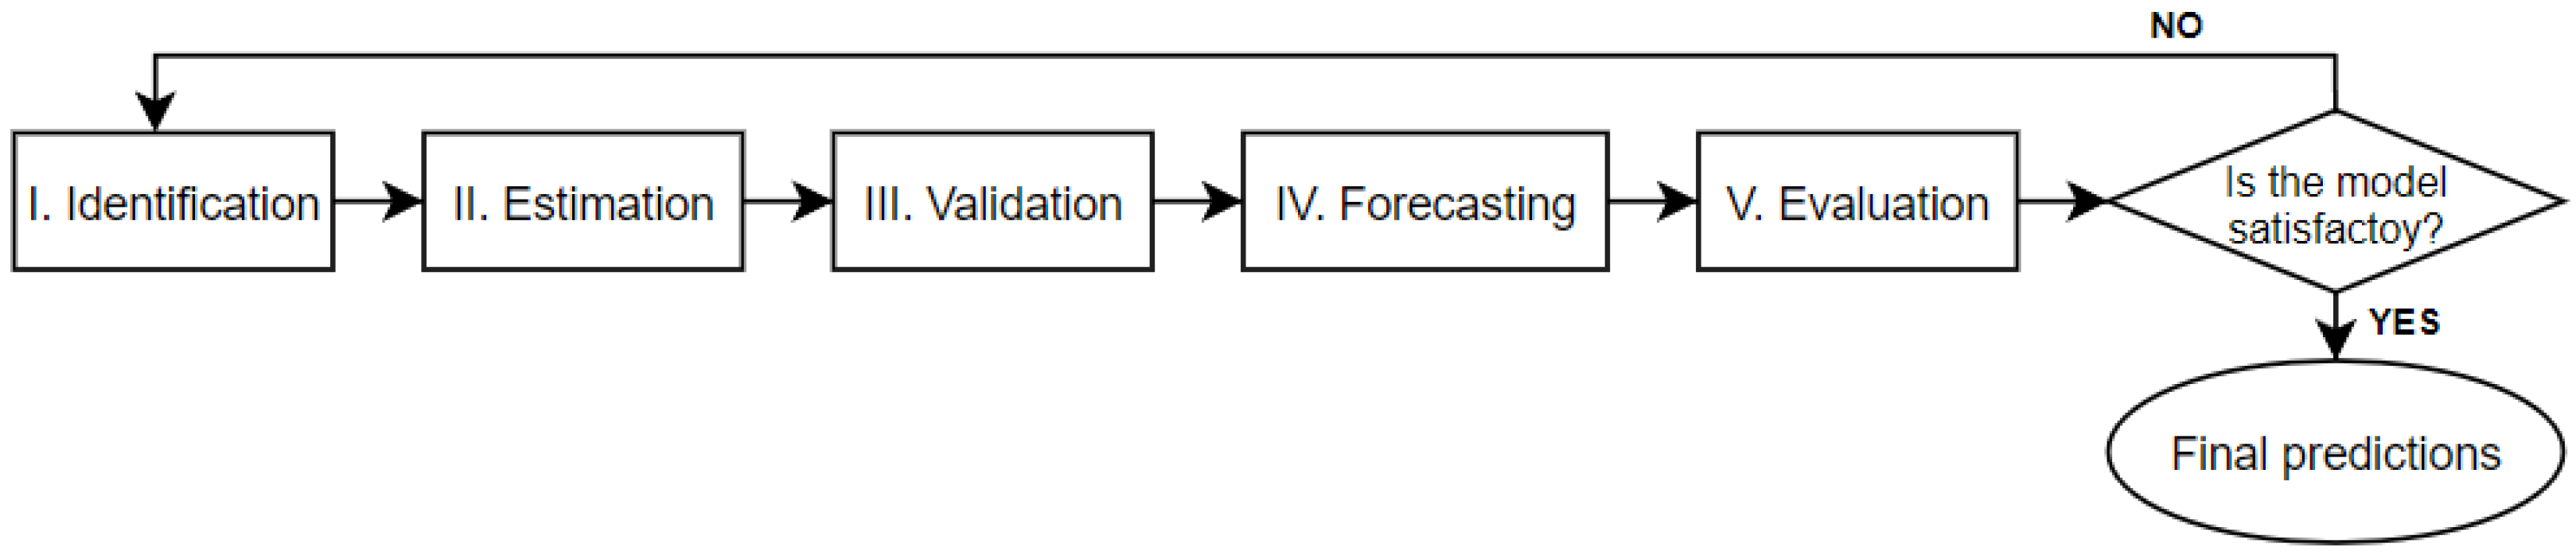
2.4.2. NDVI Time Series Modeling

NDVI time series dynamics reflect vegetation conditions influenced by climate and other factors, resulting in significant seasonality with an annual pattern repeated every 73 observations (temporal resolution 5 days) based on the frequency of Sentinel-2 data; this seasonality is the main reason for non-stationarity in the NDVI time series. Figure 4 shows the procedure of the Box and Jenkins methodology implemented to model and forecast the filtered NDVI time series.
I.
Identification.
In this step, the dynamics of the NDVI time series were analyzed, and their characteristic components, seasonality, cycles, trends, and structural changes were identified. The regular and seasonal autoregressive and moving-average parameters were determined based on the identification outcomes to effectively capture the dynamics of the time series.
II.
Estimation.
Nonlinear least squares methods were used to estimate the models selected in the previous stage, and the significance of the model parameters was evaluated by Student’s t and F tests.
III.
Validation.
The adequacy of the estimated models was assessed using the autocorrelation in the model residuals through the Ljung–Box Q statistic [10]. If the test reveals that a substantial amount of residual autocorrelation persists in the estimated models, the model is considered invalid, and returning to the Identification step is necessary.
IV.
Forecasting.
The observed NDVI time series values were predicted using the validated ARIMA models.
V.
Evaluation.
The predictive capacity of the models was assessed using Theil’s U inequality coefficient [11]. This coefficient, ranging from 0 to 1, measures the prediction accuracy regardless of measurement scale. A perfect prediction yields U = 0, while U = 1 indicates a naive prediction (Equation (2)). Theil’s U also aids in identifying sources of prediction error, divided into three proportions: bias (UB), variance (UV), and covariance (UC). A desirable prediction features bias and variance proportions close to zero, with most error concentrated in covariance. The sum of the 3 proportions is equal to 1.
U = [ i = 1 n F i O i 2 ] 1 2 [ i = 1 n O i 2 ] 1 2
where:
U = Theil’s U inequality coefficient;
Fi = forecasted variable;
Oi = observed variable;
n = number of observations.

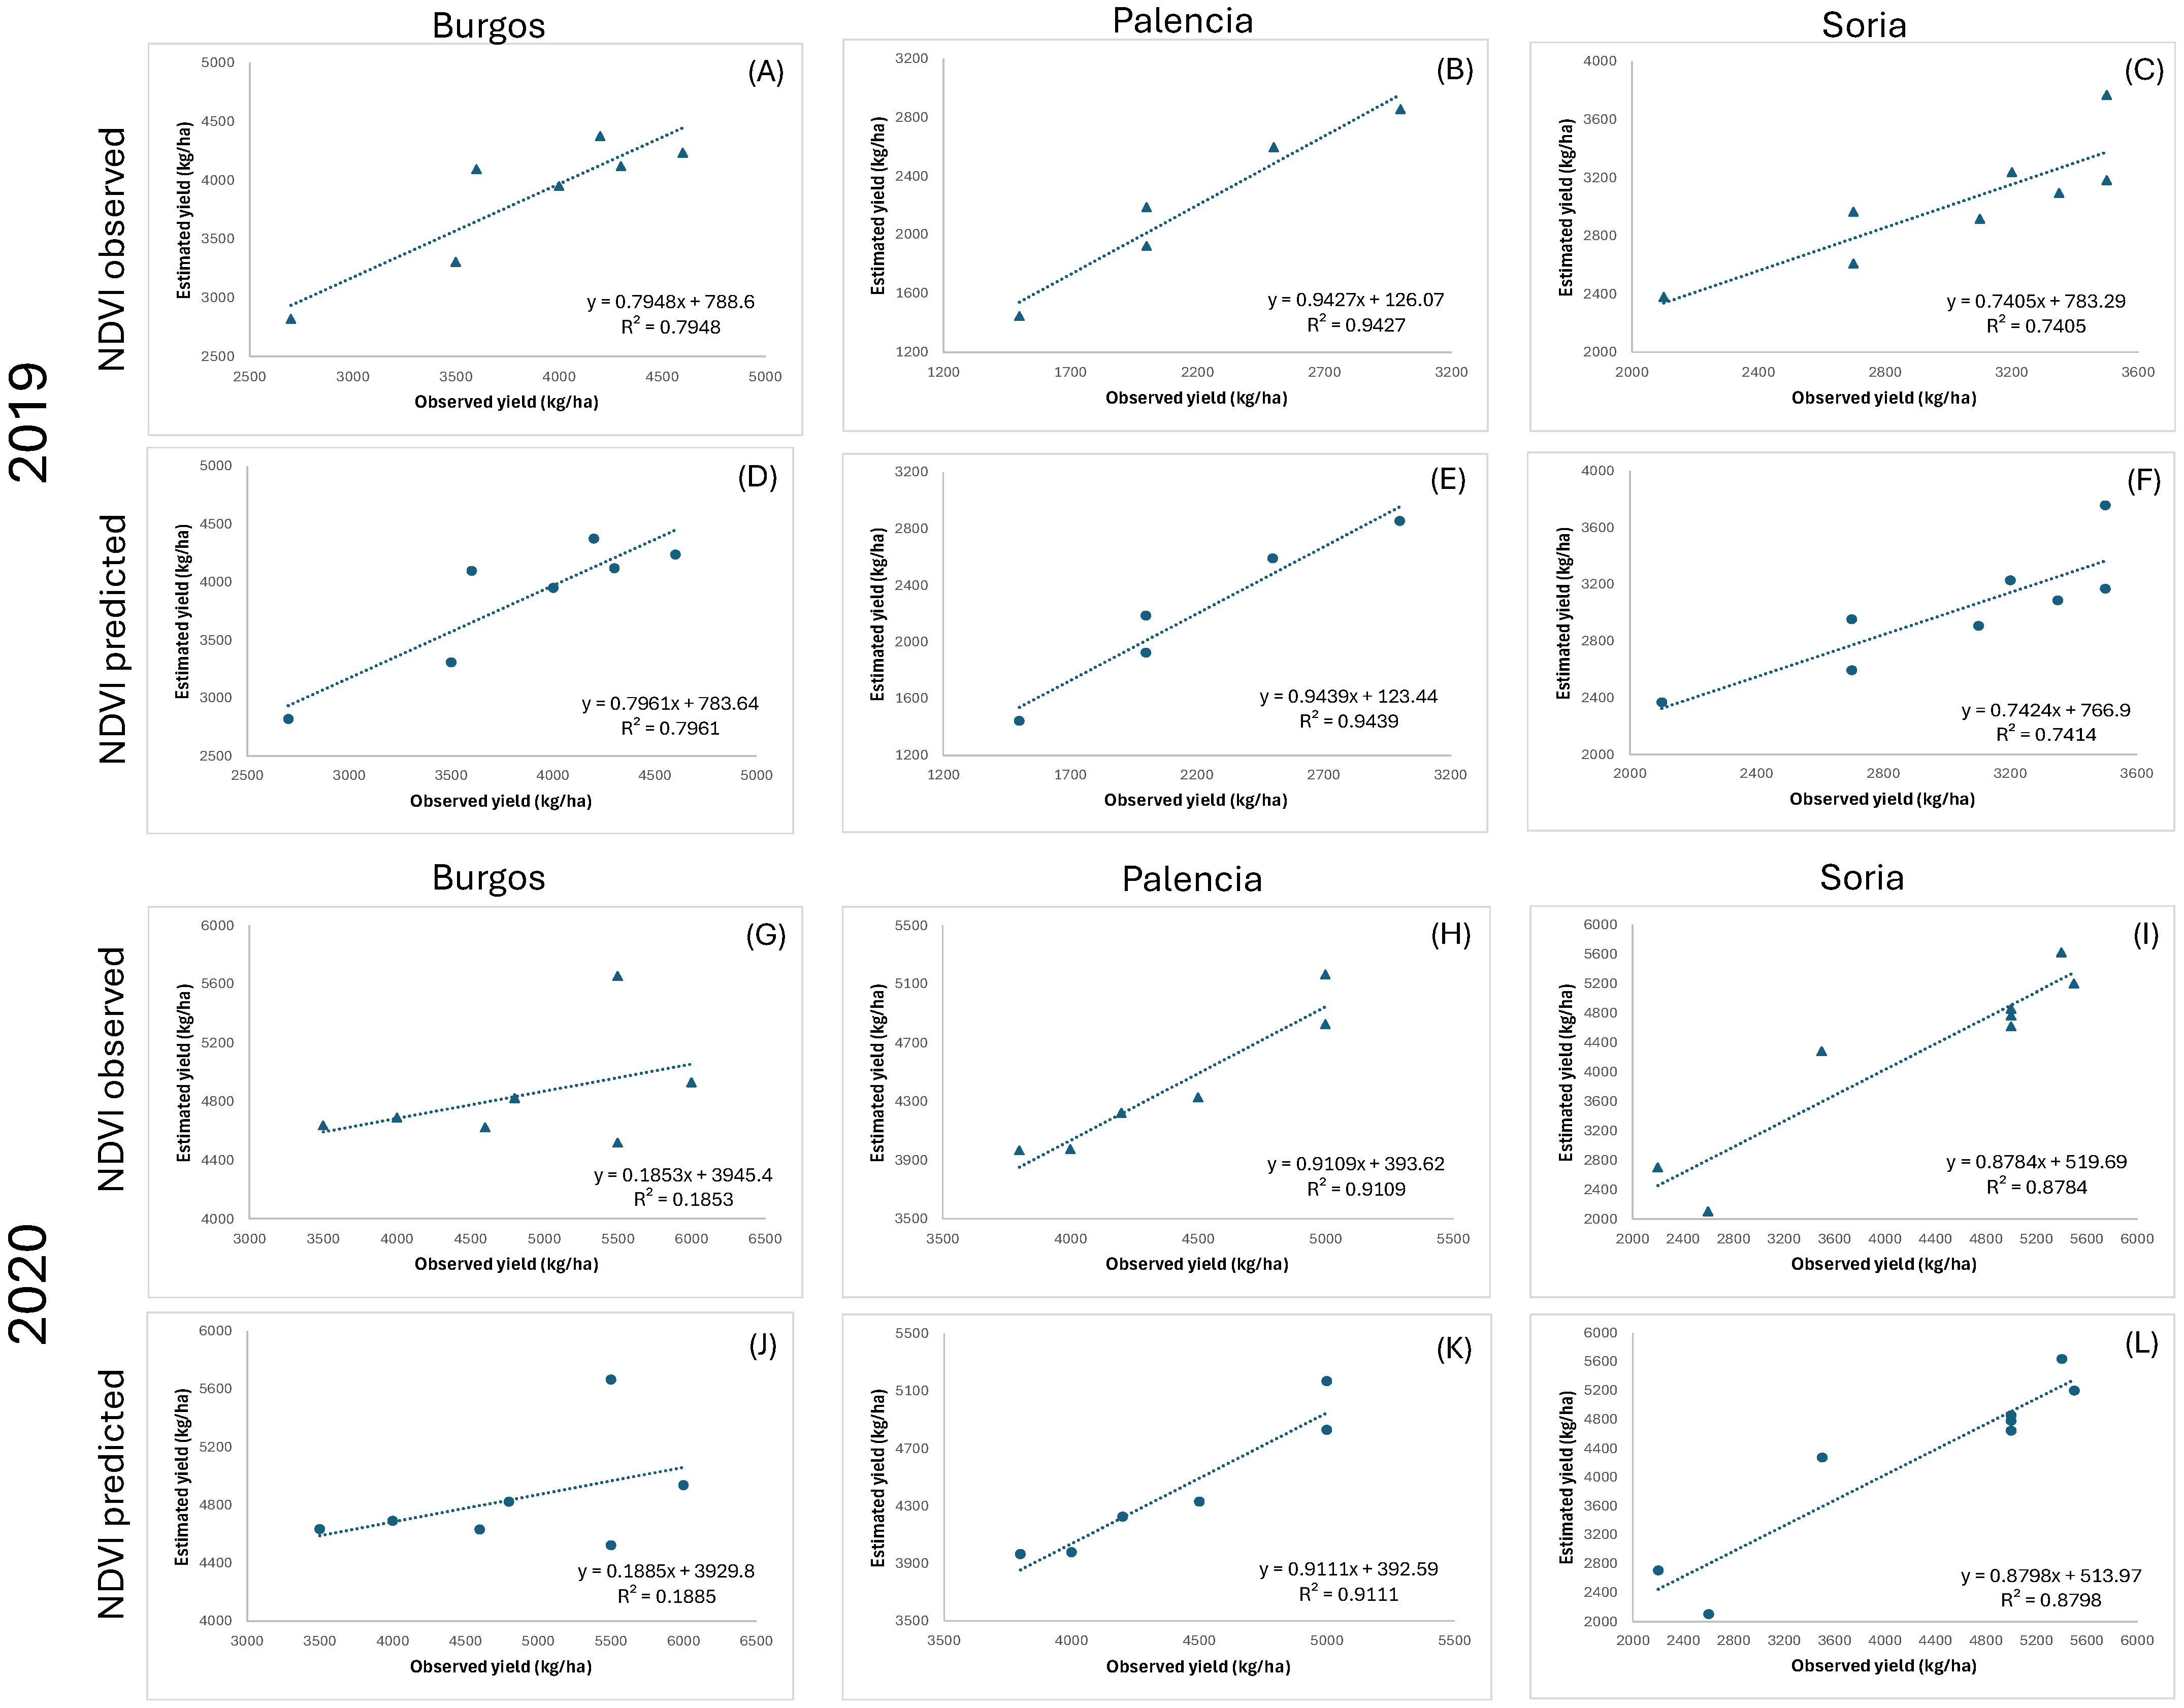
2.4.3. Multiple Linear Regression Model

The multiple linear regression model (Equation (3)) is used to model the relationship between multiple independent variables and a dependent variable. The model assumes a linear relationship between the predictors and the response variable, where the effect of each predictor on the response is additive and constant.
Y j = β 0 + β 1 X 1 j + β 2 X 2 j + + β k X k j + u j
where Y is the dependent variable, X1, X2, …, Xk are the independent variables, β0 is the intercept, β1, β2, …, βk are the coefficients representing the effect of each predictor, and u is the error term. The independent variables are the NDVImax value of each plot and the cumulative rainfall of the five months before NDVImax.
Statistical analyses were conducted using SAS 9.2, while image processing was performed using ENVI 4.7.

3. Results

Figure 5 shows the observed NDVI time series and the time series predicted with the ARIMA model, emphasizing the maximum values of the NDVI for the campaigns studied.
Table 2 shows the accuracy of the nine plot model forecasts using Theil’s U inequality coefficient, which is broken down into three proportions: (1) the bias proportion (UB), (2) the variance ratio (UV), and (3) the proportion of covariance (UC). In all cases, Theil’s U inequality coefficient was near to zero, showing a good model predictive capacity. In addition, most of the error was concentrated in the proportion of covariance, indicating the good accuracy of the forecasts.
Figure 6 shows the scatterplots of the observed and predicted yield obtained after applying the multiple linear regression models for the two scenarios: (1) observed NDVImax and (2) predicted NDVImax for the three provinces and different years (2019 and 2020).

4. Discussion and Conclusions

Theil’s U index showed a good fit of the predicted values to the original time series despite the shortness of the Sentinel-2 time series compared to others such as Landsat or MODIS. The maximum NDVI estimated from the predicted NDVI time series showed similar values to those estimated from the original time series.
The multiple linear regression models demonstrate a strong correlation between the predicted maximum NDVI and climatic variables. Palencia showed a higher relationship, with R2 = 0.94 and R2 = 0.91 in 2019 and 2020, respectively, followed by Soria with lower correlation in both years (R2 = 0.74 and R2 = 0.87). Iranzo et al. [12], using Sentinel-2 NDVI values at specific dates and multiple linear regression models, found a significant correlation between yield and the NDVI and precipitation. On the other hand, Burgos showed significantly low values (Figure 6g) in 2020 (R2 = 0.18). This may be related to the high variability of yield values among plots observed in this province, which may have a relevant influence on the models’ results.
This work examined the capability of using Sentinel-2 NDVI time series to estimate cereal grain production in three provinces of Spain with different climatic conditions and high spatial resolution. The multiple linear regression models demonstrated a high correlation of accumulated precipitation and maximum greenness (NDVImax) of the crop cycle with grain yield. The results obtained demonstrate that Sentinel-2 is a good tool to obtain accurate yield estimates; this is partially due to its high spatial resolution, which makes it possible to evaluate the temporal dynamics of pure pixels from each specific crop.

Author Contributions

Conceptualization, C.S. and A.B.-S.; methodology, C.S. and A.B.-S.; software, T.P. and D.M.; validation, C.S. and A.B.-S.; formal analysis, C.S., A.P.-O. and J.L.; investigation, C.S., A.B.-S., V.C., T.P., D.M., A.P.-O. and J.L.; resources, C.S., A.B.-S. and V.C.; data curation, C.S. and A.B.-S.; writing—original draft preparation, C.S., A.B.-S. and V.C.; writing—review and editing, C.S., A.B.-S., V.C. and A.P.-O.; funding acquisition, C.S. and A.P.-O. All authors have read and agreed to the published version of the manuscript.

Funding

César Sáenz was supported by a predoctoral scholarship awarded by the Community of Madrid and Quasar Science Resources, S.L. (No. IND2020/AMB-17747). In addition, this research was conducted in the framework of the I+D+i Spanish National Project PID2020-115509RB-I00 project (INFOLANDYN) funded by the Ministerio de Ciencia e Innovación of Spain MCIN/AEI/10.13039/501100011033.

Institutional Review Board Statement

Not applicable.

Informed Consent Statement

Not applicable.

Data Availability Statement

Publicly available datasets were analyzed in this study. These data can be found here: https://dataspace.copernicus.eu/ (accessed on 30 October 2023).

Acknowledgments

The authors would like to thank the ESA for providing Sentinel-2 data, AEMET, and ESYRCE. We are especially grateful to the anonymous reviewers and editors for reviewing our manuscript and for offering feedback.

Conflicts of Interest

The authors declare no conflicts of interest. César Sáenz is an employee of the company Quasar Science Resources S.L.

References

  1. Ministerio de Agricultura Pesca y Alimentación. Anuario de Estadística Agraria 2022; Ministerio de Agricultura Pesca y Alimentación: Madrid, Spain, 2022. [Google Scholar]
  2. Consejería de Agricultura Ganadería y Desarrollo Rural. Anuario de Estadística Agraria de Castilla y León 2021; Junta de Castilla y Leon: Valladolid, Spain, 2023. [Google Scholar]
  3. Mancini, A.; Solfanelli, F.; Coviello, L.; Martini, F.M.; Mandolesi, S.; Zanoli, R. Time Series from Sentinel-2 for Organic Durum Wheat Yield Prediction Using Functional Data Analysis and Deep Learning. Agronomy 2024, 14, 109. [Google Scholar] [CrossRef]
  4. Box, G.E.P.; Jenkins, G.M.; Reinsel, G.C. Time Series Analysis: Forecasting and Control, 3rd ed.; Wiley: Englewood Cliffs, NJ, USA, 1994. [Google Scholar]
  5. Köppen, W. Das Geographische System der Klimate; Gebrüder Bornträger: Berlin, Germany, 1936. [Google Scholar]
  6. Asadi, S.; Bannayan, M.; Monti, A. The Association of Crop Production and Precipitation; a Comparison of Two Methodologies. Arid. Land Res. Manag. 2019, 33, 155–176. [Google Scholar] [CrossRef]
  7. Ministerio de Agricultura Pesca y Alimentación. Encuesta Sobre Superficies y Rendimientos de Cultivos Publicación Elaborada Por La; Ministerio de Agricultura Pesca y Alimentación: Madrid, Spain, 2022. [Google Scholar]
  8. Tucker, C.J. Red and Photographic Infrared Linear Combinations for Monitoring Vegetation. Remote Sens. Environ. 1979, 8, 127–150. [Google Scholar] [CrossRef]
  9. Whittaker, E. On a New Method of Graduation. Proc. Edinb. Math. Soc. 1923, 41, 63–75. [Google Scholar] [CrossRef]
  10. Ljung, G.M.; Box, G.E.P. On a Measure of Lack of Fit in Time Series Models. Biometrika 1978, 65, 297–303. [Google Scholar] [CrossRef]
  11. Theil, H. Principles of Econometrics; John Wiley & Sons.: New York, NY, USA, 1971. [Google Scholar]
  12. Iranzo, C.; Montorio, R.; García-Martín, A. Estimation of Barley Yield from Sentinel-1 and Sentinel-2 Imagery and Climatic Variables. Rev. Teledetec. 2022, 2022, 61–72. [Google Scholar] [CrossRef]
Figure 1. Study area: different tiles from Sentinel-2 Burgos (30TVM), Palencia (30TUN), and Soria (30TWM).
Engproc 68 00026 g001
Figure 2. Climodiagrams of the study areas: (a) Burgos, (b) Palencia, and (c) Soria.
Engproc 68 00026 g002
Figure 3. Workflow for estimating cereals production using NDVImax.
Engproc 68 00026 g003
Figure 4. Flowchart of the Box and Jenkins methodology.
Engproc 68 00026 g004
Figure 5. Time series of observed and predicted NDVI, with NDVImax for 2019 and 2020.
Engproc 68 00026 g005
Figure 6. The observed and estimated yields (kg/ha) for 2019 in the provinces of Burgos (A,D), Palencia (B,E) and Soria (C,F) compared to the obtained and predicted NDVI also for 2020 in the provinces of: Burgos (G,J), Palencia (H,K) and Soria (I,L). The estimated yields were obtained from the multiple linear regression.
Engproc 68 00026 g006
Table 1. Surface and production of cereals in Castilla y León.
ProvinceArea (ha)Production (Tn)
Burgos396,6351,885,122
Palencia304,1111,268,512
Soria225,639887,833
Total 2,041,4409,213,250
Table 2. Accuracy of the model forecasts for nine time series using Theil’s U.
ProvincePlotU TheilUBUVUC
BurgosBUR_P10.008820.001620.000120.99826
BUR_P20.017050.001940.000200.99786
BUR_P30.017840.002940.000590.99647
PalenciaPAL_P10.038840.001990.001580.99642
PAL_P20.036070.002080.001490.99644
PAL_P30.040290.002010.001360.99663
SoriaSOR_P10.004250.001500.000010.99850
SOR_P20.012550.001630.000110.99826
SOR_P30.007800.001010.000030.99896
Disclaimer/Publisher’s Note: The statements, opinions and data contained in all publications are solely those of the individual author(s) and contributor(s) and not of MDPI and/or the editor(s). MDPI and/or the editor(s) disclaim responsibility for any injury to people or property resulting from any ideas, methods, instructions or products referred to in the content.

