
Assessing the Preprocessing Benefits of Data-Driven Decomposition Methods for Phase Permutation Entropy—Application to Econometric Time Series †


Abstract
1. Introduction
2. Permutation Entropy and Phase Permutation Entropy
3. Results and Discussion
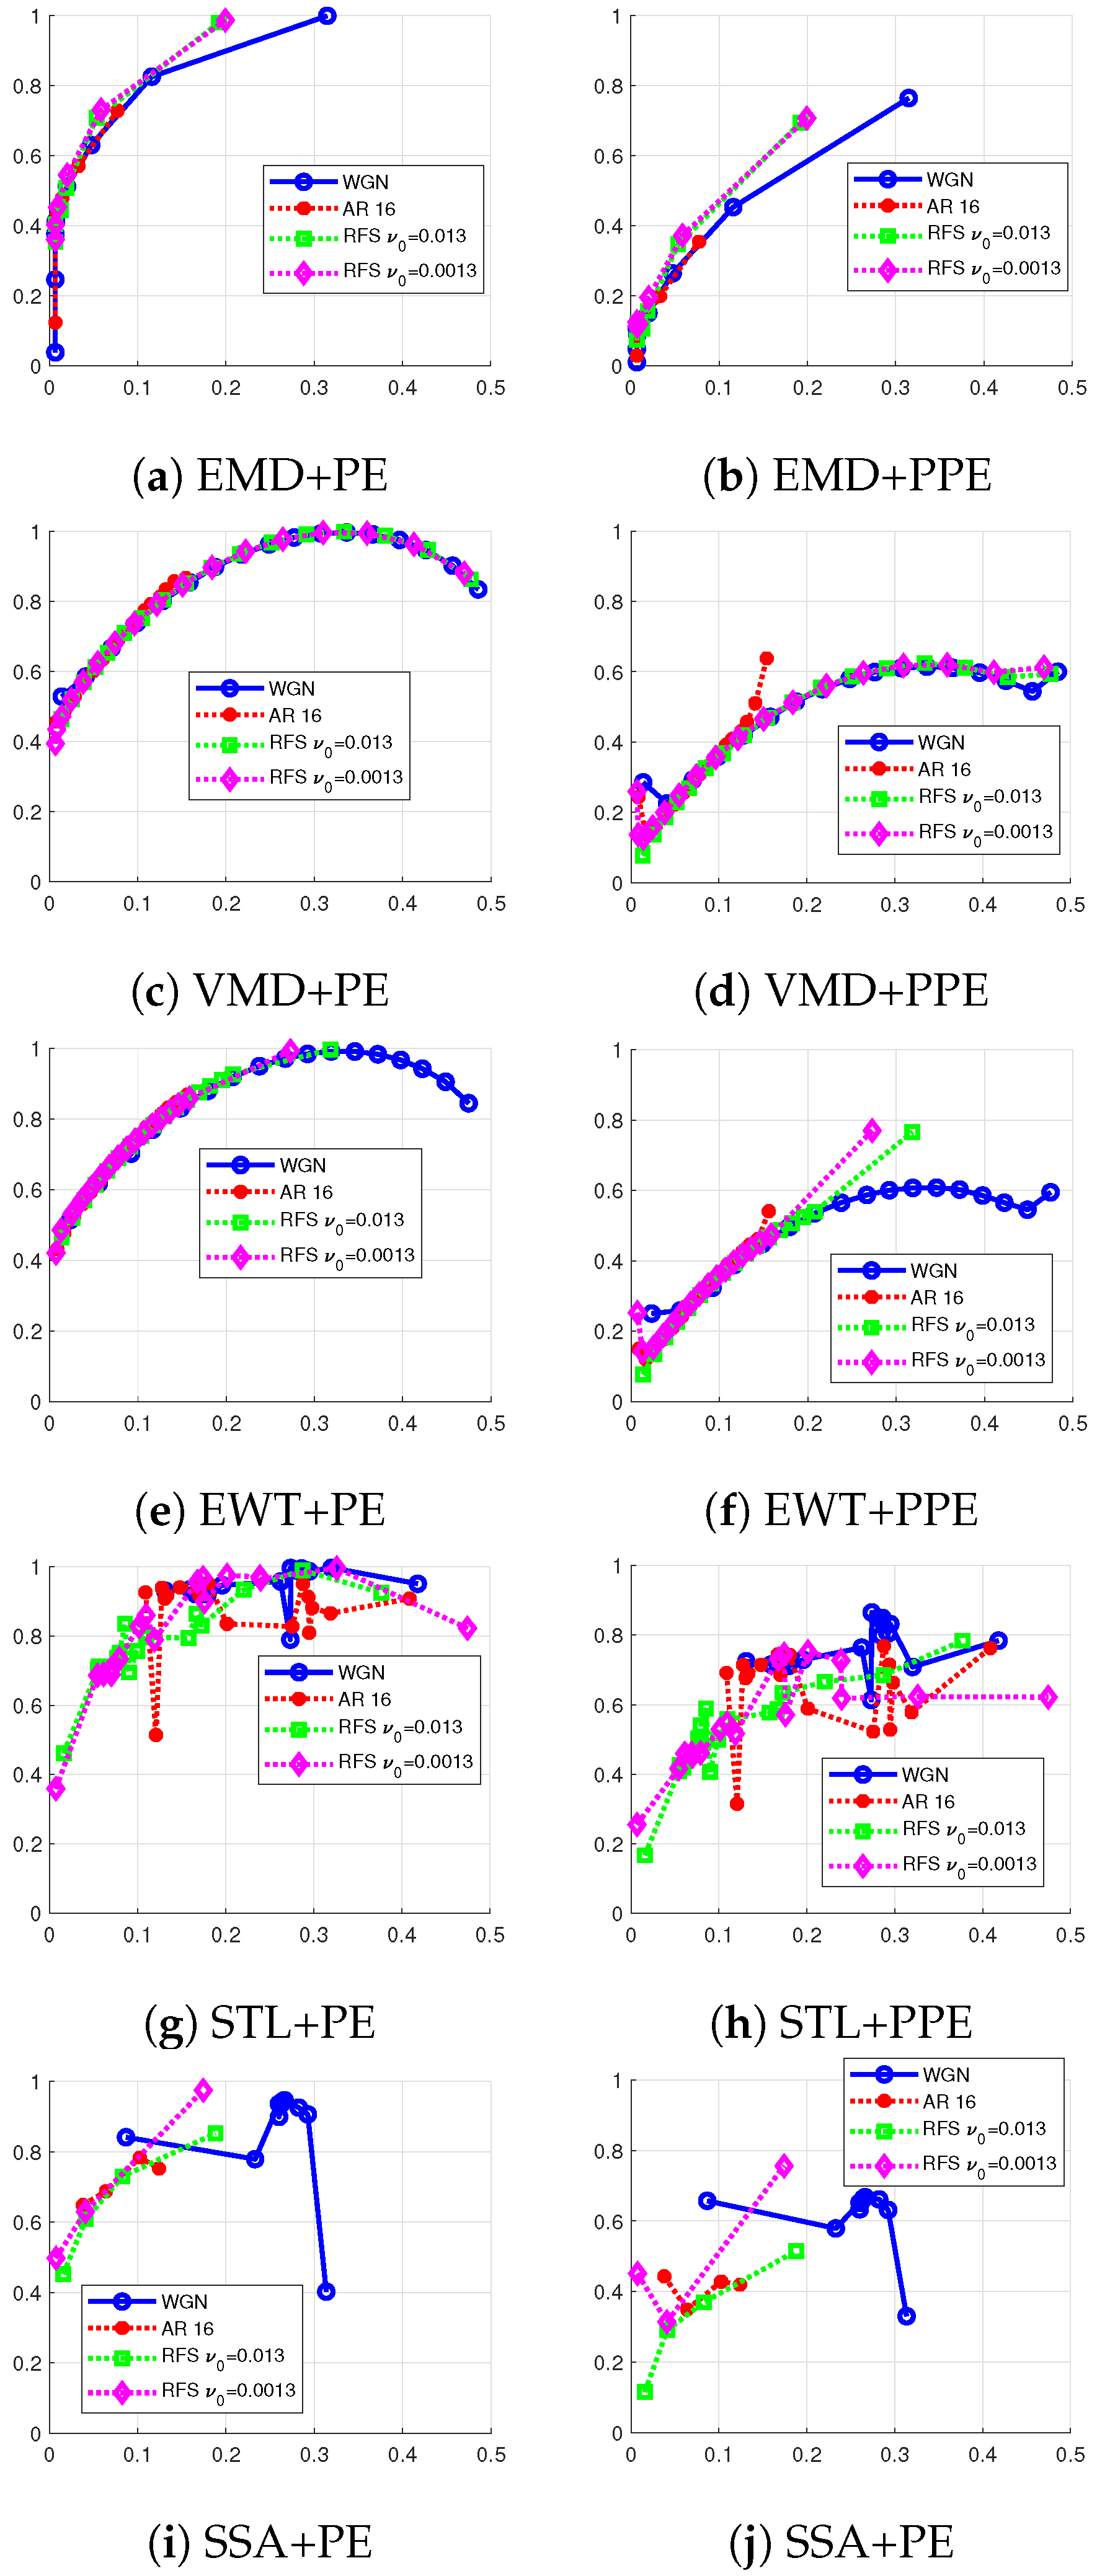
3.1. Simulated Data
- Zero mean white Gaussian noise WGN with unitary variance,
- An autoregressive (AR) model of order 16 whose coefficients are randomly chosen as
- Two random Fourier series with distinct reduced fundamental frequencies, namely, and , defined asThe random Fourier series is a stochastic process that extends the concept of a traditional periodic Fourier series by introducing randomness into its coefficients. The randomization of these coefficients has a smoothing effect (regularity) [9,10]. Indeed, the singularities have no more specific locations but are “spread everywhere”. The independent Rademacher random variables, , take values with equal probabilities, each having a probability of . The deterministic coefficients are assumed to satisfy to ensure the convergence of the time series almost everywhere toward , which in accordance with the Paley–Zygmund theorem [9]. The initial phases are assumed iid with a uniform distribution over the interval and are independent of .
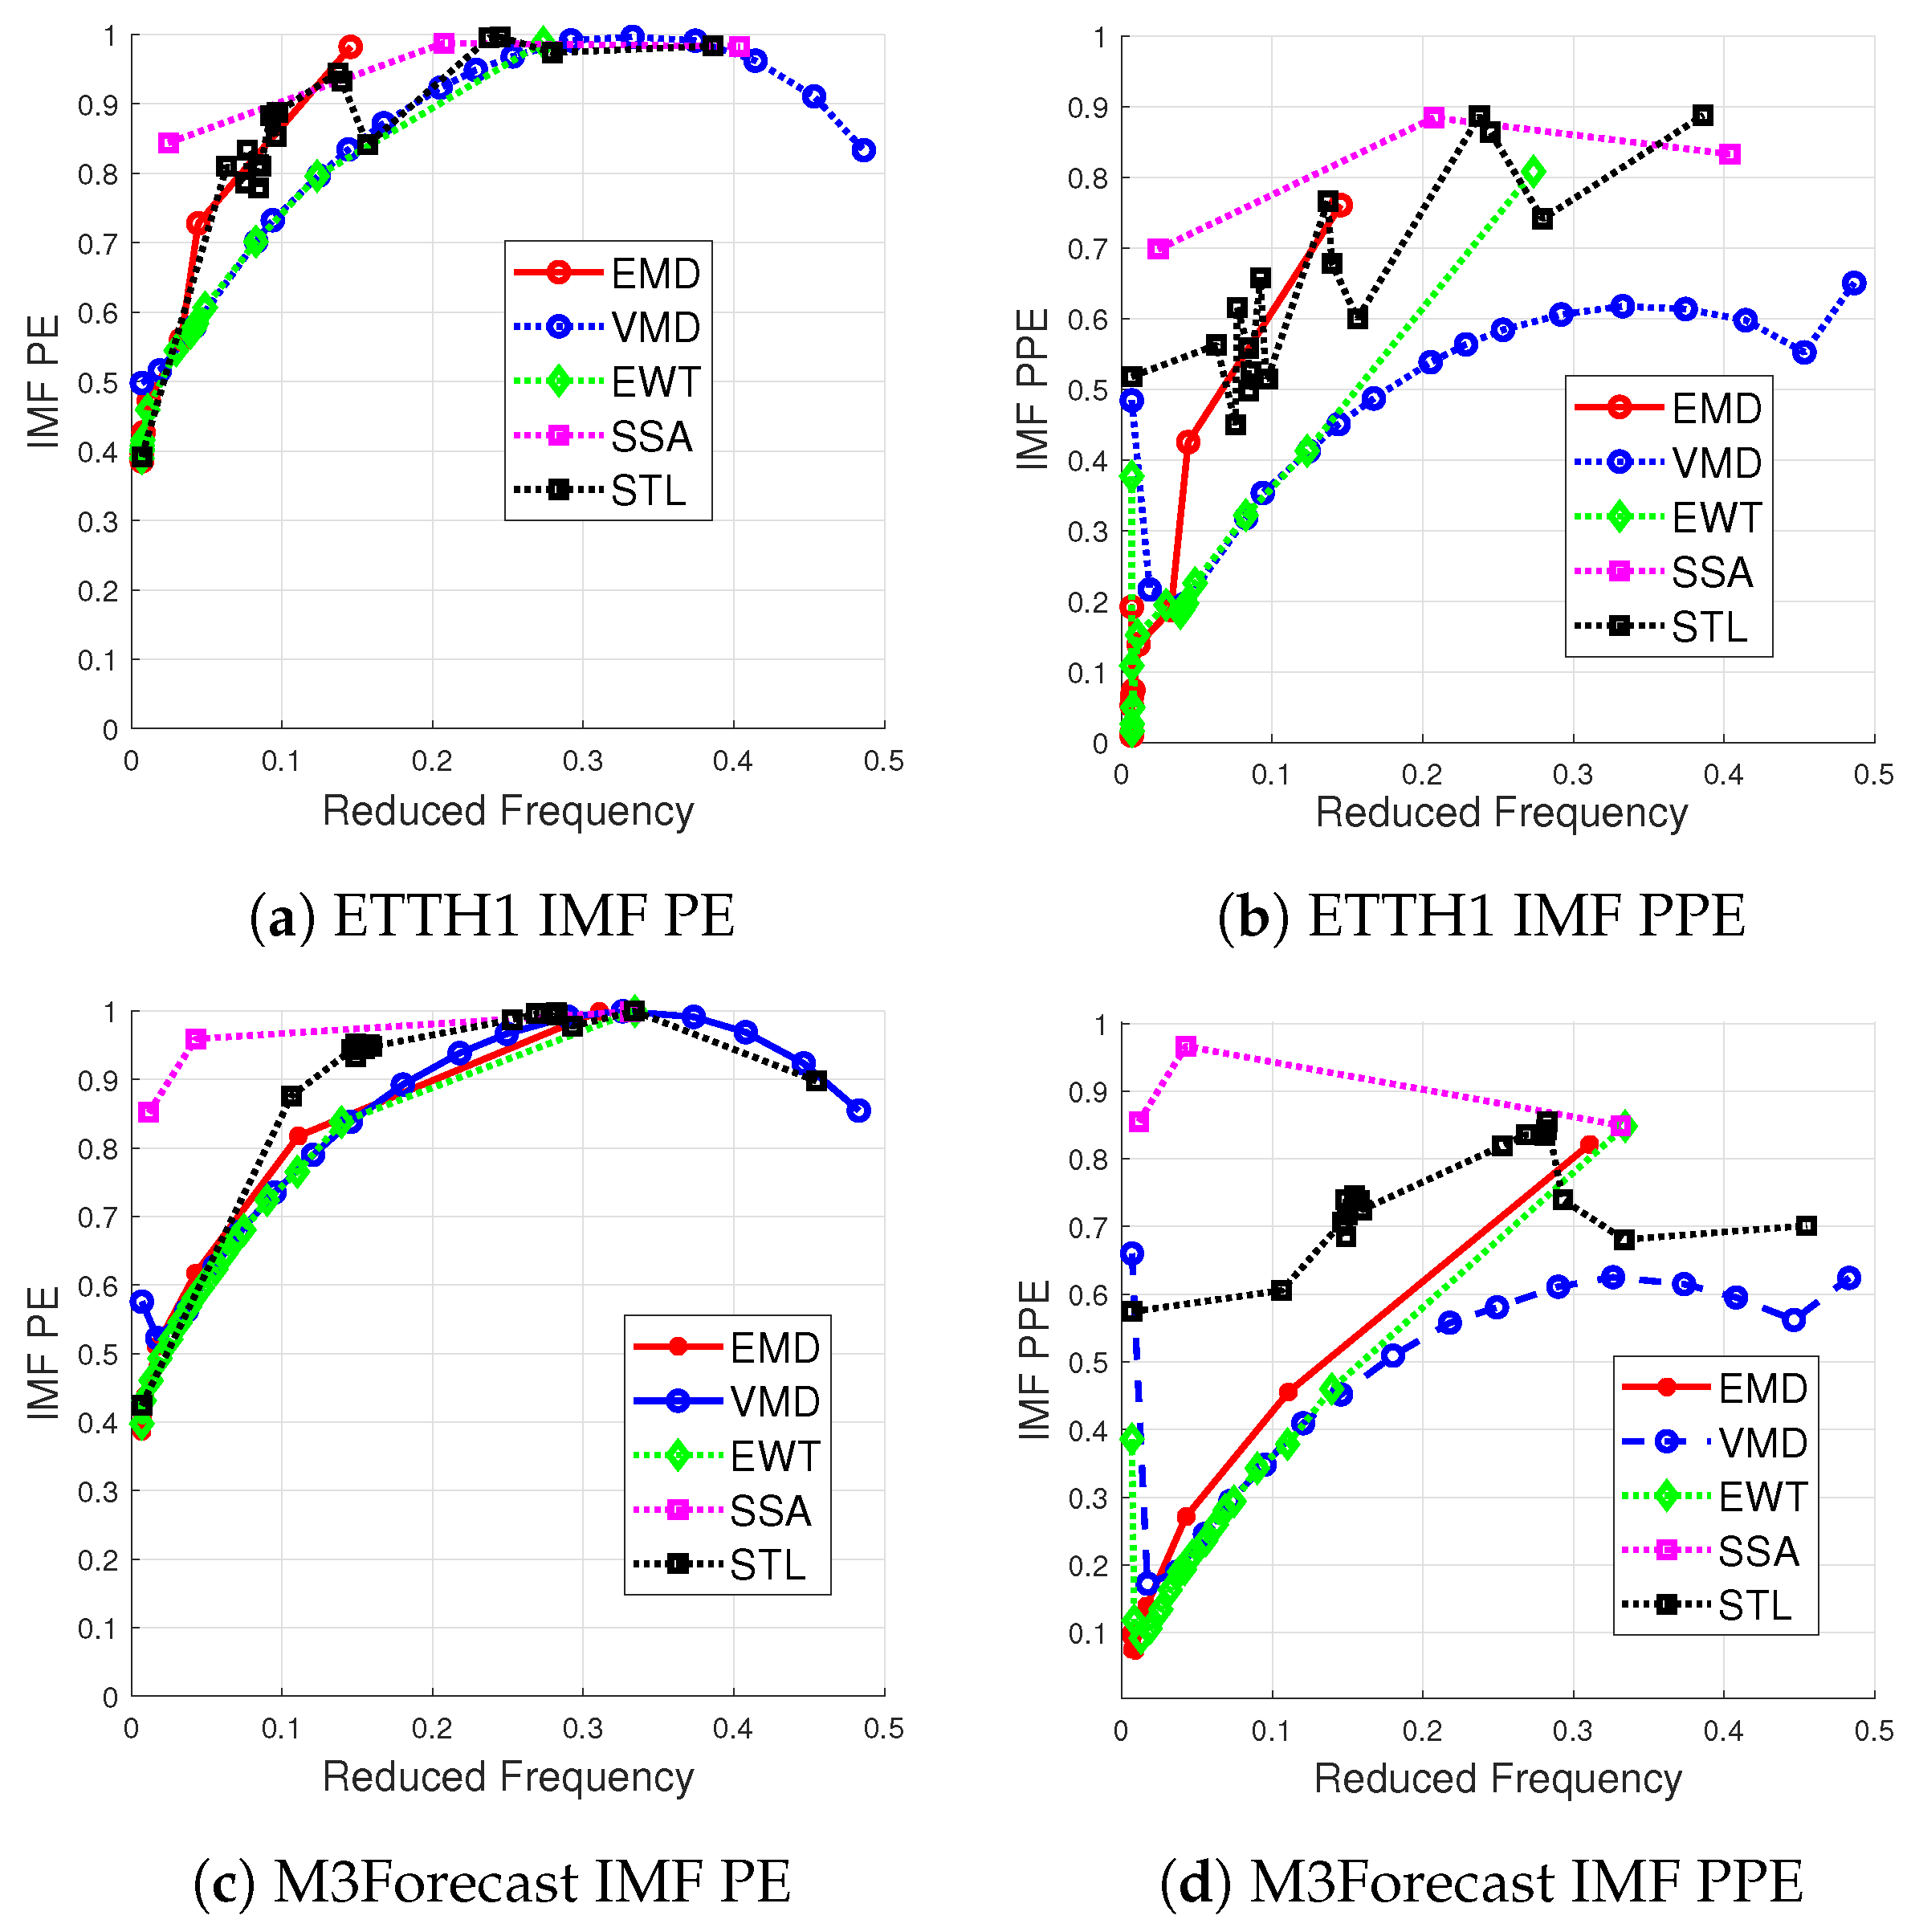
3.2. Real Data
4. Conclusions
Author Contributions
Funding
Institutional Review Board Statement
Informed Consent Statement
Data Availability Statement
Conflicts of Interest
References
- Bandt, C.; Pompe, B. Permutation Entropy: A Natural Complexity Measure for Time Series. Phys. Rev. Lett. 2002, 88, 174102. [Google Scholar] [CrossRef]
- Kang, H.; Zhang, X.; Zhang, G. Phase permutation entropy: A complexity measure for nonlinear time series incorporating phase information. Phys. Stat. Mech. Its Appl. 2021, 568, 125686. [Google Scholar] [CrossRef]
- Jabloun, M.; Ravier, P.; Buttelli, O. On the Genuine Relevance of the Data-Driven Signal Decomposition-Based Multiscale Permutation Entropy. Entropy 2022, 24, 1343. [Google Scholar] [CrossRef] [PubMed]
- Zhang, J.; Feng, F.; Marti-Puig, P.; Caiafa, C.F.; Sun, Z.; Duan, F.; Solé-Casals, J. Serial-EMD: Fast empirical mode decomposition method for multi-dimensional signals based on serialization. Inf. Sci. 2021, 581, 215–232. [Google Scholar] [CrossRef]
- Lu, Y.; Ma, H.; Zhang, Z.; Jiang, L.; Sun, Y.; Song, Q.; Liu, Z. Real-time chatter detection based on fast recursive variational mode decomposition. Int. J. Adv. Manuf. Technol. 2023, 130, 3275–3289. [Google Scholar] [CrossRef]
- Fan, G.F.; Peng, L.L.; Hong, W.C. Short-term load forecasting based on empirical wavelet transform and random forest. Electr. Eng. 2022, 104, 4433–4449. [Google Scholar] [CrossRef]
- Ouyang, Z.; Ravier, P.; Jabloun, M. STL Decomposition of Time Series Can Benefit Forecasting Done by Statistical Methods but Not by Machine Learning Ones. Eng. Proc. 2021, 5, 42. [Google Scholar] [CrossRef]
- Harmouche, J.; Fourer, D.; Auger, F.; Borgnat, P.; Flandrin, P. The Sliding Singular Spectrum Analysis: A Data-Driven Non-Stationary Signal Decomposition Tool. IEEE Trans. Signal Process. 2017, 66, 251–263. [Google Scholar] [CrossRef]
- Paley, R.E.A.C.; Zygmund, A. On some series of functions, (3). Math. Proc. Camb. Philos. Soc. 1932, 28, 190–205. [Google Scholar] [CrossRef]
- Kahane, J. Some Random Series of Functions; Cambridge Studies in Advanced Mathematics; Cambridge University Press: Cambridge, UK, 1985. [Google Scholar]
Disclaimer/Publisher’s Note: The statements, opinions and data contained in all publications are solely those of the individual author(s) and contributor(s) and not of MDPI and/or the editor(s). MDPI and/or the editor(s) disclaim responsibility for any injury to people or property resulting from any ideas, methods, instructions or products referred to in the content. |
© 2024 by the authors. Licensee MDPI, Basel, Switzerland. This article is an open access article distributed under the terms and conditions of the Creative Commons Attribution (CC BY) license (https://creativecommons.org/licenses/by/4.0/).
Share and Cite
Pierron, E.; Jabloun, M. Assessing the Preprocessing Benefits of Data-Driven Decomposition Methods for Phase Permutation Entropy—Application to Econometric Time Series. Eng. Proc. 2024, 68, 28. https://doi.org/10.3390/engproc2024068028
Pierron E, Jabloun M. Assessing the Preprocessing Benefits of Data-Driven Decomposition Methods for Phase Permutation Entropy—Application to Econometric Time Series. Engineering Proceedings. 2024; 68(1):28. https://doi.org/10.3390/engproc2024068028
Chicago/Turabian StylePierron, Erwan, and Meryem Jabloun. 2024. "Assessing the Preprocessing Benefits of Data-Driven Decomposition Methods for Phase Permutation Entropy—Application to Econometric Time Series" Engineering Proceedings 68, no. 1: 28. https://doi.org/10.3390/engproc2024068028
APA StylePierron, E., & Jabloun, M. (2024). Assessing the Preprocessing Benefits of Data-Driven Decomposition Methods for Phase Permutation Entropy—Application to Econometric Time Series. Engineering Proceedings, 68(1), 28. https://doi.org/10.3390/engproc2024068028