Abstract
The Real Decreto-ley 13/2022 has amended the framework governing the calculation of Social Security contributions for Spanish self-employed workers. This framework obligates taxpayers to the annual revenue projection, under the possibility of lending money for free or paying unexpected taxes at the end of the year in the case of deviations. To address this issue, the Declarando firm has developed an algorithm to recommend the optimal contributions that combines a Simple Moving Average forecasting method with an offset-adjustment technique. This paper examines how this strategy can be improved by cleaning the input data and combining different forecasts using an Ensemble-based approach. After testing experimentally various alternatives, a promising strategy involves employing a median-based Ensemble on preprocessed data. Although this Ensemble-based approach significantly reduces forecasting errors, the improvements are diluted when the predictions are combined with the offset-adjustment process.
1. Introduction
In Spain, a self-employed worker is defined as an individual who regularly engages in economic or professional pursuits for profit, independently and without the supervision of another individual [1]. The regulation of self-employment is governed by the Statute of the Independent Trader, which outlines their rights and obligations. One of their main duties is the payment of monthly Social Security contributions, a tax that must be remitted to the Spanish Treasury Agency (TGSS, an acronym for Tesorería General de la Seguridad Social). Recently, the framework used to define these contributions has transitioned from a system where each self-employee could define it freely to one based on an estimation of the full-year revenue [2].
The framework, outlined in the Real Decreto-ley 13/2022, uses a three-step process to define the contributions. Initially, a self-employee must compute their full-year revenue, defined as the difference between income and expenses. Subsequently, this estimation is divided by 12 to derive the average monthly revenue and then compared to a reference table to establish the contribution amount. This reference table, depicted in [2], divides the full range of revenues into 15 sub-ranges, which are used to determine the tax amount, which must be informed to the TGSS. In the event of estimation errors or deviations from revenue expectations, the Spanish government has established two methods to rectify or update them. First, in the case of detecting significant deviations between a previous estimation and the new revenue expectation before finishing the fiscal year, the self-employed worker must notify telematically of this new expectation, together with the amount of the future contributions, which must be adjusted to compensate the prior deviations. In case of changes in contributions, these become effective in the odd months of the year (January, March, …, November). Once the year ends, the deviation between the paid taxes and those that should be paid according to the real revenue is calculated. The difference between both amounts is reimbursed in the case of having paid more taxes than corresponding or required by the TGSS in the case of underpaid taxes. Finally, if the TGSS is not informed about the revenue expectations for the year, the revenue from the previous exercise is utilized as a reference to establish contributions.
A practical consequence of the method mentioned before is the requirement to foresee future revenue and to recompute the contributions periodically to adjust them. To assist self-employed individuals in this process, the Spanish firm Declarando has devised a methodology that utilizes a univariate Simple Moving Average (SMA) to forecast the entire-year revenue. Subsequently, future contributions are defined according to this prediction, as well as previously paid ones. A series of simulations have empirically shown that this method significantly outperforms the TGSS baseline while offering a good performance compared to other methods such as ARIMA, Exponential Smooth (ETS), or Deep Forest [3].
The authors used the SMA method because it is a conservative algorithm that performs well on short and noisy datasets. Other more complex approaches that require more training data were discarded as the literature indicates that their results are not competitive when trained over time series with fewer observations [4,5,6]. Instead of using complex algorithms, combining several predictions using Ensemble-based methods can lead to promising results [7], requiring, in addition, a reduced computational burden [8].
Moreover, the prototype proposed by Palomero et al. utilized raw revenue data to execute the predictions, therefore enabling the investigation of whether the preprocessing techniques could enhance the proposed method [3]. The beneficial impact of employing these techniques has also been empirically observed. For instance, Makridakis et al. described a light but consistent improvement when applying the Box-Cox transformation at univariate time series [4]. Other possible transformations that could be tested comprise the outlier detection and time series scaling [9].
This paper extends the research conducted by Palomero et al. by examining the impact of implementing preprocessing techniques and developing an Ensemble-based forecasting algorithm utilizing the most promising methods identified empirically. The remainder of this paper is organized as follows. Section 2 elucidates the experimental data and provides a comprehensive overview of the pipeline of the suggestion model presented in [3], and describes the experimental setup, whose results are described in Section 3. The paper concludes with a discussion in Section 4.
2. Materials and Methods
Declarando has provided the information used in this paper, which refers to the monthly revenue of 392 self-employed workers between 2021 and 2022. Monthly revenue is defined as the income minus the expenses declared to the Spanish Treasury Agency, excluding the expenses related to the proper contributions. Table 1 displays the fundamental descriptive statistics for both year’s revenue records. Several ideas can be extracted from these values: The first one is the skewness of the distribution, as the mean values are, in both cases, approximately EUR 10,000 greater than the median. Furthermore, the first quartiles are far below Spain’s unprofessional minimum wage in both years, which is defined as EUR 14,000. Ultimately, the augmentation of wages observed in 2022 compared to the previous year can be attributed to the relaxation of restrictions imposed by the COVID-19 pandemic, which resulted in the reactivation of the Spanish economy.

Table 1.
Summary of self-employed people revenues in 2021 and 2022.
The revenue as mentioned above has been employed to evaluate the effects of the improvements to the reference method proposed in [3], which involves a seven-step procedure applicable at any point in the year as follows:
- Extract the monthly known revenue, defined as the difference between income and expenditures, excluding already paid contributions.
- Determine the future revenue until the end of the year using an SMA forecasting algorithm.
- In the event of generating positive revenue, a 7% is deducted in the concept of expenditures that are challenging to justify [10].
- Calculate monthly revenue by dividing the annual revenue by 12.
- Infer the monthly tax by comparing the monthly revenue specified in the reference table [2] to extract the contribution basis (base de cotización in Spanish) and multiply it by 31.2%, reflecting the general tax ratio for self-employed workers in 2023 [10].
- Adjust monthly tax by adding or subtracting the difference between the already paid contribution and the one that should have been made in accordance with the new estimate. This difference is then prorated between the months pending until the end of the year.
- If necessary, Winsorize the proposed contribution within the Real Decreto-ley 13/2022 limits.
The evaluation study performed by Palomero et al. was based on the possibility of changing the quota once every two months. Therefore, the simulation consisted of paying the contributions six times during 2022, with the past revenue from 2021 until the moment of each new suggestion as the training data. In that simulation, the main error measure was the final offset between the contributions paid according to the suggestions and those to be paid according to the real revenue. The experiments demonstrated a significant improvement over the method used by the TGSS, which used the previous year’s revenue as a criterion to compute monthly contributions [3].
Methodology Used to Improve the Strategy
In Palomero et al., various versions of the proposed method based on different forecasting procedures, outlined in Table 2, were compared. There, the ETS, DF, and ARIMA performed similarly to SMA and significantly better than Regression and Prophet [3]. More complex models, especially those based on non-parametric Machine and Deep Learning, were excluded as they usually require a volume of available data, which is not easily available under this context [4,5,6].
Table 2.
Implementations of the methods tested as forecasting engine.
Despite discarding models based on large training datasets, there is room for improvement through exploring the potential benefits of the data preprocessing techniques [9] plus the Ensemble-based forecasting [7,8]. The main experimental body of this study analyzes the beneficial effects of the outlier-detection methods, data scaling processes, and ensembling strategies. These experiments were executed using the most promising algorithms identified: ARIMA, DF, ETS, and SMA, parameterized using the default configurations.
The first experiment involved comparing the impact of applying three outlier-detection and replacing methods: TS-Outliers from the forecast package [15], cubic splines from the splines [16] and a Hampel filter, available in the at pracma package [17]. In this case, the scores are compared to the results of running the simulations without applying any preprocessing method on each algorithm and during the six timestamps. Subsequently, the effects of Box-Cox and Log10 data-transformation techniques were assessed. As the revenue data can be positive or negative and both Box-Cox requires using positive data, the revenue has been transformed into positive by adding the absolute value of the minimal observation for each time series to all observations plus one. Subsequently, the value at each Box-Cox transformation was inferred empirically by maximizing the Log-likelihood using the Box-Cox method from the MASS package. These two scaling processes were also eventually adjusted to fall within the range [0–1] through the min-max scaling [9], generating four different comparisons. Both experiments were considered independent and executed over the same training subset, formed by approximately 80% () of the original dataset, while the remaining 20% () were used for testing purposes.
These first experiments aim to identify the most promising preprocessing techniques, which will be incorporated in the Ensemble experiment, where the forecasts of ARIMA, DF, ETS, and SMA are combined using the average and median values as ensembling methods. In this case, the best method is selected and integrated into a variation of the reference suggestion system. The results of this modified approach are compared with those presented by Palomero et al. over the entire cohort.
3. Results
This section outlines the outcomes of the experiments carried out. In the first block, the results of the assessments of the effects of the different preprocessing techniques are reported. Next, the most promising techniques are included in a forecasting pipeline based on ensembling ARIMA, DF, ETS, and SMA, whose results are discussed in the second subsection. Finally, the overall effect of using this novel forecasting proposal integrated within the proposed suggestion method is analyzed.
3.1. Assessing the Outlier-Detection Techniques over the Forecasting Error
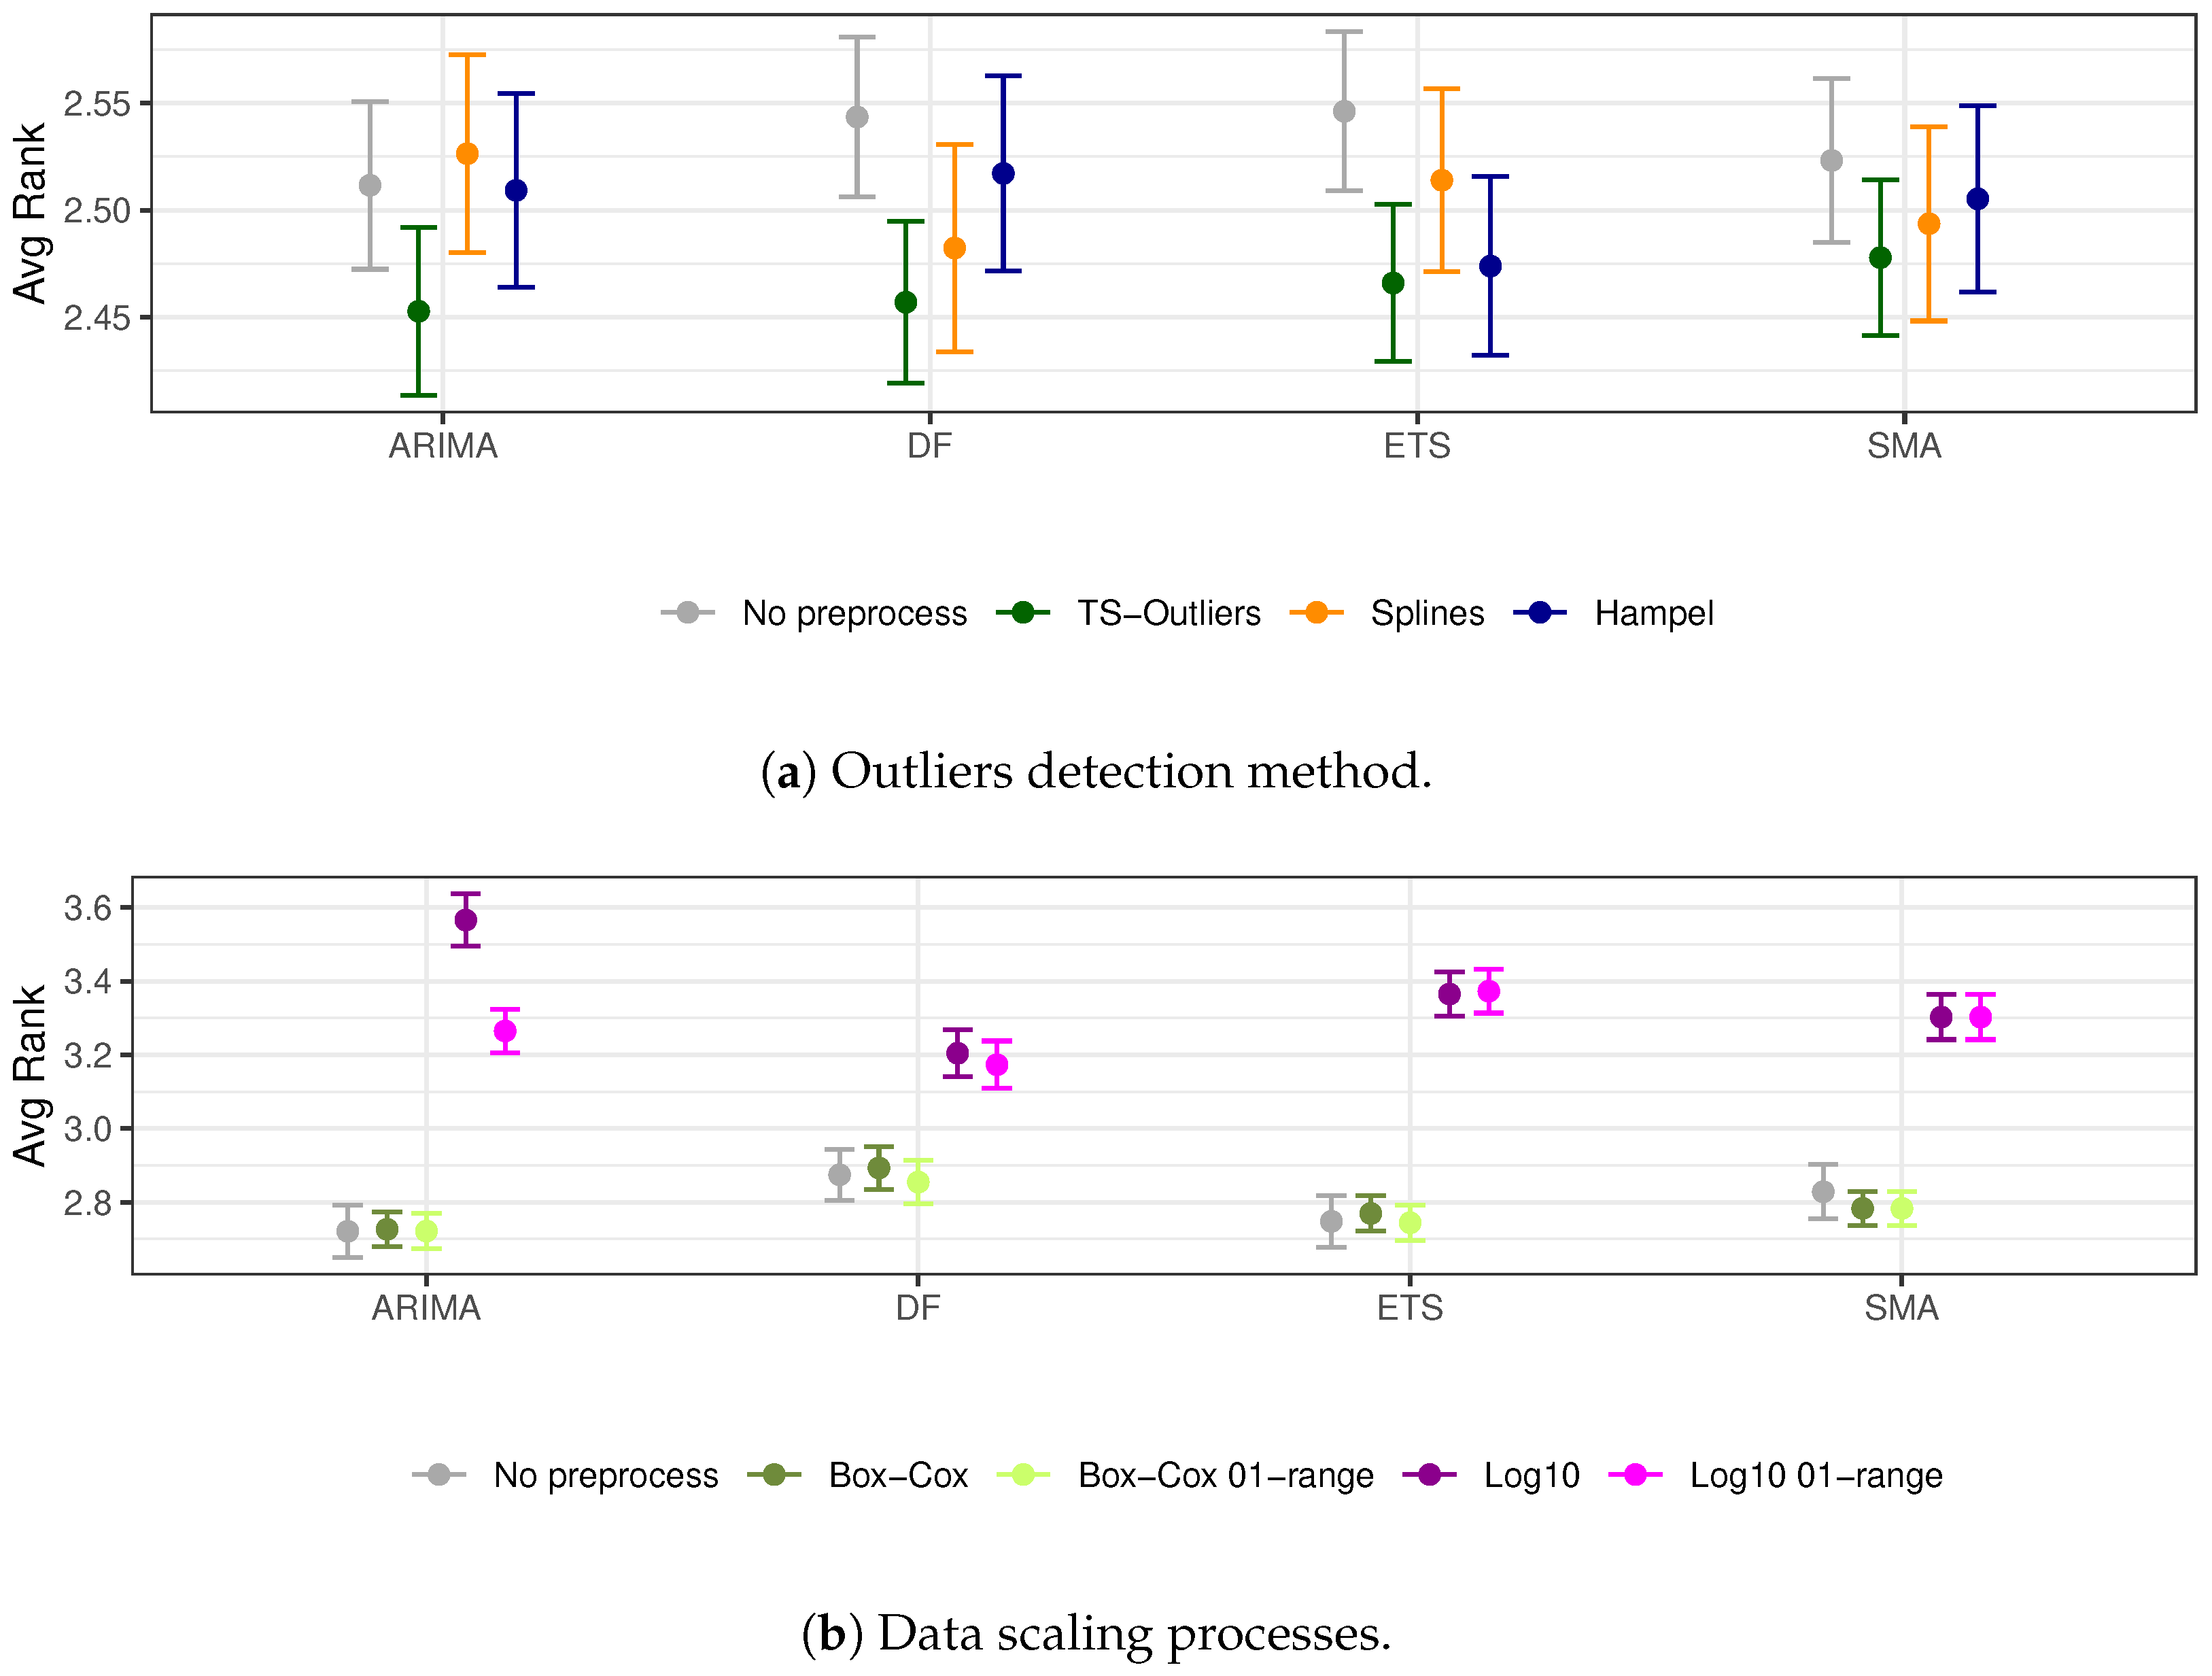
Figure 1 summarizes the average ranks, with its 95% confidence interval (CI), of the preprocessing effects over ARIMA, DF, ETS, and SMA. In particular, Figure 1a focuses on the outcomes of outlier-detection techniques, whereas Figure 1b outlines the effects of data scaling procedures. In the case of outlier-detection techniques, it stands out that the average rank from the TS-Outliers, depicted in green in Figure 1a, is the lowest, which represents the better result. These differences are even statistically significant with the no preprocess benchmark at the DF and the ETS, as their CI do not overlap. The other two methods tested, the Splines—orange—and Hampel—blue—show a more irregular behavior. These results suggest that the utilization of the TS-Outliers process, which is based on using the interquartile range of the reminder subcomponent of the decomposed time series [18], is more robust than the other two methods.
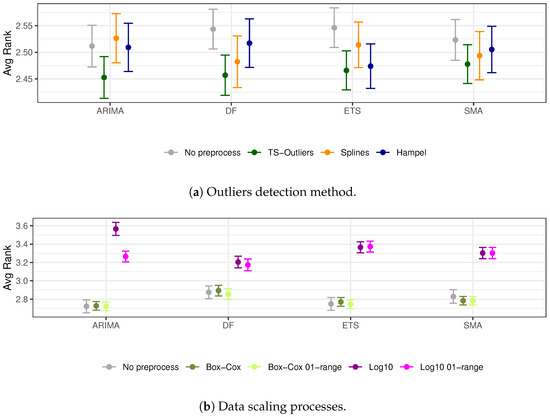
Figure 1.
Averaged ranked values of the preprocessing methods evaluated on the training subset.
The results obtained by comparing the data scaling procedures with the results, as depicted in Figure 1b, suggest that neither a Box-Cox nor a logarithmic transformation can significantly enhance the outcomes of utilizing raw data, regardless of whether or not a range-based transformation is employed. A variety of factors may contribute to these outcomes. The suboptimal outcomes of the Log10-transformation can be attributed to the distorting effect on the data variance, wherein the changes in values located near the zero value are over-represented rather than the larger ones. In the case of the Box-Cox, despite the necessity for a more comprehensive examination, the brief duration of the time series and its chaotic nature may reduce the impact of this transformation. Ultimately, the effect of the range scaling is negligible. This is an expected effect, as this transformation mainly applies to machine learning models instead of parametric approaches like the ones reviewed. The deep learning DF method has also been effective in processing raw data without requiring any extra tuning process [14].
To summarize, the comprehensive data presented in Figure 1 suggests that the TS-Outliers algorithm can reduce the error at all four methods, with the DF and ETS exhibiting statistically significant reductions. Therefore, only this method is included in the following pipelines.
3.2. Defining an Ensemble Model
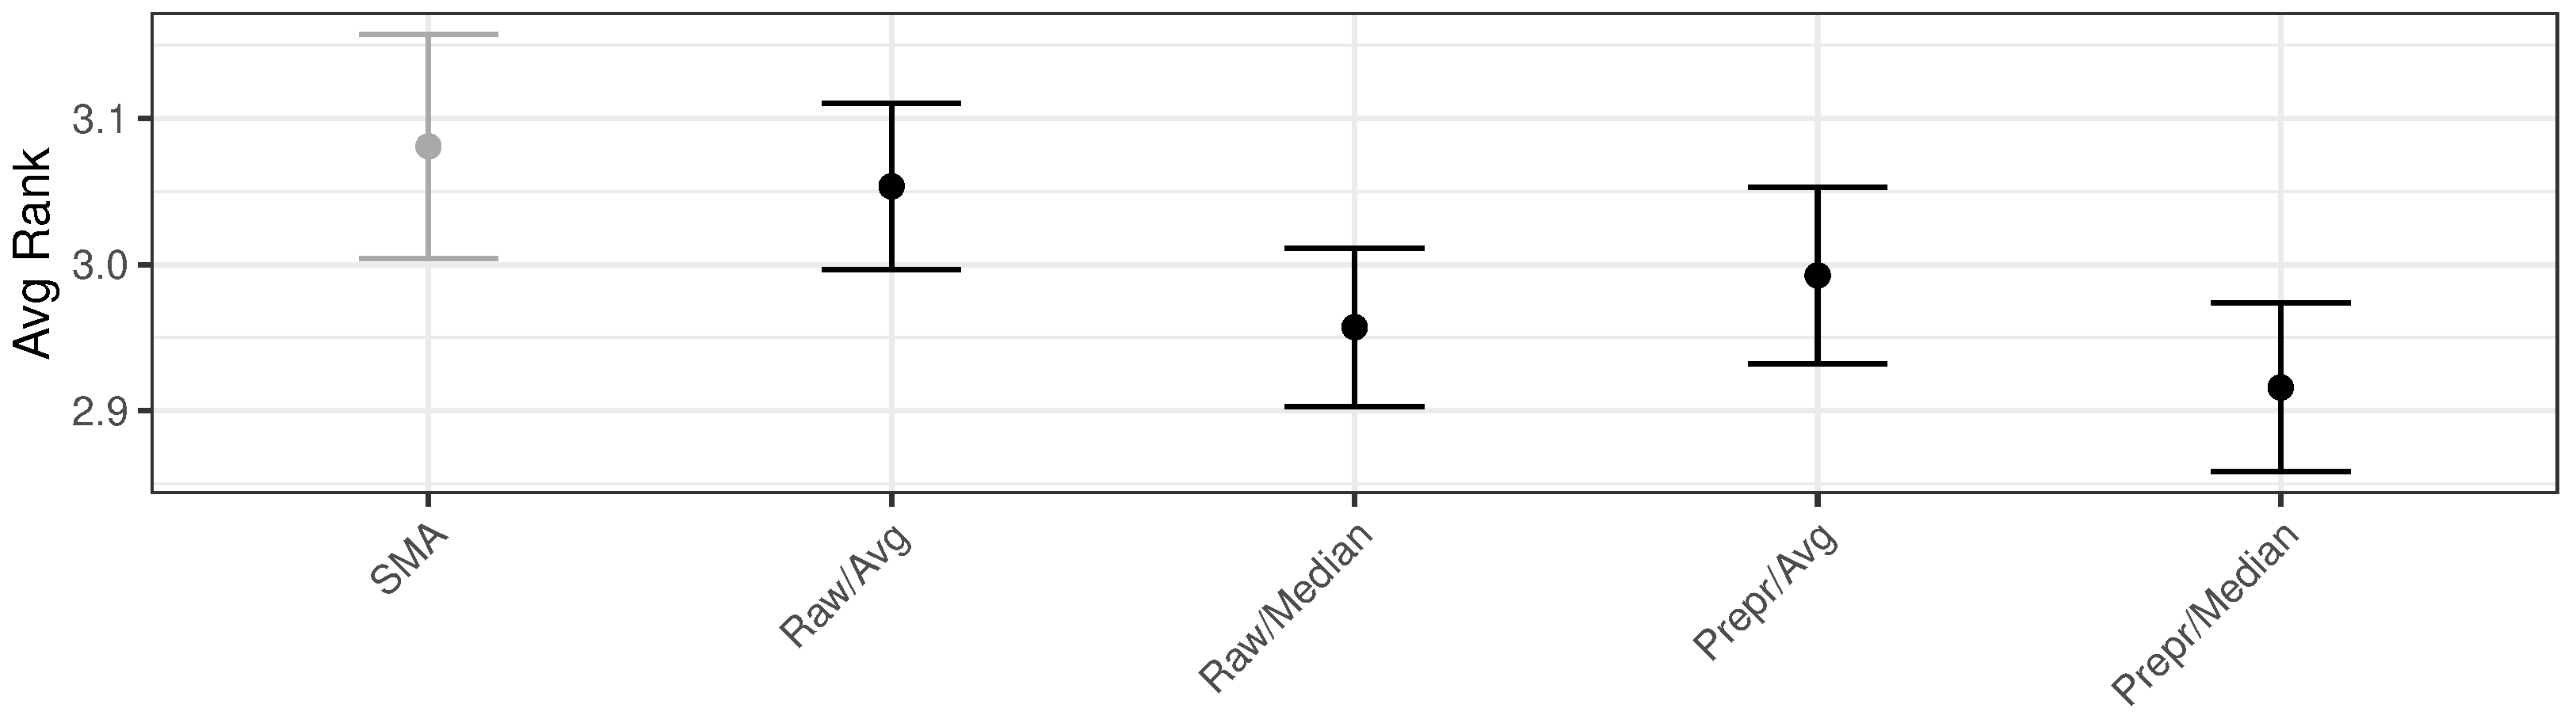
Following the previous section, several method variations were tested on a model that combines the four method’s forecasts. In this particular instance, the outcomes of approaches based on constructing an Ensemble method that uses the average and median as ensembling criteria over predictions using raw and preprocessed data were evaluated. Figure 2 depicts the results of comparing the average rank scores obtained, including their CI, with the results of SMA-based inferred from the raw data as the reference. It can be observed that the ranks of the two median-based ensembles are better than their counterparts based on the average criterion. In addition, using preprocessed data might reduce errors independently of the combination strategy employed.

Figure 2.
Average ranked values of the four variations and the SMA results used as baseline.
The result from the Preprocessed/Median version exhibits the lowest rank, being unique in that CI does not overlap the reference. The Raw/Median approach is considered the second-best option, exhibiting a similar rank to the Preprocessed/Median. Exploring the differences between both approaches, we performed a hypothesis test based on a pairwise Wilcoxon test of the original forecasts mean absolute error (MAE). With a p-value of 0.013, we can conclude that there is sufficient statistical evidence to reject the null hypothesis using the direct simulation’s MAE scores. Considering these results, we have selected the Preprocessed/Median version, denoted directly as the Ensemble method, as the method used in the following experiments.
After identifying the Ensemble method as the most promising using the training dataset, the following experiment consisted of comparing their results with the other methods provided by [3] over the testing set. The two sub-figures in Figure 3 depict an overall comparison without considering the simulation periods (Figure 3a) and taking into account them separately (Figure 3b). Table 3 details the average scores described in the figure, annotating with a star character (*) the cases where the CI does not overlap the Ensemble or, in other words, where it can be deemed that the Ensemble score is better.
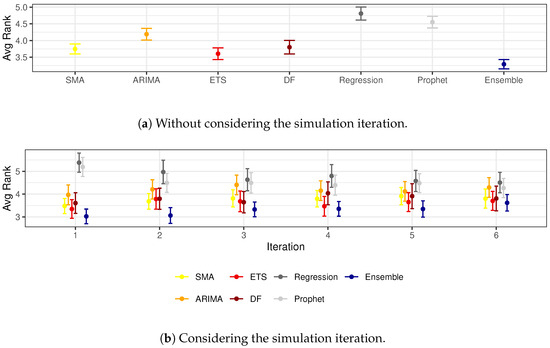
Figure 3.
Averaged ranked values of the preprocessing methods compared on the training subset.
Table 3.
Average rank of the methods compared in the test set over all the simulations and the different stages.
In the overall comparison depicted in Figure 3a, the best model is the Ensemble, which has an average score of 3.29, followed by ETS, SMA, DF, ARIMA, Prophet, and Regression. The figure also shows that this difference can be considered significant, as its CI ([3.151, 3.429]) does not overlap with anyone, being the closest the one from ETS ([3.432, 3.781]). Therefore, we can conclude that the Ensemble method significantly overcomes all the variations presented by Palomero et al., at least when considering all prediction intervals together.
While the global results indicate that the Ensemble method outperforms the others, when considering the simulation periods separately, these differences are diluted across the year advances, as depicted in Figure 3b and detailed in Table 3. The Ensemble shows the best results in all cases, especially compared with Regression, Prophet, and ARIMA, at the sixth, fifth, and fourth initial stages, respectively. These results suggest that the beneficial effect of using the Ensemble method is more evident in the early stages of the year when the forecasting horizon is longer.
3.3. Measuring the Effect of Using an Ensemble Method over the Entire Suggestion Algorithm
The above tests indicate that the Ensemble method can improve the results retrieved using a unique method over raw data. Despite the significant impact of this enhancement, it is imperative to evaluate its impact throughout the entire suggestion procedure presented in [3]. Table 4 depicts the mean absolute error (MAE) between the taxes suggested by the Ensemble method and two baselines, the TGSS and the SMA. In this particular instance, the outcomes were obtained by combining the training and testing datasets (n = 392).
Table 4.
Summary of MAE for Full Forecasts.
In this instance, the Ensemble outcomes exhibit a significant improvement of an MAE of 256.2 euros compared to the TGSS. On the contrary, compared to SMA, the enhancement is reduced to 6.8 euros, which is not significant given the overlap between the CI. Despite the similarities between the SMA and Ensemble MAE scores, a pairwise Wilcoxon test returns a p-value of 0.033, indicating that this slight improvement can be statistically significant. The apparent difference between the CI and Wilcoxon test results is explained by the fact that the obtained MAE scores do not follow a normal distribution, as we can conclude after executing a Shapiro-Wilk test, which yields a p-value score .
The examination of the number of cases that were accurately predicted reveals that in 57.65% of the cases (), the Ensemble method suggested the most equitable taxes, while the SMA suggested correct suggestion ratio was 55.10% (). In this case, the ratio of overpaid and underpaid cases remains similar (p-value = 0.70), so we can conclude that both methods show a similar distribution in the overpayment and underpayment ratios.
The outcomes mentioned above show a discrete improvement of the Ensemble-based version, whereas, at the forecasting stage, these enhancements were much more significant. Although it should be more widely explored, one reason could be the effect of the adjustment process included, which contributes to smoothing the previous forecasting errors by adjusting the future contributions.
4. Discussion
This paper examines the effect of the application of several techniques to improve a procedure that suggests the optimal monthly contributions that Spanish self-employed workers should pay according to an estimation of the full-year revenue. The reference procedure combines a forecasting engine based on the SMA algorithm with an offset-adjustment procedure based on the previous payments. Some common improvements include preprocessing the data and combining different predictions [9]. Other more complex choices were discarded, as they required complex training processes without offering significant improvements on small training data sets [6].
The experimental results presented in this work describe the first improvement in forecasting accuracy when applying the outliers preprocessing techniques. Since the ARIMA, DF, ETS, and SMA methods showed similar results in the reference study, we have studied the effects of combining their forecasts in an Ensemble-based method.
A review of the obtained data highlights the benefits of using the median as a combination criterion. In this context, the median operator discards the two most extreme values and averages the remaining models. This decreases the influence of models that failed in some time series [19]. The use of outlier cleaning techniques also offers improvements compared to not using them, although they remain in the background compared to the median-based Ensemble.
Although the Ensemble methodology may aid in reducing the forecasting error, it is imperative to bear in mind that the forecasting engine is merely a component of a more extensive process. In this particular instance, the potential advantages of enhancing this engine are diminished when combined with the offset-adjustment procedure.
The above results were obtained using a simulation based on real accounting information from 392 self-employed workers. Notably, these outcomes were obtained by utilizing a fixed duration of 24 months of data. Several research lines can be conducted using a wider range of training data and/or multivariate datasets, including, for example, budgeted works or holiday events. Another approach could be to examine alternative methodologies, such as the Generative AI-based methods.
Author Contributions
Conceptualization, L.P., V.G. and J.S.S.; methodology, L.P.; software, L.P.; validation, L.P.; formal analysis, L.P.; investigation, L.P.; resources V.G. and J.S.S.; data curation, L.P.; writing—original draft preparation, L.P. and V.G.; writing—review and editing, J.S.S.; visualization, J.S.S.; supervision, V.G. and J.S.S.; project administration, J.S.S. All authors have read and agreed to the published version of the manuscript.
Funding
This research received no external funding.
Institutional Review Board Statement
Not applicable.
Informed Consent Statement
Not applicable.
Data Availability Statement
Restrictions apply to the availability of these data. Data were obtained from Declarando Asesores and are available from the authors with the permission of Declarando Asesores 3.0.S.L.
Conflicts of Interest
L.P. is employed by Declarando Asesores Company. Declarando Asesores had no role in the design of the study; in the collection, analyses, or interpretation of data; in the writing of the manuscript; or in the decision to publish the results.
References
- Gobierno de España. Ley 20/2007, de 11 de Julio, del Estatuto del Trabajo Autónomo; Boletín Oficial del Estado: Madrid, Spain, 2007.
- Gobierno de España. Real Decreto-ley 13/2022, de 26 de Julio, Por el Que se Establece Un Nuevo Sistema de Cotización Para Los Trabajadores Por Cuenta Propia o Autónomos y se Mejora la Protección Por Cese de Actividad; Boletín Oficial del Estado: Madrid, Spain, 2022.
- Palomero, L.; García, V.; Traver, J.; Sánchez, J.S. Improving the Calculation of Social Security Contributions for Spanish Self-Employed Workers through an Adjusted Revenue Estimate; Zenodo: Geneva, Switzerland, 2024. [Google Scholar] [CrossRef]
- Makridakis, S.; Spiliotis, E.; Assimakopoulos, V. Statistical and machine learning forecasting methods: Concerns and ways forward. PLoS ONE 2018, 13, e0194889. [Google Scholar] [CrossRef] [PubMed]
- Cerqueira, V.; Torgo, L.; Soares, C. Machine learning vs statistical methods for time series forecasting: Size matters. arXiv 2019, arXiv:1909.13316. [Google Scholar]
- Cruz-Nájera, M.A.; Treviño-Berrones, M.G.; Ponce-Flores, M.P.; Terán-Villanueva, J.D.; Castán-Rocha, J.A.; Ibarra-Martínez, S.; Santiago, A.; Laria-Menchaca, J. Short time series forecasting: Recommended methods and techniques. Symmetry 2022, 14, 1231. [Google Scholar] [CrossRef]
- Makridakis, S.; Spiliotis, E.; Assimakopoulos, V. The M4 Competition: Results, findings, conclusion and way forward. Int. J. Forecast. 2018, 34, 802–808. [Google Scholar] [CrossRef]
- Wang, X.; Hyndman, R.J.; Li, F.; Kang, Y. Forecast combinations: An over 50-year review. Int. J. Forecast. 2023, 39, 1518–1547. [Google Scholar] [CrossRef]
- Meisenbacher, S.; Turowski, M.; Phipps, K.; Rätz, M.; Müller, D.; Hagenmeyer, V.; Mikut, R. Review of automated time series forecasting pipelines. WIREs Data Min. Knowl. Discov. 2022, 12, e1475. [Google Scholar] [CrossRef]
- Gobierno de España. Ley 31/2022, de 23 de Diciembre, de Presupuestos Generales del Estado Para el año 2023; Boletín Oficial del Estado: Madrid, Spain, 2022.
- Svetunkov, I. Smooth: Forecasting Using State Space Models. R Package Version 4.0.0. 2023. Available online: https://CRAN.R-project.org/package=smooth (accessed on 27 June 2024).
- O’Hara-Wild, M.; Hyndman, R.; Wang, E. Fable: Forecasting Models for Tidy Time Series. R Package Version 0.3.3. 2023. Available online: https://CRAN.R-project.org/package=fable (accessed on 27 June 2024).
- Taylor, S.; Letham, B. Prophet: Automatic Forecasting Procedure. R Package Version 1.0. 2021. Available online: https://CRAN.R-project.org/package=prophet (accessed on 27 June 2024).
- Zhou, Z.H.; Feng, J. Deep forest. Natl. Sci. Rev. 2018, 6, 74–86. [Google Scholar] [CrossRef] [PubMed]
- Hyndman, R.; Athanasopoulos, G.; Bergmeir, C.; Caceres, G.; Chhay, L.; O’Hara-Wild, M.; Petropoulos, F.; Razbash, S.; Wang, E.; Yasmeen, F. Forecast: Forecasting Functions for Time Series and Linear Models. R package version 8.21.1. 2023. Available online: https://pkg.robjhyndman.com/forecast/ (accessed on 27 June 2024).
- R Core Team. R: A Language and Environment for Statistical Computing; R Foundation for Statistical Computing: Vienna, Austria, 2023. [Google Scholar]
- Borchers, H.W. Pracma: Practical Numerical Math Functions. R Package Version 2.4.2. 2022. Available online: https://CRAN.R-project.org/package=pracma (accessed on 27 June 2024).
- Hyndman, R.J. Detecting Time Series Outliers. 2021. Available online: https://robjhyndman.com/hyndsight/tsoutliers/ (accessed on 20 March 2024).
- Petropoulos, F.; Svetunkov, I. A simple combination of univariate models. Int. J. Forecast. 2020, 36, 110–115. [Google Scholar] [CrossRef]

Disclaimer/Publisher’s Note: The statements, opinions and data contained in all publications are solely those of the individual author(s) and contributor(s) and not of MDPI and/or the editor(s). MDPI and/or the editor(s) disclaim responsibility for any injury to people or property resulting from any ideas, methods, instructions or products referred to in the content. |
© 2024 by the authors. Licensee MDPI, Basel, Switzerland. This article is an open access article distributed under the terms and conditions of the Creative Commons Attribution (CC BY) license (https://creativecommons.org/licenses/by/4.0/).