Proceeding Paper

Modeling the Future of Hydroelectric Power: A Cross-Country Study †

Department of Statistical Sciences, University of Padua, 35122 Padova, Italy
*
Author to whom correspondence should be addressed.
Presented at the 10th International Conference on Time Series and Forecasting, Gran Canaria, Spain, 15–17 July 2024.
These authors contributed equally to this work.
Eng. Proc. 2024, 68(1), 56; https://doi.org/10.3390/engproc2024068056
Published: 19 July 2024
(This article belongs to the Proceedings of The 10th International Conference on Time Series and Forecasting)

Abstract

:
This paper examines the role of hydropower in the context of the energy transition, using innovation diffusion models. The study analyzes time series data of hydropower generation from 1965 to 2022 by applying diffusion models and some other models, such as Prophet and ARIMA, for comparison purposes. The models are evaluated across diverse geographic regions, including America, Africa, Europe, Asia, and the Middle East, to determine their effectiveness in predicting hydropower generation trends. The analysis reveals that the GGM consistently outperforms other models in accuracy across all regions. In most cases, the GGM exhibits better performance compared to the Bass, ARIMA, and Prophet models, highlighting its potential as a robust forecasting tool for hydropower generation. This study emphasizes the critical role of accurate forecasting in energy planning and calls for further research to validate these findings and explore additional factors influencing hydropower generation evolution.

1. Introduction

Fossil fuels, including coal, oil, and natural gas, currently serve as the primary sources of energy worldwide [1]. However, their use leads to the release of greenhouse gases, driving both climate change [2] and posing challenges to energy security through climate-related risks to infrastructure and resources [3]. As a result, interest in renewable energy sources has recently increased significantly worldwide [4]. Renewable energy refers to forms of energy that can renew themselves naturally, such as hydropower solar energy, wind energy, and geothermal energy. These energy sources are considered to be more sustainable and environmentally friendly than fossil fuels. The use of renewable energy sources is expected to increase significantly in the future, driven by technological advances and the fourth industrial revolution [5]. One of the oldest sustainable energy sources is hydropower, which stands out as an environmentally friendly and cost-effective alternative for energy production, and has several compelling advantages that make it extremely attractive and worthy of further exploration [6]. According to the International Energy Agency (2023), hydropower currently generates more electricity than all other renewable technologies combined, and is expected to remain the world’s largest source of renewable electricity generation into the 2030s. Therefore, it will continue to play a critical role in decarbonizing the power system and improving system flexibility. It is also acknowledged that, without major policy changes, global hydropower expansion is expected to slow down this decade. This contraction results from slowdowns in the development of projects in China, Latin America, and Europe. However, increasing growth in Asia Pacific, Africa, and the Middle East partly offset these declines. Increasingly erratic rainfall due to climate change is also disrupting hydro production in many parts of the world. To explore the potential of hydropower, data were collected on the average generation of electricity from hydropower, measured in terawatt-hours per year, from 1965 to 2022. In particular, in this paper, we provide a cross-country analysis of hydroelectric power generation in a wide set of countries, trying to predict its future evolution. In doing so, we perform an analysis based on innovation diffusion models, and compare the results in terms of predictive accuracy with some competing models, such as the ARIMA and Prophet models.
The remainder of the paper is designed as follows: Section 2 illustrates the data and methods used in the study. Analyses and discussion of the results are provided in Section 3 and, finally, the conclusion of this study is presented in Section 4.

2. Materials and Methods

In this section, we describe the data used in this study and the models implemented. We propose a synthetic description of the Bass model, GGM, and Prophet model. For comparison purposes, in the forecasting exercise proposed in Section 3, we will also consider ARIMA models, which are not described here for the sake of brevity.

2.1. Data

Data from the Energy Institute Statistical Review have been considered in this analysis covering a wide range of countries. Sparse data in North Africa contrasts with diverse initiation years for hydropower across regions, with some nations commencing as late as 2011.
The hydropower generation data for each country is shown in Figure 1 for the period 1965–2022. The figure shows that, unlike other countries, only Canada generated a lot of electricity from hydropower, while the majority had a similar level of generation. India and Norway, however, have significantly increased their electricity generation compared to other countries, while some other countries have reduced their reliance on hydropower.

2.2. Bass Model

The Bass model (BM) is used to describe the diffusion of innovations, capturing stages from introduction to decline. Initially developed within marketing science, it tracks innovation growth over time, reflecting the adoption behaviors of potential adopters influenced by external (mass media, advertising) and internal (imitation, word-of-mouth) factors. This results in two adopter categories: innovators (influenced externally) and imitators (influenced internally). A key strength of the BM is its portrayal of diffusion’s initial phase, prominently featuring the role of innovators or early adopters.
The BM is expressed through the differential equation:
z ( t ) = p + q z ( t ) m [ m z ( t ) ] , t > 0
where z ( t ) denotes cumulative adoptions at time t, m the market potential, p the innovation coefficient, and q is the imitation coefficient.

2.3. Dynamic Market Potential

Adapting the BM for dynamic market potential ( m ( t ) ), following [7], allows for capturing market fluctuations over time. The modified equation is:
z ( t ) = m ( t ) p + q z ( t ) m ( t ) 1 z ( t ) m ( t ) + m ( t ) z ( t ) m ( t ) , t > 0
where m ( t ) denotes the rate of change in market potential. This model considers how the market potential’s growth or decline impacts product adoption rates.

GGM

The Guseo and Guidolin Model (GGM) posits m ( t ) as evolving from a communication process, described by:
m ( t ) = k 1 e ( p c + q c ) t 1 + q c p c e ( p c + q c ) t
where p c , q c relate to communication and p s and q s to adoption. The GGM implies that the BM could be a special case under rapid information spread [8].

2.4. Prophet Model

The Prophet model is particularly useful for time series forecasting, where the data often exhibits various patterns, such as trend (linear or nonlinear), and seasonality and holiday effects [9]. In the current study, we used the simplest form of the Prophet model, where we ignore the variable of weekly seasonality, and holiday effects. The components of the Prophet are defined as follows:
y ( t ) = g ( t ) + s ( t ) + h ( t ) + ϵ t
In Equation (4), g ( t ) represents the logistic trend, s ( t ) accounts for the yearly seasonality, and ϵ t represents error. These components together form an additive model.

2.5. Evaluation Metrics

The performance of the models has been evaluated using four metrics. The evaluation metrics include Root Mean Squared Error (RMSE), Mean Absolute Percentage Error (MAPE), and Relative Absolute Error (RAE) [10,11].

3. Results

In the results section, we first conduct a comparison of the models to assess their effectiveness in fitting hydropower generation data. This comparison entails evaluating the performance of each model in capturing the observed patterns and trends in hydropower generation across different regions and periods. We analyze metrics such as goodness of fit, accuracy, and predictive capability to determine the model that best represents the data. The detailed results are discussed in the following subsections.

3.1. American and South African Regions

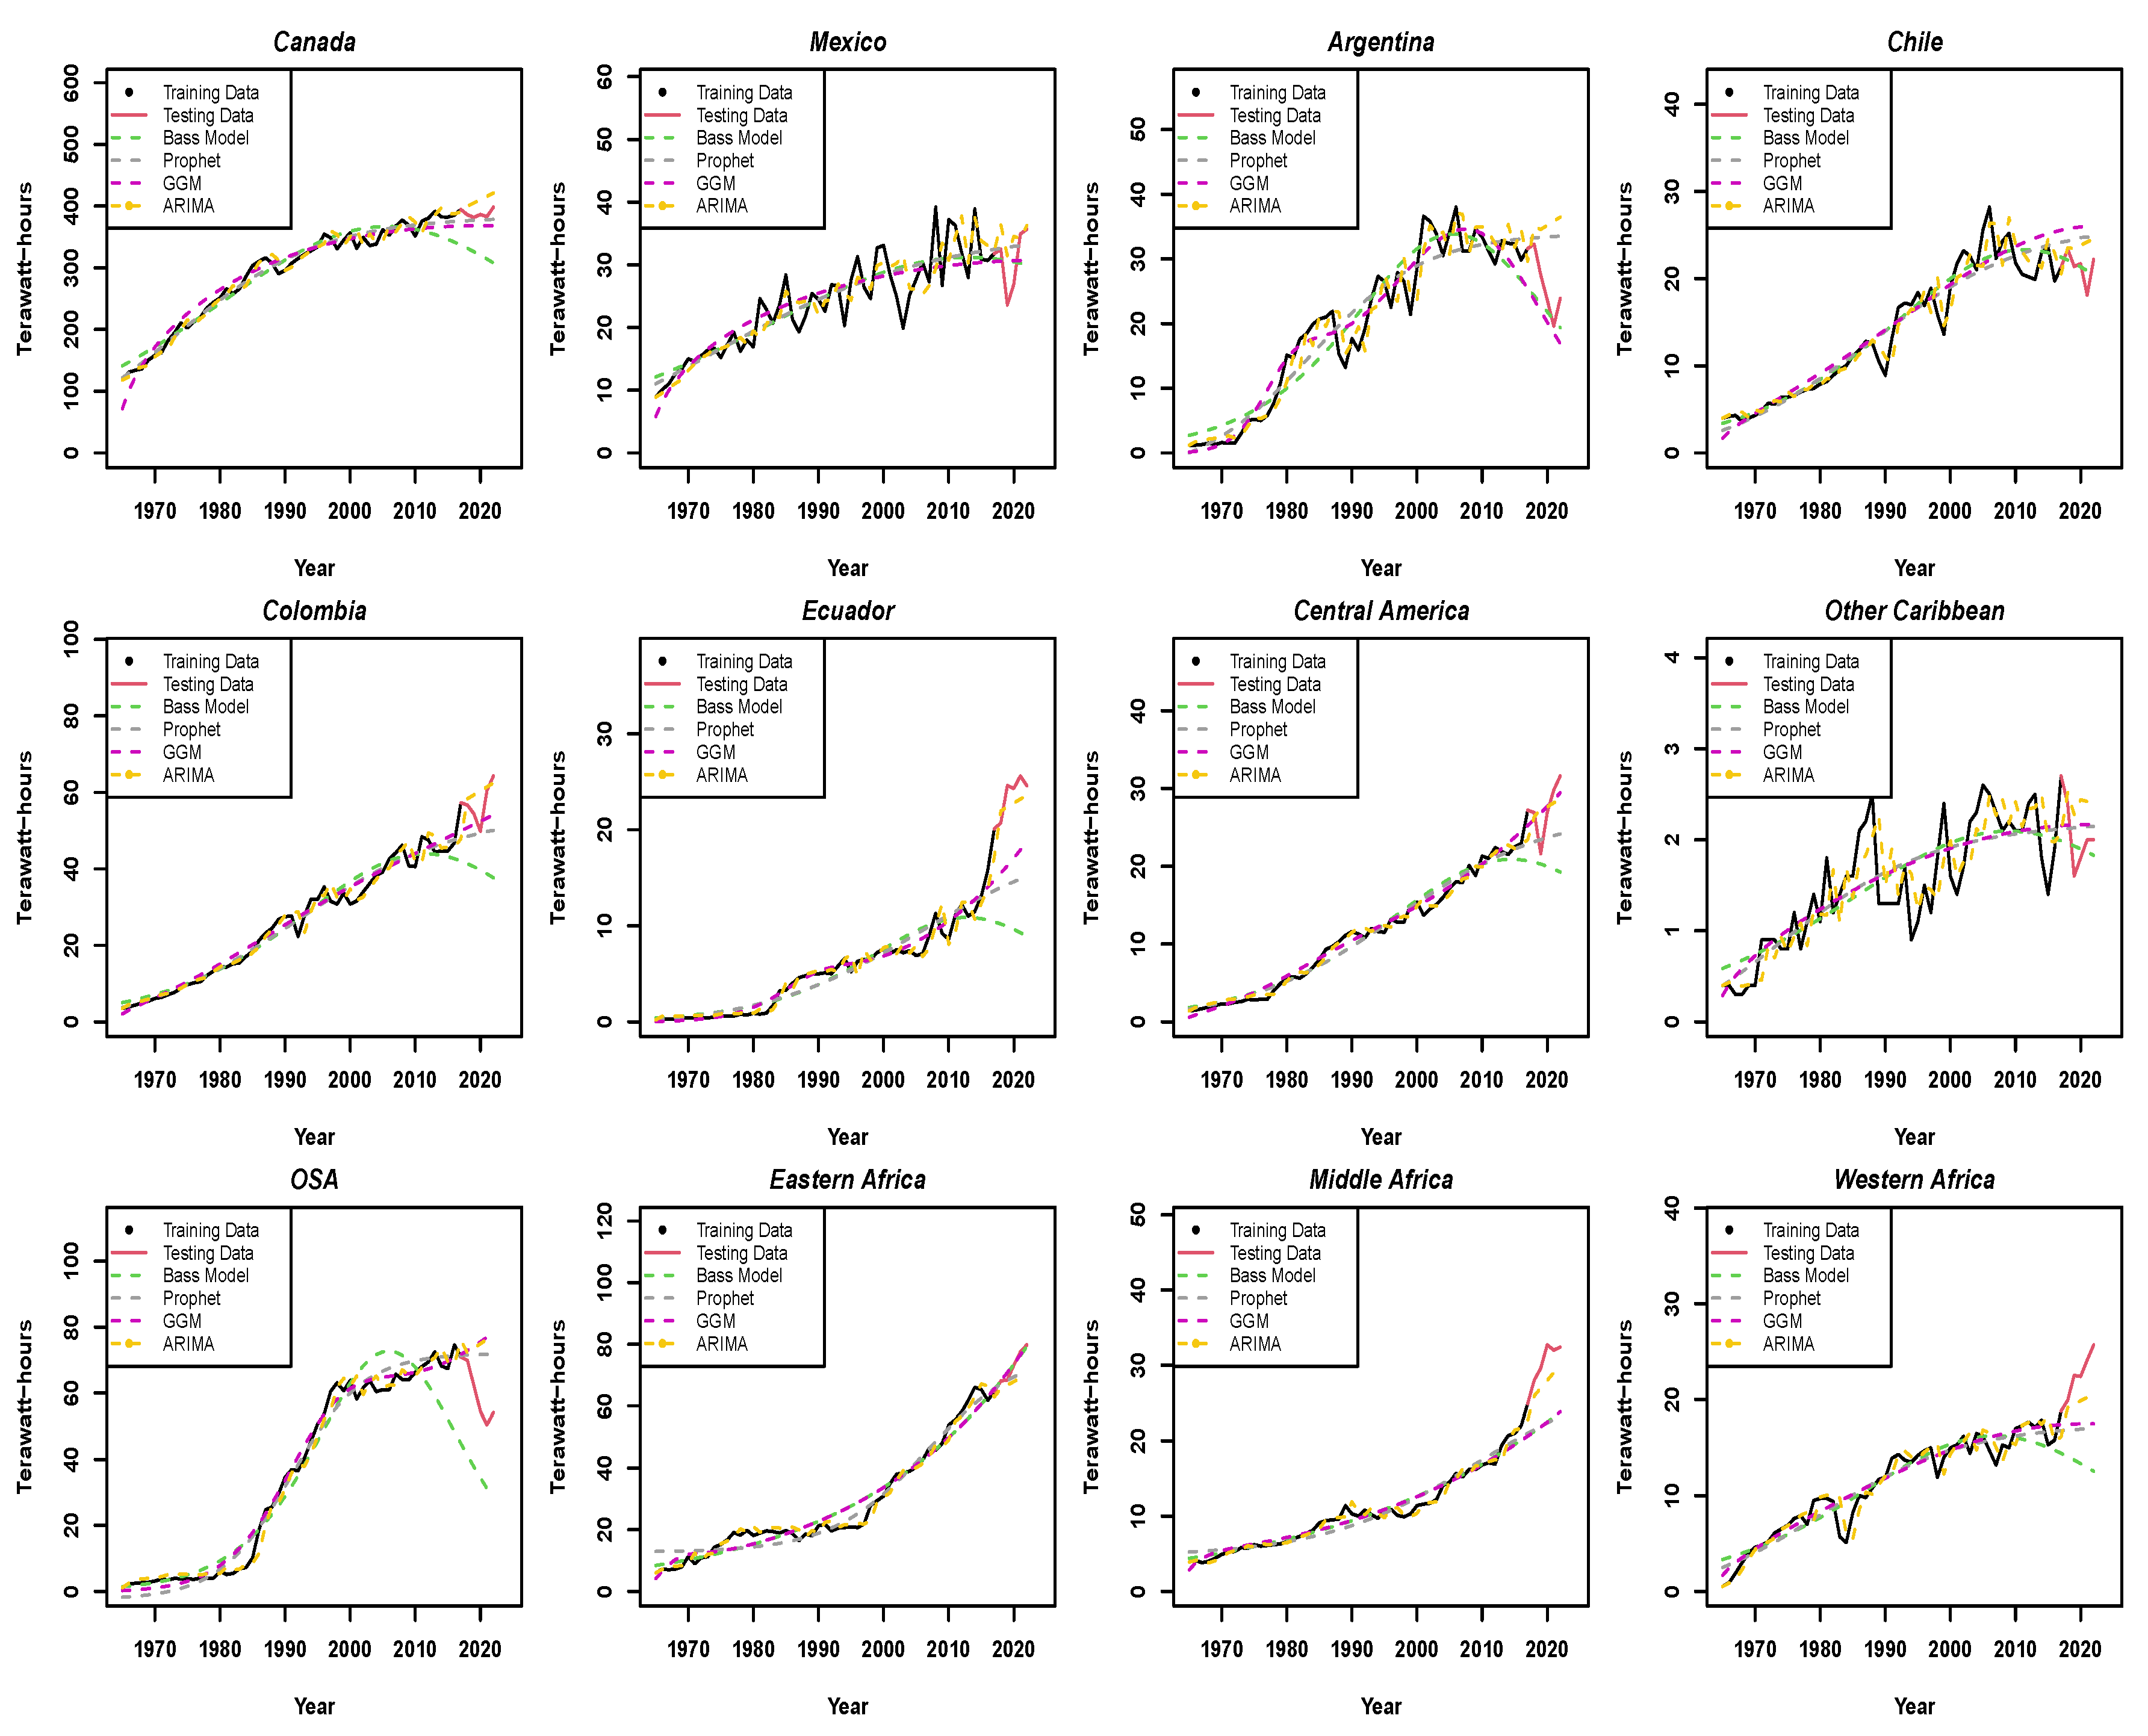
In Figure 2, the dataset has been split into two subsets. The training data consists of 53 data points represented in black, while the test data consists of nine data points shown in red. The figure illustrates the performance of four models—the Bass model (in green), the Prophet model (in blue), the ARIMA model (in yellow), and the GGM (in purple)—for the American and African regions between 1965 and 2022.
The figure displays only 12 countries to showcase various scenarios and assess the models’ performance. The Bass model often underestimates the data when there is a significant increase, but it yields better results in specific countries like Chile and Eastern Africa, where the data exhibits a peak followed by a decrease. On the other hand, the GGM demonstrates superior performance in multiple instances, surpassing the Prophet, ARIMA, and Bass models, in countries like Argentina, Ecuador, the Caribbean, and Brazil. Whereas the Prophet model performs well when there are continuous increases, it tends to either overestimate or underestimate the data when fluctuations occur. This observation suggests that the GGM might be more proficient at capturing and modeling the dynamics in those regions. However, visual comparisons alone are not sufficient to draw conclusive statements. Therefore, a complementary evaluation based on quantitative metrics provided in the model fitting results section is necessary.

3.2. European Regions

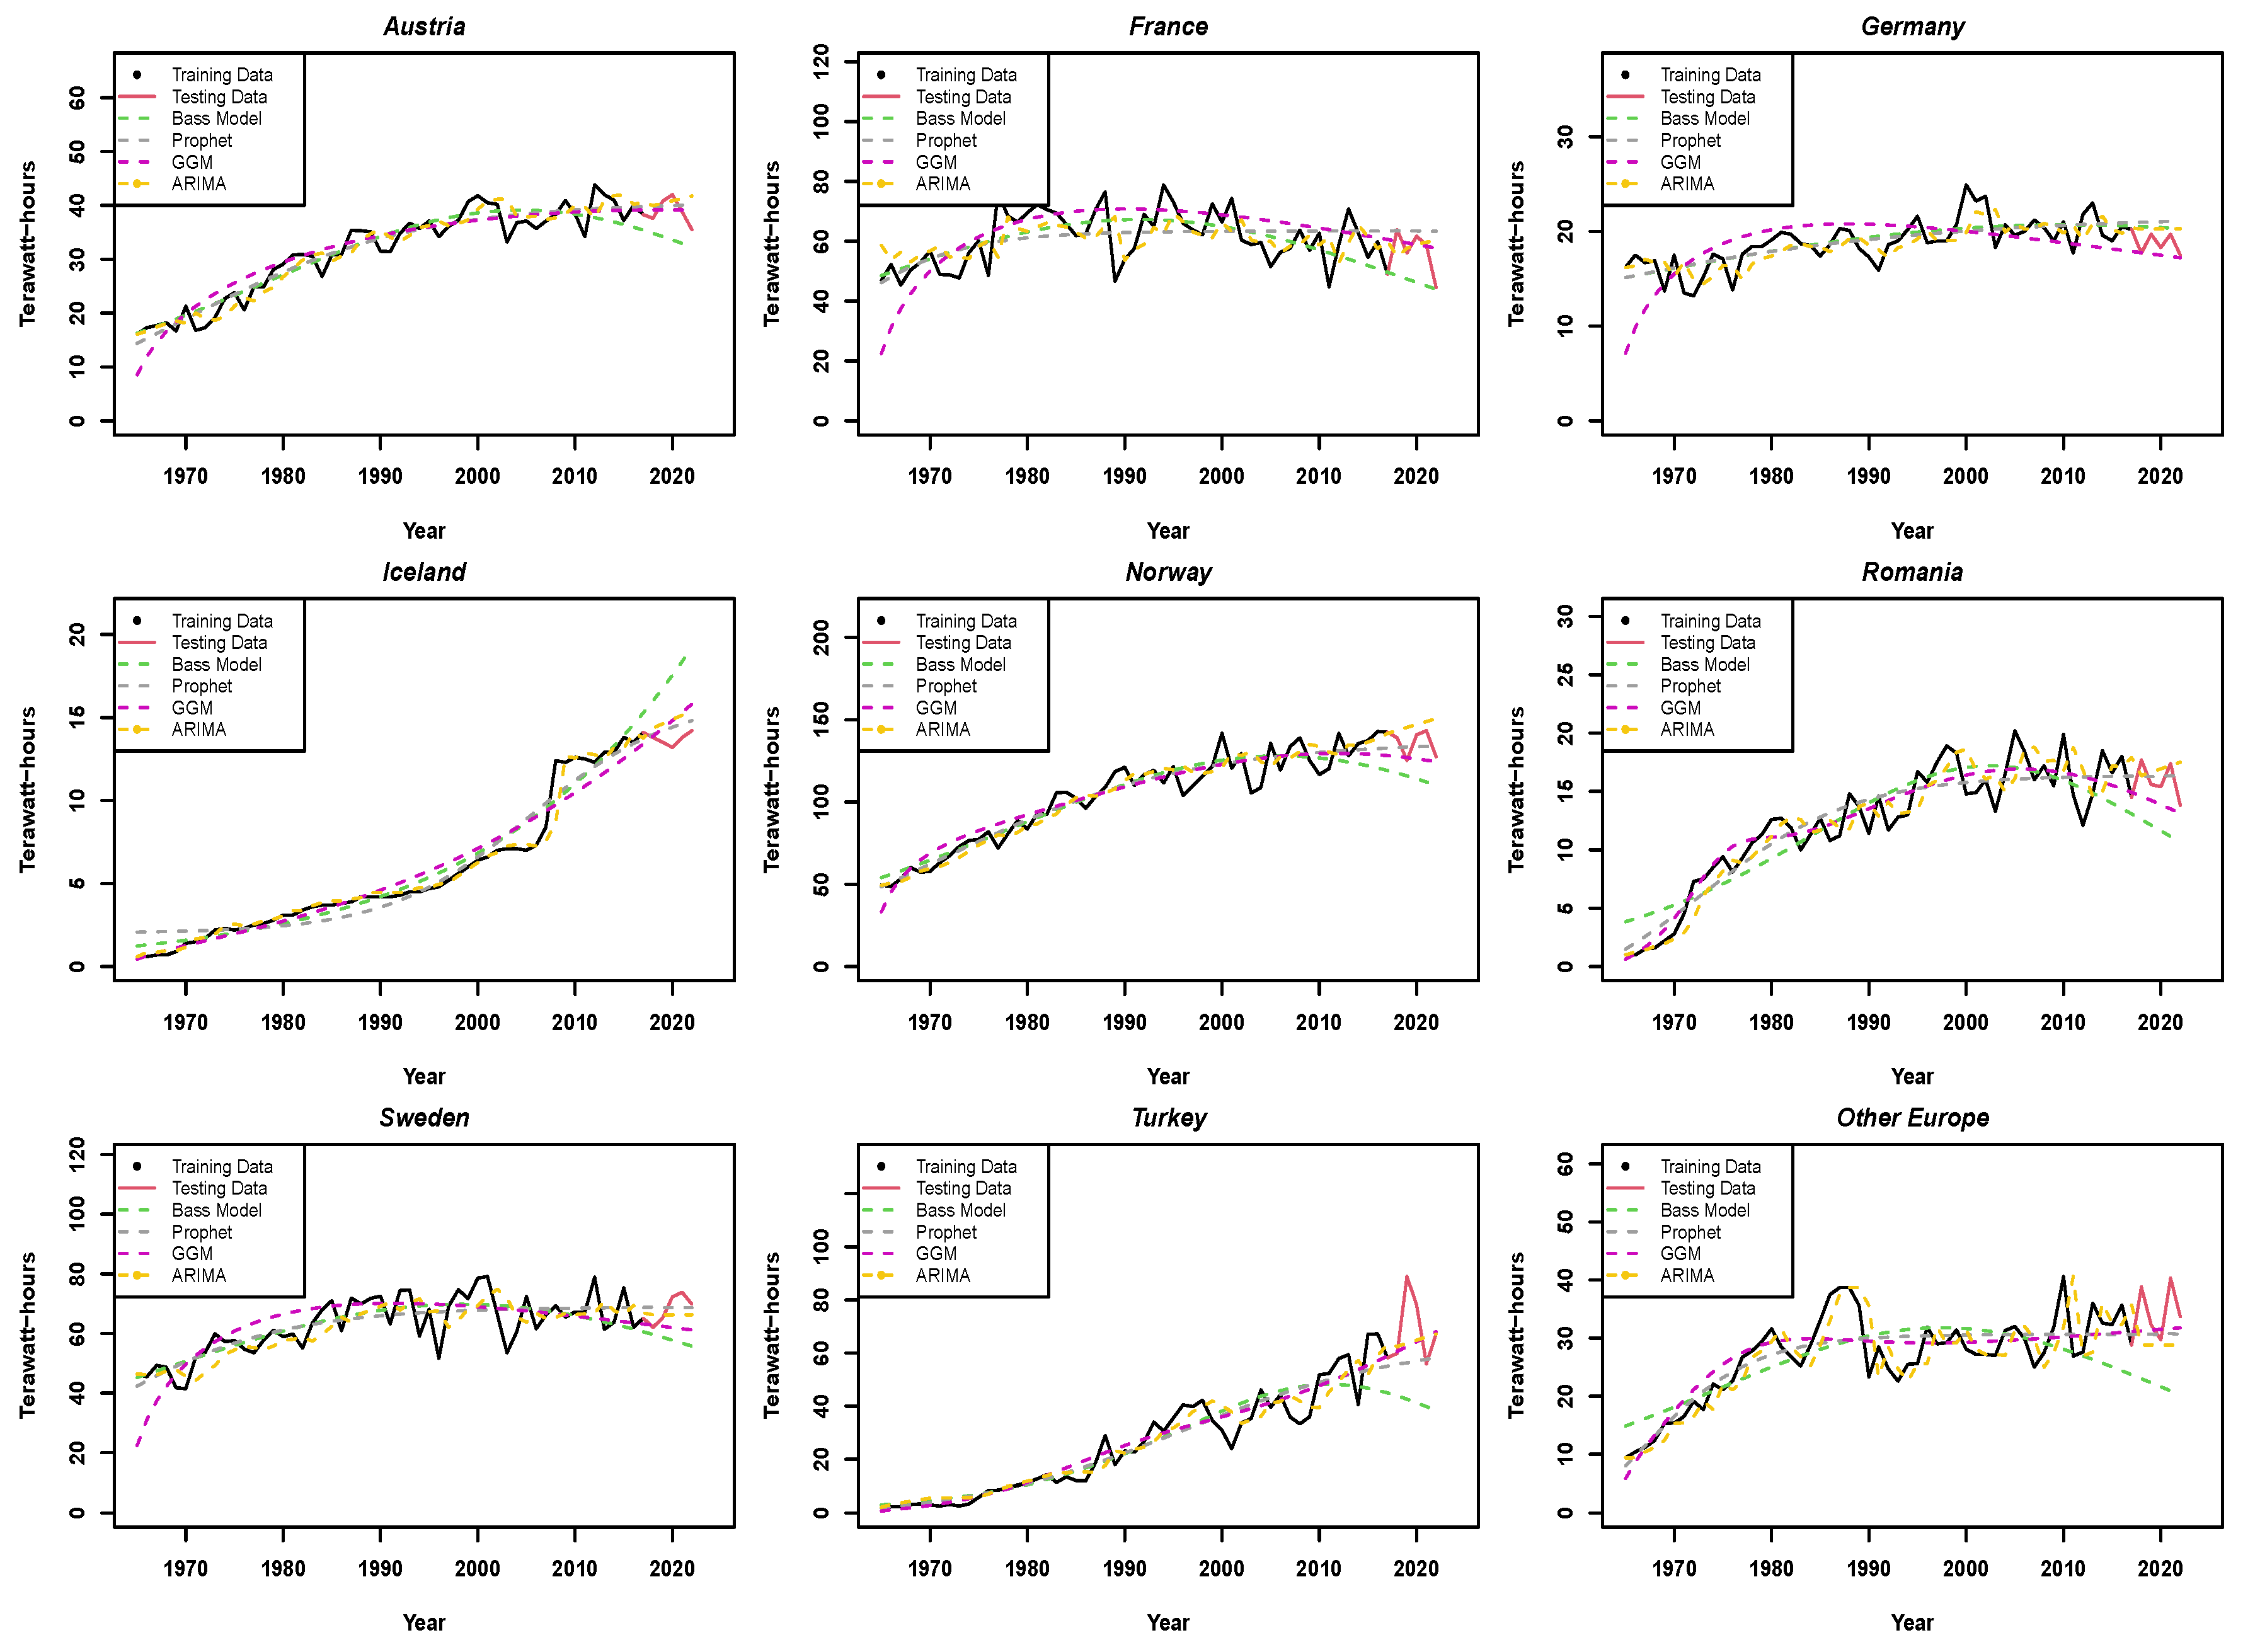
Figure 3 presents a comparative analysis of the models that were applied to the hydroelectric power generation data from European countries. The examination highlights the challenge that arises for determining the best-performing model. This is because of the similarity in hydroelectric generation patterns that are observed across these developed nations. The consistent level of hydropower output maintained by most of these countries results in a close fit by all models under consideration. The figure illustrates that nearly all models fit the data well, indicating stability and minimal fluctuations in hydroelectric generation data from these European countries. However, to discern model performance more effectively, certain countries are selected where differences are apparent. For instance, in Austria, both the GGM and Prophet models perform similarly, whereas the Bass model underestimates the data. Similarly, in countries like Iceland, where hydroelectric generation continues to increase, all models overestimate the data. Nonetheless, upon comparison, the GGM closely aligns with the original data among the four models. Graphically, the performance of the GGM stands out compared to the Bass and Prophet models in the majority of countries. This analysis is expected to incorporate additional metrics to provide a clearer distinction between the models. This will facilitate the identification of the most accurate and reliable model for forecasting hydropower generation in European countries.

3.3. Asia and the Middle East

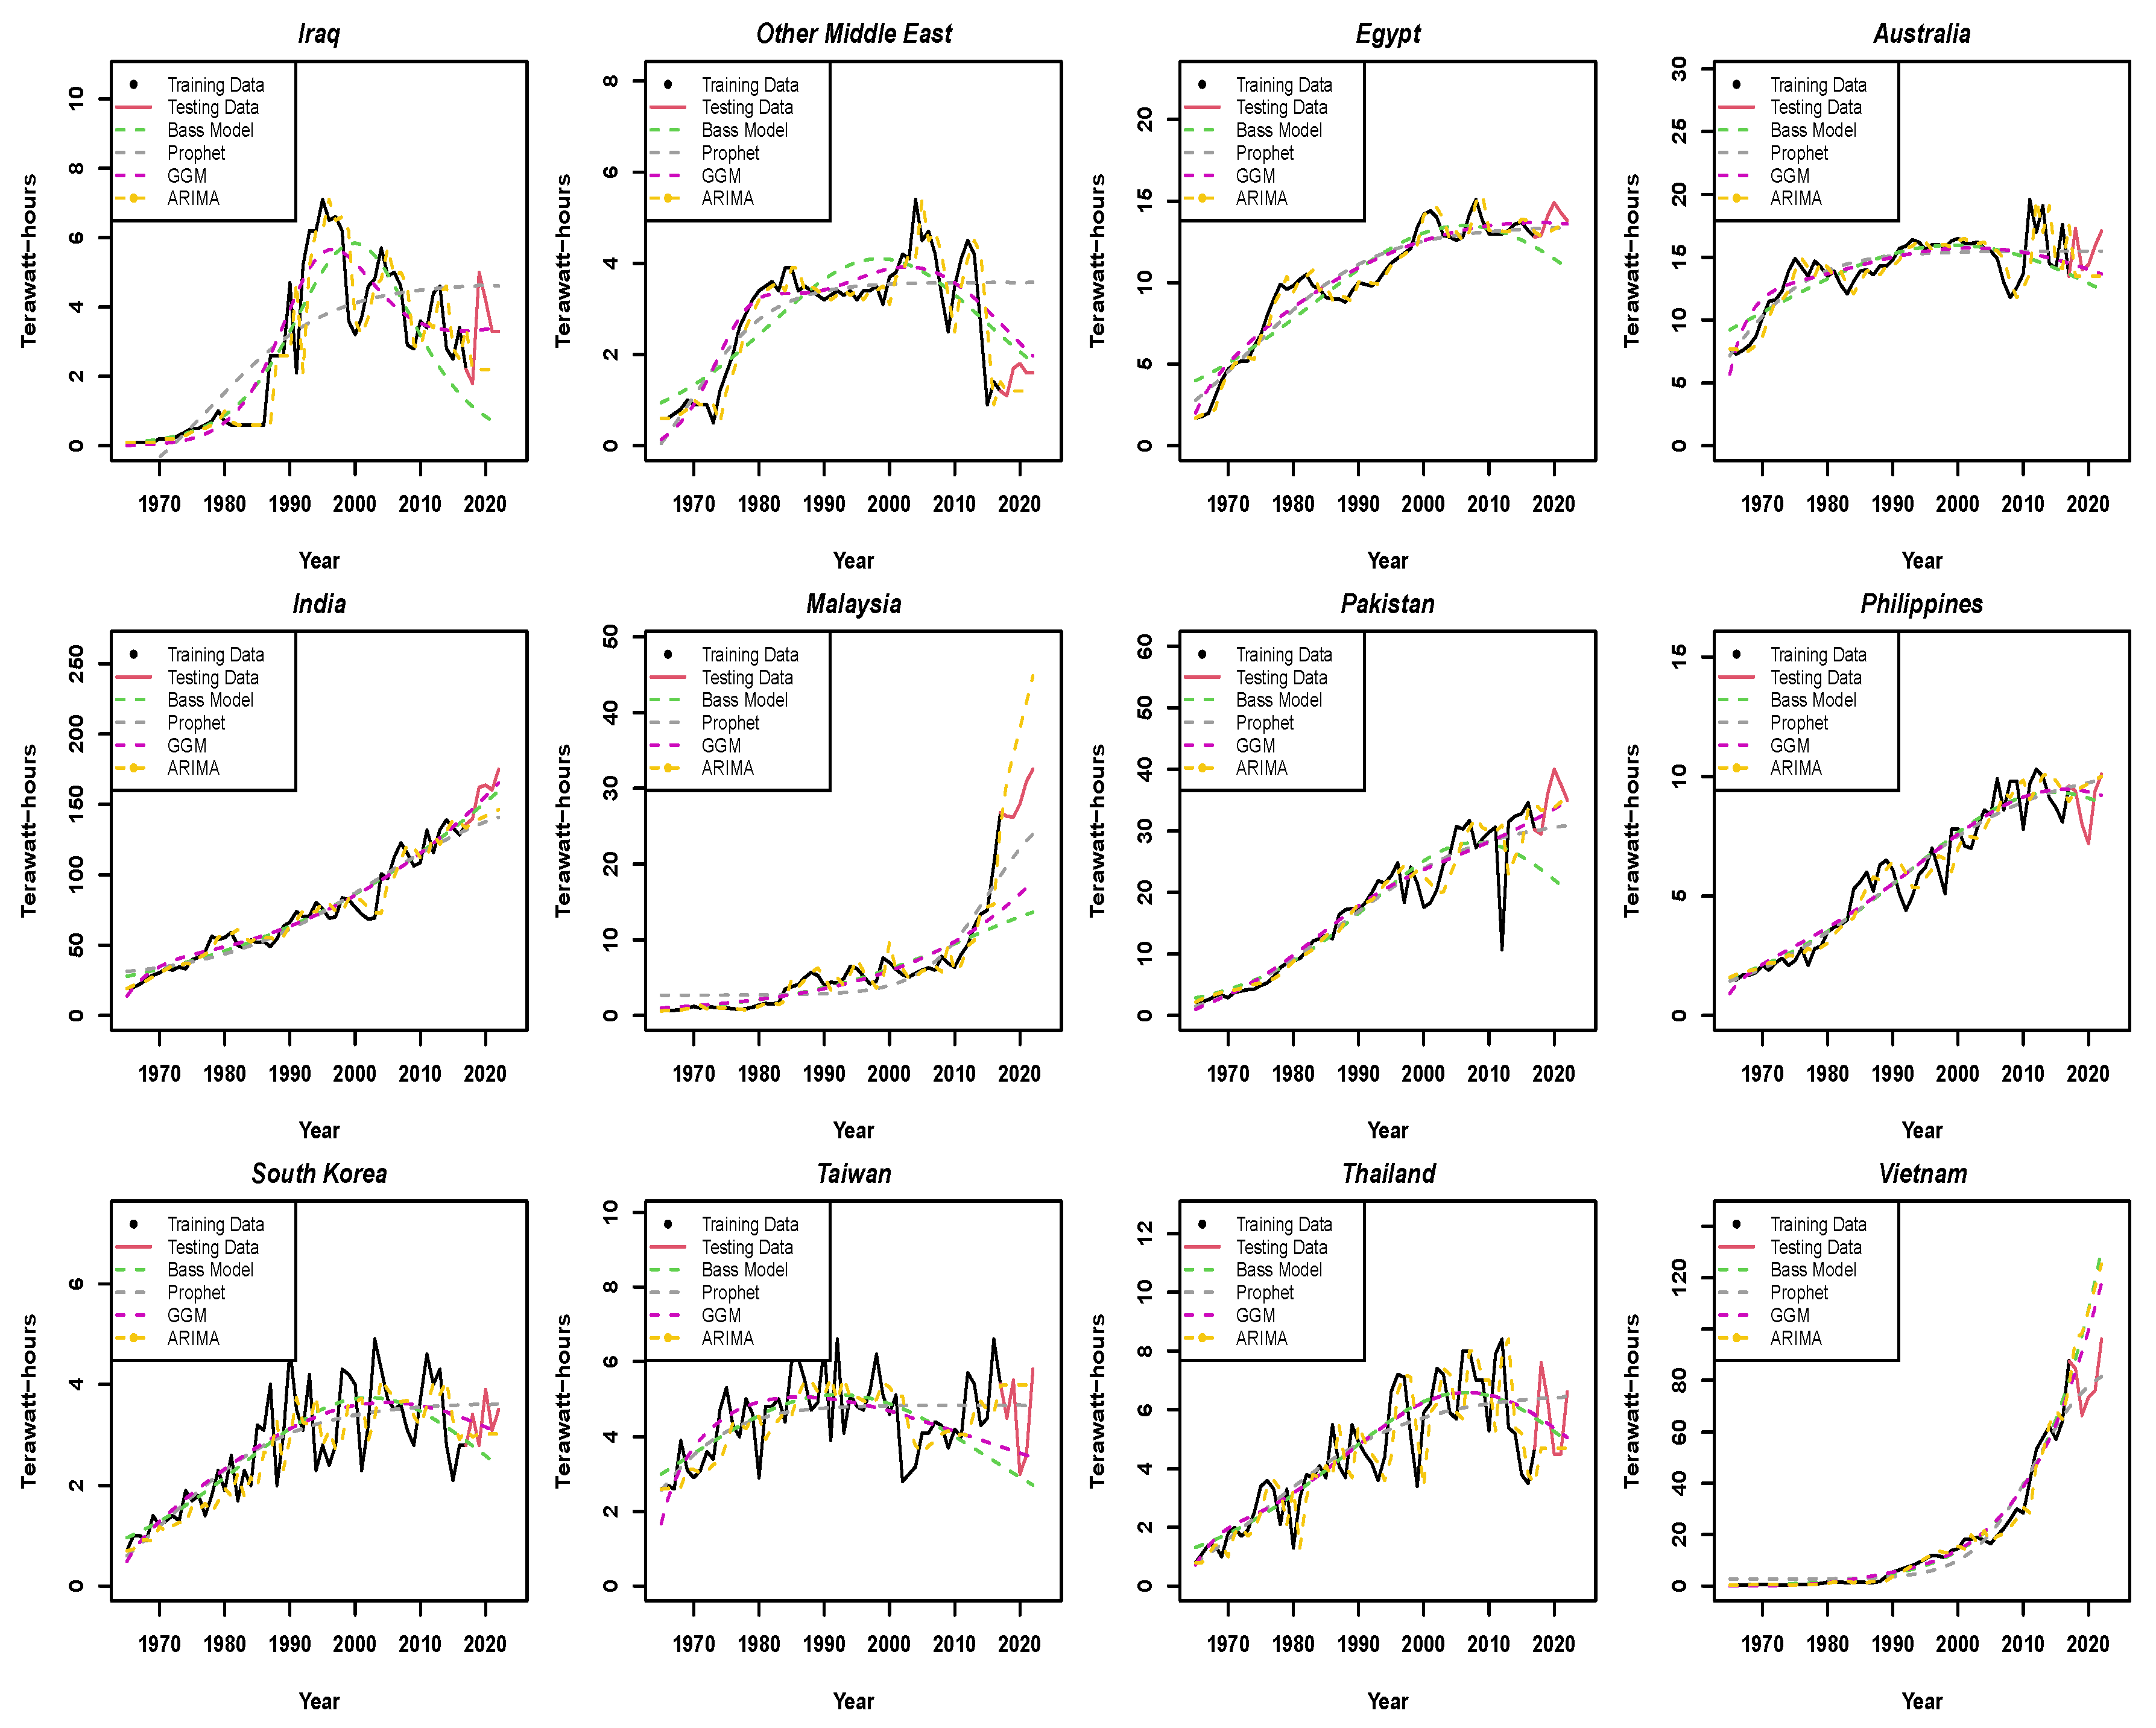
Figure 4 presents the results of the model fitting for hydroelectric generation in the Asian and Middle Eastern regions, where substantial investments have been made in hydroelectric projects. Hydroelectric generation in Asian countries has significantly increased over time. While most models show a good fit with the data, some variations in performance are noticeable. For instance, the GGM generally performs better than the Prophet and Bass models, except for Vietnam. Additionally, the Bass and Prophet models sometimes overestimate or underestimate hydroelectric generation. Also, in this case, the analysis will be completed by considering some performance metrics that are useful for selecting the best model in terms of forecasting ability.

3.4. Evaluation Metrics

Table 1 presents the average performance metrics, including Mean Absolute Error (MAE), Root Mean Squared Error (RMSE), and Mean Absolute Percentage Error (MAPE), for the evaluated models.
The Bass model demonstrates an average MAE of approximately 11.13, indicating that, on average, the model deviates about 11.13 units from the actual hydropower generation values. The corresponding average RMSE of 11.74 reflects the typical magnitude of errors, while the MAPE, averaging around 28.47%, represents the average percentage deviation of the model predictions from the actual hydropower generation values. On the other hand, the GGM exhibits superior performance, with an average MAE of approximately 5.03, implying lesser deviations from the actual hydropower generation values compared to the Bass model. The average RMSE of 5.76 suggests smaller errors in magnitude, and the MAPE, averaging at 16.29%, indicates a lower average percentage deviation from the actual values. Regarding model performance, the Prophet model shows moderate results, with an average MAE of approximately 5.41, falling between the Bass model and the GGM. The corresponding average RMSE of 6.12 signifies the typical magnitude of errors, while the MAPE, averaging around 20.63%, represents the average percentage deviation from the actual hydropower generation values. On the other hand, the ARIMA exhibits superior performance with an average MAE of approximately 5.51, implying lesser deviations from the actual hydropower generation values compared to the Bass model. The average RMSE of 6.28 suggests smaller errors in magnitude, and the MAPE, averaging at 16.40%, indicates a lower average percentage deviation from the actual values. Overall, the GGM exhibits superior performance compared to all the Bass models, ARIMA models, and Prophet models in terms of average error metrics, suggesting it may be the most accurate model for predicting hydropower generation in the evaluated dataset.
Table 2 shows a comparison of the mean absolute percentage error (MAPE) for the four models considered: Prophet, ARIMA, Bass model (BM), and GGM. The rows represent the models being evaluated, while the columns denote the models being compared against. For example, looking at the “Prophet” row, we can see that it performed better than the Bass model (BM) in 28 out of the 40 countries evaluated. It also outperformed the ARIMA in 19 countries, and performed better than the GGM in 13 countries. Similarly, the ARIMA model was outperformed by the Prophet model in 21 countries, while the Bass model outperformed it in 30 countries, and the GGM outperformed it in 15 countries. On the other hand, the GGM performed better than the Prophet model in 27 countries, the Bass model in 33 countries, and the ARIMA in 25 countries. Similarly, the Bass model (BM) was outperformed by the Prophet model in 12 countries, by the GGM in 7 countries, and by the ARIMA model in 10 countries. From these results, we can conclude that the MAPE of GGM is lower in most cases. This indicates that GGM forecasts hydropower data better than the Bass, ARIMA and Prophet models.

4. Conclusions

The world is facing major challenges due to climate change and energy security, and one of the ways to address these issues is by shifting towards renewable energy sources. In this context, accurate forecasting of hydropower generation is crucial for effective energy planning and management. Our study analyzed hydropower generation data collected from 40 countries between 1965 and 2022. We tested various models to predict nonlinear behaviors in hydropower generation. Our analysis focused on comparing the models’ performance across American, African, European, Asian, and Middle Eastern regions. We visually compared the models’ performance, and the GGM emerged as the best model for forecasting hydropower generation due to its superior accuracy. We also used quantitative metrics, such as the Mean Absolute Percentage Error (MAPE), to evaluate the models’ performance accurately. The GGM consistently outperformed the other models in all regions, with lower MAPE values, indicating its superior forecasting accuracy. Although the Bass model demonstrated strengths in countries with distinct data patterns, such as Chile and Eastern Africa, the GGM consistently exhibited superior performance across all regions. The resulting performance of the GGM compared to the other models confirms that innovation diffusion models are viable tools not only for their interpretative power, but also for their forecasting ability in certain settings, leading to a more complete understanding of energy transition phenomena.

Author Contributions

Conceptualization, M.G., F.A. and L.F.; methodology, M.G.; software, M.G.; validation, F.A., M.G. and L.F.; formal analysis, F.A. and M.G.; investigation, M.G. and L.F.; resources, F.A. and M.G.; data curation, F.A.; writing—original draft preparation, F.A. and M.G.; writing—review and editing, M.G. and F.A.; visualization, F.A. and M.G.; supervision, M.G. and L.F.; project administration, F.A., M.G. and L.F. All authors have read and agreed to the published version of the manuscript.

Funding

This research received no external funding.

Institutional Review Board Statement

Not applicaple.

Informed Consent Statement

Not applicable.

Data Availability Statement

Data used in this study is available at https://www.energyinst.org/statisticalreview.

Conflicts of Interest

The authors declare no conflicts of interest.

References

  1. He, P.; Ni, X. Renewable Energy Sources in the Era of the Fourth Industrial Revolution: A Perspective of Civilization Development. J. Phys. Conf. Ser. 2022, 2301, 012030. [Google Scholar] [CrossRef]
  2. Malhotra, R. Fossil energy: Introduction. In Fossil Energy; Springer: New York, NY, USA, 2020; pp. 1–4. [Google Scholar] [CrossRef]
  3. Savio, A.; Ferrari, G.; Marinello, F.; Pezzuolo, A.; Lavagnolo, M.C.; Guidolin, M. Developments in Bioelectricity and Perspectives in Italy: An Analysis of Regional Production Patterns. Sustainability 2022, 14, 15030. [Google Scholar] [CrossRef]
  4. de Freitas Cavalcanti, J.T.; de Lima, J.G.; do Nascimento Melo, M.R.; Monteiro, E.C.; Campos-Takaki, G.M. Fossil Fuels, Nuclear Energy and Renewable Energy; Seven Editora: São José, Brazil, 2023. [Google Scholar] [CrossRef]
  5. Kabeyi, M.J.; Olanrewaju, O.A. Sustainable energy transition for renewable and low carbon grid electricity generation and supply. Front. Energy Res. 2022, 9, 1032. [Google Scholar] [CrossRef]
  6. Bakis, R. The current status and future opportunities of hydroelectricity. Energy Sources Part B 2007, 2, 259–266. [Google Scholar] [CrossRef]
  7. Guseo, R.; Guidolin, M. Modelling a dynamic market potential: A class of automata networks for diffusion of innovations. Technol. Forecast. Soc. Chang. 2009, 76, 806–820. [Google Scholar] [CrossRef]
  8. Guidolin, M. Innovation Diffusion Models: Theory and Practice; John Wiley and Sons: Hoboken, NJ, USA, 2023. [Google Scholar]
  9. Taylor, S.J.; Letham, B. Forecasting at scale. Am. Stat. 2018, 72, 37–45. [Google Scholar] [CrossRef]
  10. Geem, Z.W.; Roper, W.E. Energy demand estimation of South Korea using artificial neural network. Energy Policy 2009, 37, 4049–4054. [Google Scholar] [CrossRef]
  11. Zhu, Q.; Guo, Y.; Feng, G. Household energy consumption in China: Forecasting with BVAR model up to 2015. In Proceedings of the 2012 Fifth International Joint Conference on Computational Sciences and Optimization, Harbin, China, 23–26 June 2012. [Google Scholar]
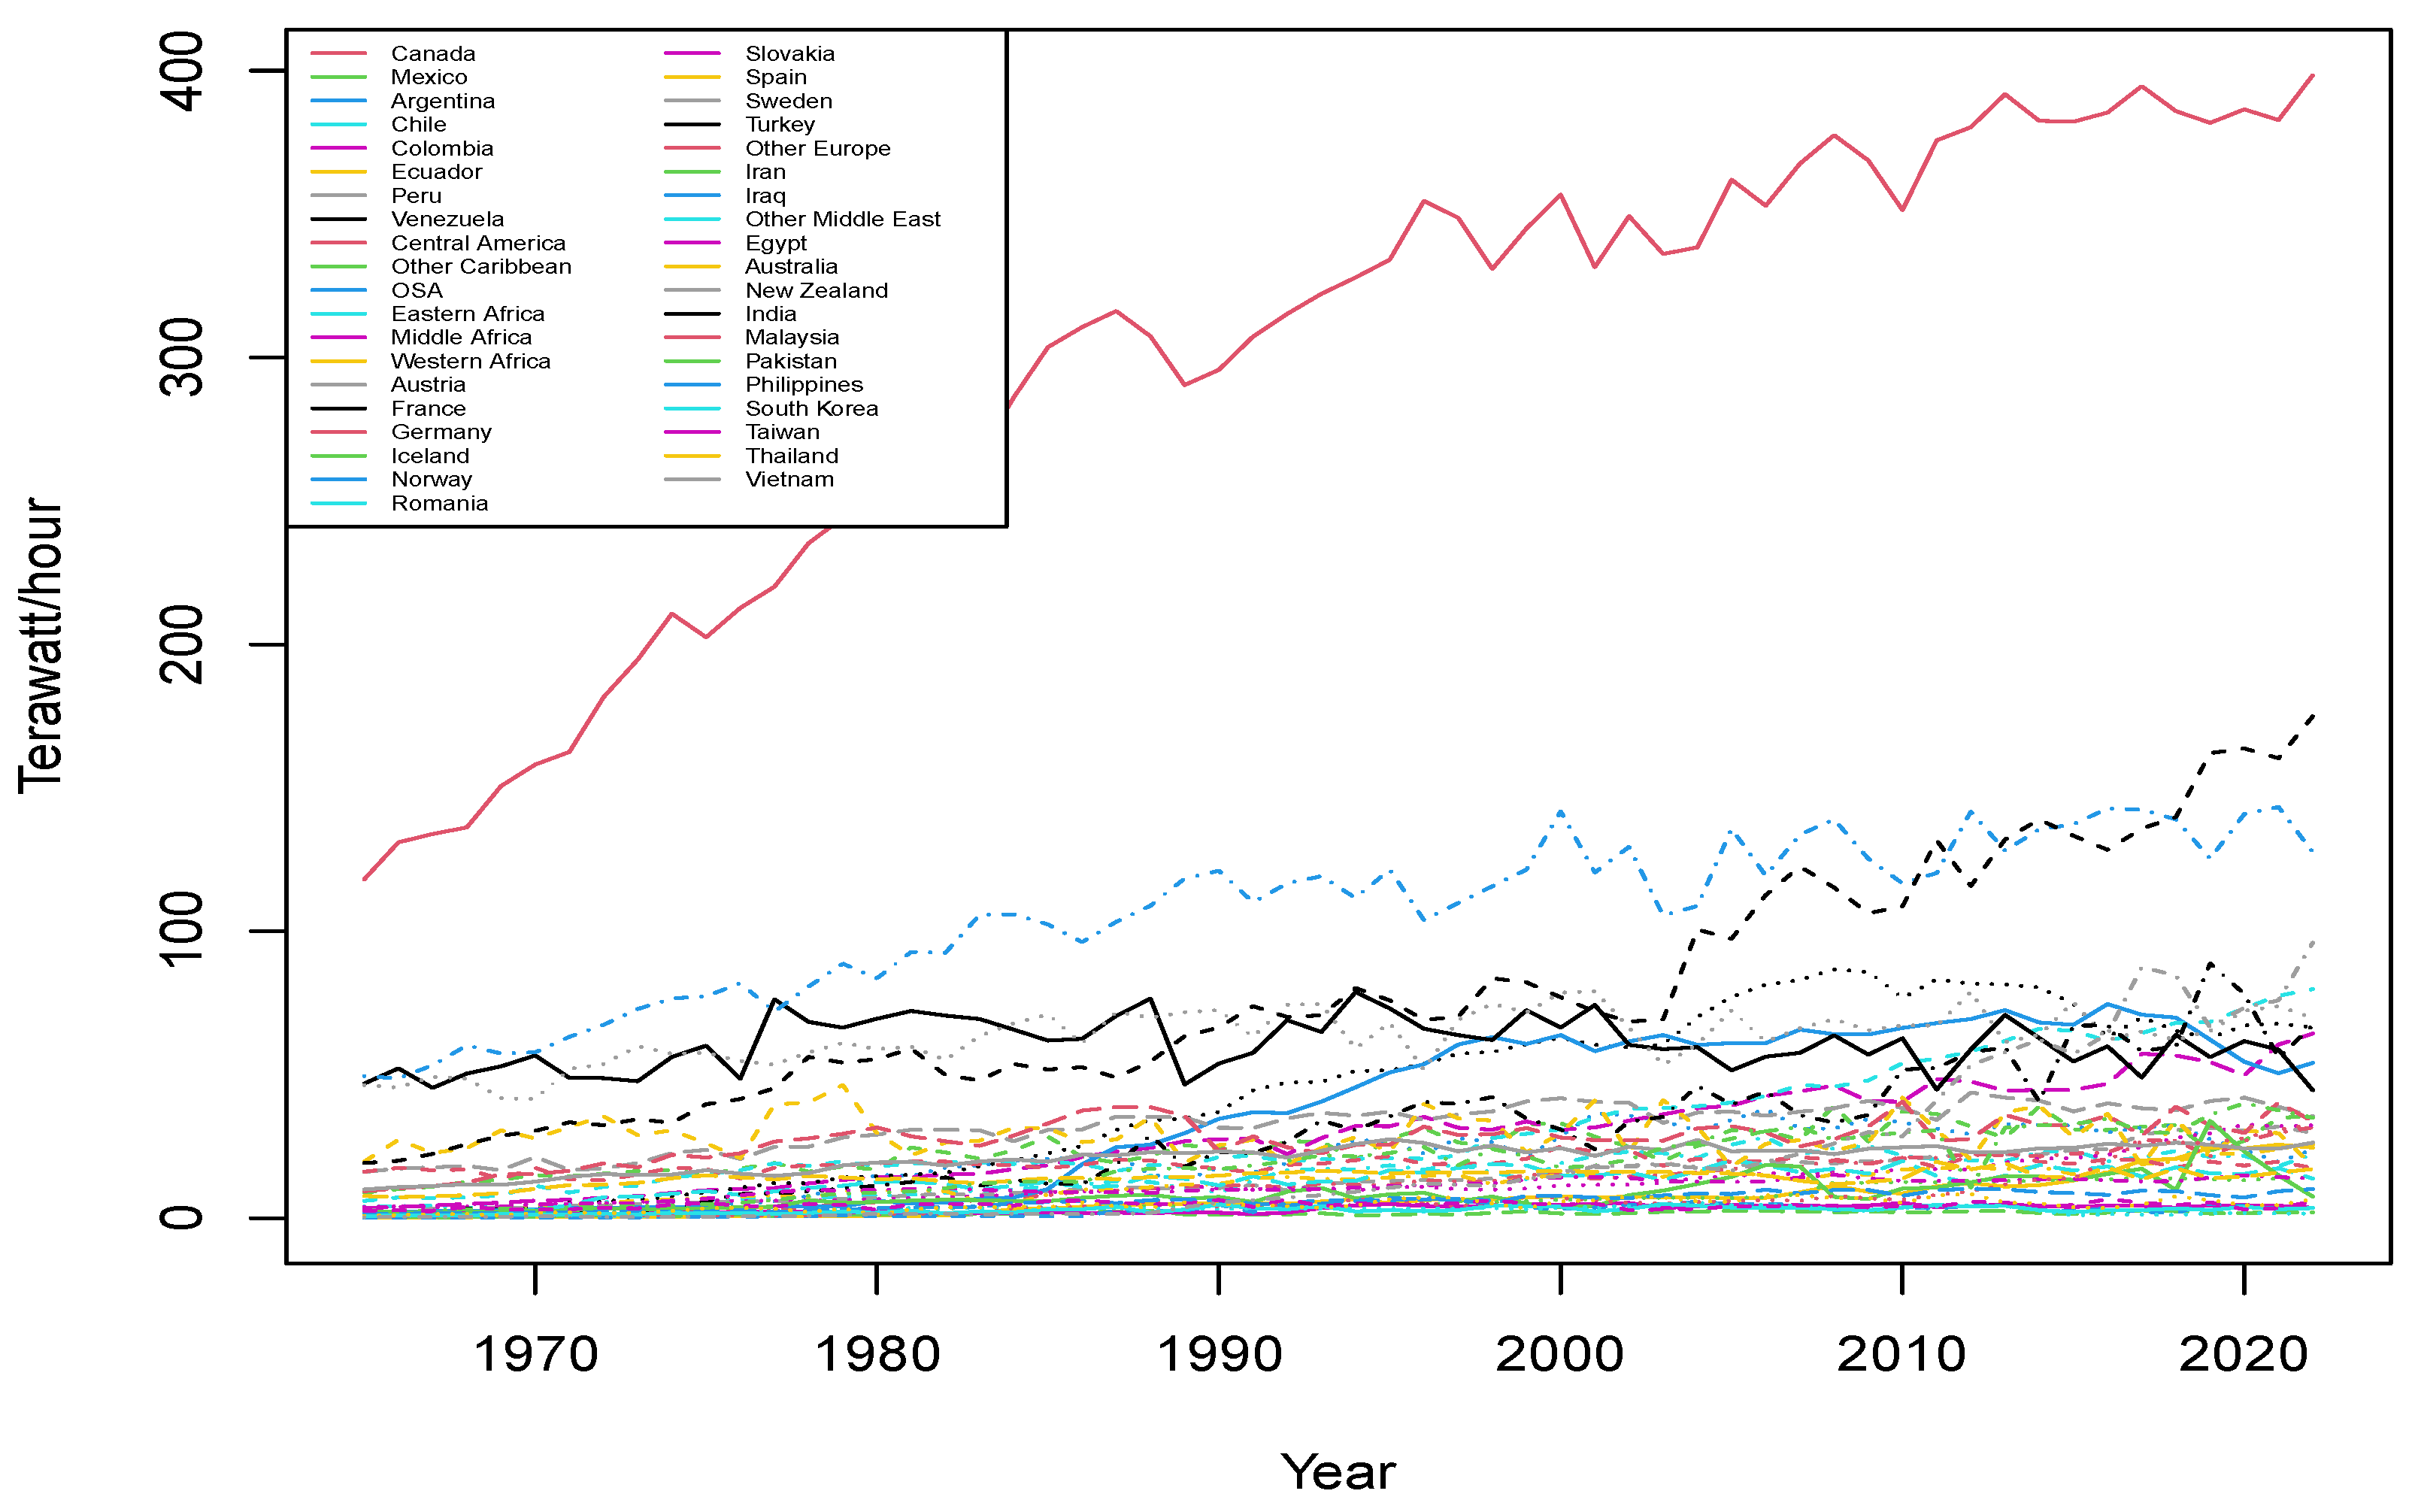
Figure 1. Hydroelectricity generation by all countries.
Engproc 68 00056 g001
Figure 2. America and South Africa.
Engproc 68 00056 g002
Figure 3. Europe.
Figure 3. Europe.
Engproc 68 00056 g003
Figure 4. Asia and Middle East.
Engproc 68 00056 g004
Table 1. Model comparison based on MAE, RMSE and MAPE.
ModelMAERMSEMAPE
BM11.1311.7428.47
GGM5.035.7516.29
Prophet5.416.1220.63
ARIMA5.516.2816.43
Table 2. Model comparison based on MAPE.
ProphetARIMABMGGM
Prophet0192813
ARIMA2103015
BM121007
GGM2725330
Disclaimer/Publisher’s Note: The statements, opinions and data contained in all publications are solely those of the individual author(s) and contributor(s) and not of MDPI and/or the editor(s). MDPI and/or the editor(s) disclaim responsibility for any injury to people or property resulting from any ideas, methods, instructions or products referred to in the content.