Abstract
Surveillance Response Systems (SRSs) have been deployed in Water Distribution Networks (WDNs) to detect various contamination events. However, in WDNs, some contaminants may remain undetected by an SRS due to the specificity of online water quality monitoring (OWQM). To overcome this limitation, OWQM can be supplemented with additional datasets to enhance the detection capabilities of the SRS framework. These additional datasets are based on health-seeking behaviors exhibited by consumers after consuming contaminated water as well as customer complaints. In this research, we implement a set of Bayesian networks in a clustered network to fuse these alternate datasets (simulated using an ABM due to the limited information associated with real events) with traditional OWQM to determine the likelihood of an ongoing contamination event.
1. Introduction
Contamination events in Water Distribution Networks (WDNs) must be detected in a timely manner to minimize the exposure of consumers to undesirable impacts, particularly on public health. Traditional approaches for event detection have relied on the detection of abnormal behaviors in water quality parameters (i.e., free chlorine, turbidity, etc.) collected through online monitoring. However, there are two disadvantages of these approaches include: (1) sensors may be expensive and contaminant-specific, and (2) some contaminants might remain undetected when using traditional monitoring techniques. Thus, this paper focuses on the integration of alternative data streams that could suggest the occurrence of a contamination event. After an event is detected, an investigation shall be conducted to confirm/rule out the incident.
The USEPA developed a set of guidelines to design a Surveillance Response System (SRS)—formerly known as a Contaminant Warning System—containing four components to supervise water quality in a WDN: online water quality monitoring, enhanced security monitoring, customer complaint surveillance, and public health surveillance [1]. Previous research has focused on individual components of SRSs (i.e., public health and customer complaints), either as a replacement or supplement for sensors.
The synergy between the components of an SRS has been suggested to maximize the benefits of multiple datasets acting together based on their independent capabilities [2]. Recent studies attempted to integrate multiple sensor measurements to enhance the detection capabilities of SRSs in WDNs, including the correlation between multiple types of water quality sensors and the fusion of individual alarms generated by monitoring multiple water quality parameters [3].
Efforts to integrate water quality data with other types of evidence have considered the use of Bayesian networks (BNs). BNs capture qualitative relationships between variables—represented as nodes—measuring the strength of these connections as conditional probability distributions. Some examples explored in previous studies include event detection [4,5,6] and the prediction of lead levels in tap water [7].
Given the relatively scarce amount of research conducted on the assessment of the combined effect of multiple data sources, the approach described in this paper is being designed to integrate data from multiple sources to estimate the likelihood of a contamination event in a WDN using a BN. The studied WDN is grouped, ensuring similar water quality dynamics within each cluster, and, afterwards, a BN is implemented at each cluster unit. Given the low amount of information available from real contamination events, an Agent-Based Model (ABM) is used to model the spread of the outbreak of a waterborne disease and the subsequent behavior of the affected population after noticing the effects of the contaminant. This research is limited to contaminants whose symptoms will appear in the short-term such as acute gastrointestinal illness (AGI). Based upon the results, the feasibility of using supplementary data in event detection will be established. Furthermore, the proposed BN creates a framework for integrating data collected outside of the network with the existing hydraulic information collected about the system.
2. Materials and Methods
The proposed methodology for integrating multiple data sources for event detection comprises three stages: the development of an ABM to synthetically generate the datasets, spatial aggregation of information based on clusters grouped by similar water quality dynamics [8], and the use of a Bayesian network to detect a potential event.
2.1. Agent-Based Model
An ABM was developed to model the spread of a waterborne outbreak and the consequent actions that people may take after noticing the effects of a contaminant. A contamination event is simulated as the intrusion of a pathogen (e.g., norovirus, cryptosporidium) due to a pipe break, and the concentration of contaminant at each junction is obtained with EPANET [9]. Population is concentrated at demand junctions, and a three-times-per-day consumption pattern is assumed per agent [10].
The infection model is assumed to correspond to the following steps: Susceptible, Exposed, Infected, and Recovered. Altogether, they are known as an SEIR model. Transitions between the states are based on incubation and illness durations, which are modeled as random variables parametrized with values available in the literature. When an agent is infected and symptomatic (vomiting and suffering from diarrhea), multiple health-seeking behaviors (i.e., virtual consultation, clinic and ED visits, etc.) could be taken based on the severity of symptoms.
Multiple pipe breaks may occur during a simulation, assigned randomly throughout the network. Agents can also report observable pipe breaks either by calling the relevant utility service number or using any social media platform. Taste/odor/color are not included in the observable features agents notice as the considered pathogens do not affect the physical properties of water. The duration of the simulation is 30 days, and agents make decisions every hour. Results collected from the ABM are aggregated spatially into a set of clusters defined previously following the methodology proposed by Qin and Boccelli [8].
2.2. Bayesian Network
An individual BN is implemented within each cluster according to the structure shown in Figure 1. The proposed setup incorporates 4 groups of variables: public health, customer complaints, reports from utilities, and water quality monitoring. Public health surveillance considers reports from 5 possible healthcare actions taken by consumers if they experience AGI symptoms. According to the severity of the symptoms, these actions include virtual consultation (less severe), outpatient visits, urgent care visits, emergency department (ED) visits, and inpatient hospitalizations (for the most severe symptoms). Customer complaint surveillance considers calls to the utility and social media posting regarding any issue with the water network (i.e., observable breaks, low pressures, or health issues). These data streams may be produced by the outbreak itself or by activities that are available in utility operational reports such as reported maintenance, pipe breaks and low pressure. Finally, water quality monitoring considers the reports of sensors placed within the network, as well as data collected at confirmatory sampling locations in case an event is detected. Each dataset (variable) is assumed to be collected every hour for 1 month.
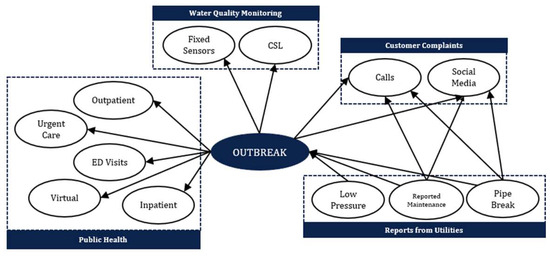
Figure 1.
Proposed Bayesian network for each cluster.
3. Preliminary Results and Discussion
The proposed methodology was tested using Net3 [9], assuming the injection of a pathogen at hour 3 due to a pipe break in Node 10. The ABM considered a population of approximately 53,000 inhabitants, and five pipe breaks were allocated randomly. Net3 was monitored through five non-specific water quality sensors placed throughout the network, and no confirmatory sampling locations were considered. The WDN is grouped into six clusters based on the similar water quality dynamics within them. Operational reports from the utility only included pipe breaks in the tests presented in this paper. Based upon these settings, the BN was trained using data simulated by the ABM, leading to the results shown in Figure 2. The tables at each cluster display the probability of an ongoing outbreak (as Yes or No) given the datasets described above.
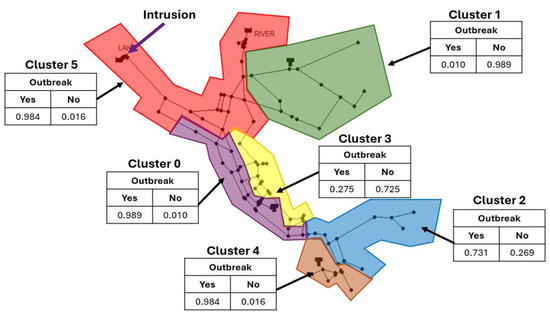
Figure 2.
Preliminary results for the proposed methodology tested using Net3.
The preliminary results indicated there is a very high probability of an ongoing outbreak at clusters 0, 5 and 4, with cluster 2 also showing a high probability of an ongoing outbreak. All four clusters are downstream of the injection location at node 10. Clusters 0 and 4 also coincide with the location of two storage tanks, which may be reinforcing the spread of contaminant by storing contaminated water and distribute them to the surrounding population. In addition, the proposed methodology (in an early stage) is promising as it is able to detect an ongoing outbreak in a WDN by fusing data from different sources such as public health, customer complaints, utility operational reports, and water quality monitoring. This research is still in progress; further steps include the fusion of all the described data streams, conducting a sensitivity analysis on the capabilities of each dataset, and testing the methodology in a real-size network.
Author Contributions
Conceptualization, C.S. and D.L.B.; methodology, C.S.; software ABM-BN, C.S.; data analysis, C.S.; supervision, D.L.B.; writing—original draft preparation, C.S.; writing—review and editing, D.L.B. All authors have read and agreed to the published version of the manuscript.
Funding
This research received no external funding.
Institutional Review Board Statement
Not applicable.
Informed Consent Statement
Not applicable.
Data Availability Statement
The data that support the results reported in this paper can be made available on request made to the first author (C.S). This research is still in progress.
Acknowledgments
The authors would like to thank the University of Arizona and the Salt River Project for partial funding support of this research.
Conflicts of Interest
The authors declare no conflicts of interest.
References
- United States Environmental Protection Agency—USEPA. Water Quality Surveillance and Response System Primer. Epa 2015, EPA 817-B-15-002, 1–7. [Google Scholar]
- Pickard, B.; Haas, A.; Allgeier, S. Optimizing Operational; American Water Works Association: Denver, CO, USA, 2011. [Google Scholar]
- Li, Z.; Zhang, C.; Liu, H.; Zhang, C.; Zhao, M.; Gong, Q.; Fu, G. Developing Stacking Ensemble Models for Multivariate Contamination Detection in Water Distribution Systems. Sci. Total Environ. 2022, 828, 154284. [Google Scholar] [CrossRef] [PubMed]
- Burkom, H.S.; Ramac-Thomas, L.; Babin, S.; Holtry, R.; Mnatsakanyan, Z.; Yund, C. An Integrated Approach for Fusion of Environmental and Human Health Data for Disease Surveillance. Stat. Med. 2011, 30, 470–479. [Google Scholar] [CrossRef] [PubMed]
- Dawsey, W.J.; Minsker, B.S.; VanBlaricum, V.L. Bayesian Belief Networks to Integrate Monitoring Evidence of Water Distribution System Contamination. J. Water Resour. Plan. Manag. 2006, 132, 234–241. [Google Scholar] [CrossRef]
- Perelman, L.; Ostfeld, A. Bayesian Networks for Source Intrusion Detection. J. Water Resour. Plan. Manag. 2013, 139, 426–432. [Google Scholar] [CrossRef]
- Khaksar Fasaee, M.A.; Monghasemi, S.; Nikoo, M.R.; Shafiee, M.E.; Berglund, E.Z.; Bakhtiari, P.H. A K-Sensor Correlation-Based Evolutionary Optimization Algorithm to Cluster Contamination Events and Place Sensors in Water Distribution Systems. J. Clean. Prod. 2021, 319, 128763. [Google Scholar] [CrossRef]
- Qin, T.; Boccelli, D.L. Grouping Water-Demand Nodes by Similarity among Flow Paths in Water-Distribution Systems. J. Water Resour. Plan. Manag. 2017, 143, 04017033. [Google Scholar] [CrossRef]
- Rossman, L.A. Epanet 2 User ’s Manual; Water Supply and Water Resources Division; National Risk Management Research Laboratory: Cincinnati, OH, USA, 2000. [Google Scholar]
- Davis, M.J.; Janke, R. Importance of Exposure Model in Estimating Impacts When a Water Distribution System Is Contaminated. J. Water Resour. Plan. Manag. 2008, 134, 449–456. [Google Scholar] [CrossRef]
Disclaimer/Publisher’s Note: The statements, opinions and data contained in all publications are solely those of the individual author(s) and contributor(s) and not of MDPI and/or the editor(s). MDPI and/or the editor(s) disclaim responsibility for any injury to people or property resulting from any ideas, methods, instructions or products referred to in the content. |
© 2024 by the authors. Licensee MDPI, Basel, Switzerland. This article is an open access article distributed under the terms and conditions of the Creative Commons Attribution (CC BY) license (https://creativecommons.org/licenses/by/4.0/).