Proceeding Paper

Utilizing Calibration Model for Water Distribution Network Leakage Detection †

Department of Civil and Environmental Engineering, Hannam University, Daejeon 34430, Republic of Korea
*
Author to whom correspondence should be addressed.
Presented at the 3rd International Joint Conference on Water Distribution Systems Analysis & Computing and Control for the Water Industry (WDSA/CCWI 2024), Ferrara, Italy, 1–4 July 2024.
Eng. Proc. 2024, 69(1), 105; https://doi.org/10.3390/engproc2024069105
Published: 10 September 2024

Abstract

:
Leakage presents a significant challenge in water distribution network (WDN) planning and management. This study introduces a novel methodology for hydraulic model calibration and leak detection based on MCMC-Statistical Distance. The central hypothesis posits that the presence of leaks induces fluctuations in estimated pipe roughness coefficients (PRCs) as the pipe flow changes, reflecting the altered behavior of leaking pipes in energy dissipation. The proposed model comprises two distinct algorithms: (1) PRC estimation using MCMC and (2) a leakage detection algorithm employing a Kolmogorov–Smirnov test. Demonstrated in a simple water distribution network with various scenarios, the results illustrate the model’s potential for real-time leak detection.

1. Introduction

Leakage poses a significant challenge in the planning and management of water distribution systems (WDNs). Resolving leakage typically involves detection and localization of the event, which can be performed in various ways. Recently, there has been a considerable effort to detect and localize leaks based on data-driven analysis [1,2]. However, data-driven analysis suffers from some limitations, such as a lack of sufficient data, and difficulties and uncertainties imposed on unexperienced events. Another well-known approach is simulation-based analysis. In this case, still, the data are important in calibrating and validating the simulation model, but there is a better chance to overcome uncertainty issues here.
Addressing leakage often involves detecting and localizing leaks using hydraulic models [3,4] assuming their full calibration and accuracy. Conversely, calibrating hydraulic models, particularly regarding demand and pipe roughness coefficients (PRCs), typically assumes the absence of leakage within the system. However, these two problems—leakage detection and model calibration—depend on each other’s fulfillment, complicating their resolution. Therefore, a critical need arises for a modeling framework capable of simultaneously estimating PRCs and detecting pipe leakage.
This study presents a novel approach to address this challenge by introducing a real-time leakage detection model through PRC estimation using the observed hydraulic state. The central hypothesis is that the presence of leaks will induce fluctuations in estimated PRCs as pipe flow changes due to the altered behavior of leaking pipes in energy dissipation. The proposed model consists of two distinct algorithms: (1) PRC estimation using a Markov Chain Monte Carlo (MCMC) algorithm, and (2) a leakage detection algorithm employing a Kolmogorov–Smirnov (KS) test.

2. Methods

2.1. MCMC-Statistical Distance Model

An algorithm utilizing MCMC-Statistical Distance was introduced to estimate the PRC and detect leaks while determining their locations, as illustrated in Figure 1.
In the first step, MCMC explores parameters and approximates the posterior distribution using Monte Carlo methods to assess parameter uncertainty. This involves constructing a Markov Chain, where current estimations depend only on past ones, employing Monte Carlo simulations to randomly select variables from the updated posterior distribution of the current time. MCMC is utilized to derive parameter posterior distributions in Bayesian inference scenarios. Specifically, in Bayesian analysis, the parameter of interest (denoted as θ) is represented by the prior distribution P(θ), and the collected data are summarized through the likelihood function P(x∣θ). Through MCMC sampling, the posterior distribution of parameters is sampled based on prior distributions and likelihood functions. Common computational algorithms in MCMC include Metropolis–Hastings (MH) sampling and Gibbs sampling.
In the second step, statistical distance, specifically the Kolmogorov–Smirnov (KS) test, was employed to identify leaks. Statistical distances quantify the difference between two statistical objects, such as probability distributions. The KS test measures the discrepancy between probability measures, making it suitable for detecting leaks in the context of this study.

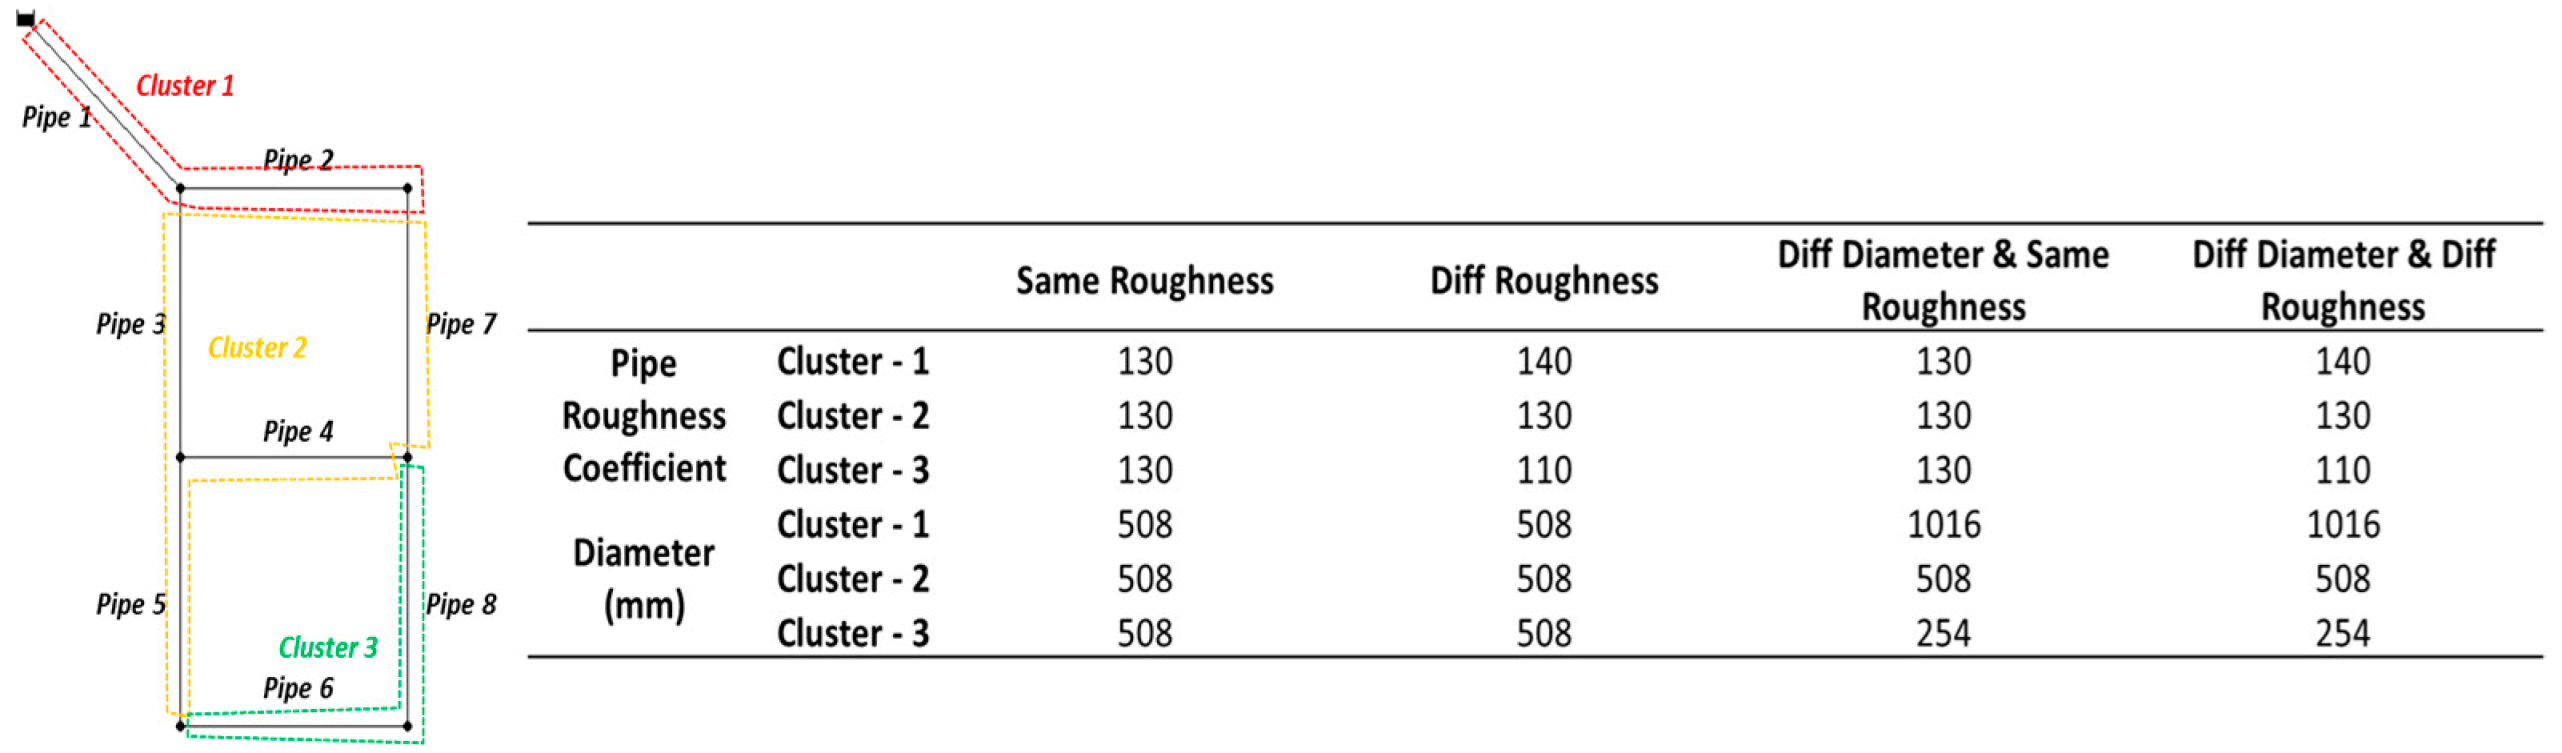
2.2. Study Network and Scenarios

Figure 2 illustrates the study network and PRC scenarios used for demonstration purposes. The network comprises 2 loops with 8 pipes and 6 demand nodes, with a total demand of 311.11 LPS supplied from a gravity-fed reservoir. The length of all pipes is 1000 m, but diameters and PRCs are set differently as depicted in this figure.
For demonstration purposes, the initial prior for each PRC cluster is assumed to follow a uniform distribution within the range of 50 to 250. The likelihood function is computed by evaluating the error between the observed pressure data and the expected values. In this study, only pressure data from demand nodes equipped with pressure sensors were used. The measurement uncertainty was assumed to be 1% of the expected value.
In the final step, acceptance and rejection of the prior are determined using the Metropolis–Hastings (MH) algorithm with probability α, defined as
α θ t + 1 , θ t = m i n p x θ t + 1 p x θ t π θ t + 1 π θ t q θ t θ t + 1 q θ t + 1 θ t , 1
where p · · is the likelihood function for observing the data set x with parameter set θ (PRC), π · is the prior distribution of parameter set θ , q · · is the candidate-generating function representing the probability of moving from θ t + 1 to θ t , and π · is 1 if all parameter sets of θ are within the maximum and minimum boundaries.
For the MCMC process, a total iteration of 50,000 for each leakage event was considered, with 10% considered as burn-in. The delta for PRC prediction varies from 0.1 to 0.01 as the iteration proceeds.

3. Results

Table 1 provides an overview of the PRC estimation results without leakage across all scenarios. The model consistently predicts true PRC values (comparing R_Avg with values in Figure 2), with lower standard deviations (R_Std). As part of the validation process, correlation analysis (Pearson Correlation Coefficient, PCC; and Spearman’s Rank correlation coefficient, Rho) was conducted with PRC accuracy represented by the standard deviation and unit headloss. Despite varying correlations ranging from −0.86 to −0.98 for PCC and −0.5 to −1 for Rho, the PRC results demonstrate sensitivity to pipes with higher headloss.
Table 2 summarizes the PRC estimation results and Kolmogorov–Smirnov statistics for different leak locations. Higher leak sizes correspond to larger differences in PRC estimation, indicating a signal for leakage. Upon detecting differences between estimated and true PRCs, the model proceeds to the second phase. The statistical significance (stat) and p-value results are also presented in Table 2. Notably, the EM10 leak size exhibits a p-value of 0, indicating distinguishable distributions, while only pipes 3 to 8 may be detected for EM1 leak size. Nevertheless, the model successfully identifies leaks while calibrating the hydraulic model.

4. Summary

This study presents a promising application of PRC estimation for real-time WDN leakage detection. The proposed model, comprising PRC estimation using an MCMC algorithm and a leakage detection algorithm employing a KS test, demonstrates effectiveness in simple network applications, showcasing how estimated PRCs change with leak characteristics. This innovative approach marks a significant advancement in the field, offering a solution to the intertwined challenges of leakage detection and hydraulic model calibration in WDNs. Further development is warranted to enhance the model’s capabilities with additional data and scenarios, potentially incorporating leak localization for improved utility.

Author Contributions

Conceptualization, G.S. and S.L. (Seungyub Lee); methodology, G.S.; software, S.L. (Seungyub Lee); validation, G.S., S.L. (Seungyub Lee) and S.H.K.; formal analysis, G.S.; investigation, S.L. (Suhyun Lim); resources, S.L. (Seungyub Lee); writing—review and editing, G.S.; visualization, G.S.; supervision, S.L. (Seungyub Lee); project administration, G.S.; funding acquisition, S.L. (Seungyub Lee). All authors have read and agreed to the published version of the manuscript.

Funding

This research was funded by the National Research Foundation of Korea (NRF) grant funded by the Republic of Korea government (No. NRF-2021R1C1C2004896).

Institutional Review Board Statement

Not applicable.

Informed Consent Statement

Not applicable.

Data Availability Statement

All data, models, and codes supporting the finding of this study are available from the corresponding author upon reasonable request.

Conflicts of Interest

The authors declare no conflicts of interest.

References

  1. Puust, R.; Kapelan, Z.; Savic, D.A.; Koppel, T. A Review of Methods for Leakage Management in Pipe Networks. Urban Water J. 2010, 7, 25–45. [Google Scholar] [CrossRef]
  2. Hu, Z.; Chen, B.; Chen, W.; Tan, D.; Shen, D. Review of Model-based and Data-driven Approaches for Leak Detection and Location in Water Distribution Systems. Water Suppl. 2021, 21, 3282–3306. [Google Scholar] [CrossRef]
  3. Jensen, H.A.; Jerez, D. A Bayesian Model Updating Approach for Detection-related Problems in Water Distribution Networks. Reliab. Eng. Syst. Saf. 2019, 185, 100–112. [Google Scholar] [CrossRef]
  4. Vrachimis, S.G.; Timotheou, S.; Eliades, D.G.; Polycarpou, M.M. Leakage Detection and Localization in Water Distribution Systems: A Model Invalidation Approach. Control. Eng. Pract. 2021, 110, 104755. [Google Scholar] [CrossRef]
Figure 1. Roughness estimation and leakage identification/localization work flow.
Engproc 69 00105 g001
Figure 2. Study network and pipe roughness coefficient scenarios.
Engproc 69 00105 g002
Table 1. Summary of pipe roughness coefficient estimation results.
Same D, Same RSame D, Diff RDiff D, Same RDiff D, Diff R
1 Cluster3 Cluster3 Cluster3 Cluster3 Cluster
R_AvgCluster—1130.00130.01140.01130.53139.76
Cluster—2 129.81129.82129.95130.06
Cluster—3 132.67111.75130.01110.00
R_StdCluster—10.060.130.162.993.86
Cluster—2 0.790.830.590.61
Cluster—3 5.624.130.630.38
Unit HLCluster—1 4.804.210.180.15
Cluster—2 2.062.052.232.24
Cluster—3 0.240.282.733.7
Table 2. Summary of pipe roughness coefficient estimation results and Kolmogorov–Smirnov statistical results for different emitter coefficients (same diameter and same roughness cases).
EM1EM10
Leak Size (LPS)PRC Avg (std)Statp-valueLeak Size (LPS)PRC Avg (std)Statp-value
Pipe 15.31129.12 (0.06)0.00600.9952.25121.59 (0.05)0.04240.00
Pipe 27.10127.48 (0.05)0.01700.1169.54108.62 (0.03)0.10780.00
Pipe 37.26127.34 (0.05)0.01800.0871.11107.68 (0.03)0.11250.00
Pipe 47.21127.04 (0.05)0.01990.0470.49105.83 (0.03)0.12190.00
Pipe 56.66127.22 (0.05)0.01880.0664.92107.08 (0.03)0.11550.00
Pipe 66.46127.24 (0.05)0.01860.0662.84107.29 (0.03)0.11450.00
Pipe 77.05127.19 (0.05)0.01910.0568.89106.76 (0.03)0.11720.00
Pipe 87.02127.05 (0.05)0.01990.0468.52105.92 (0.03)0.12140.00
Disclaimer/Publisher’s Note: The statements, opinions and data contained in all publications are solely those of the individual author(s) and contributor(s) and not of MDPI and/or the editor(s). MDPI and/or the editor(s) disclaim responsibility for any injury to people or property resulting from any ideas, methods, instructions or products referred to in the content.

