Abstract
So far, many researchers have attempted to tackle issues associated with intermittent water supply (IWS) systems, such as the inequitable distribution of water, by employing deterministic models that rely on multiple assumptions about input parameters. However, owing to the diverse practices and operations associated with IWS systems, significant uncertainty prevails in various aspects, including user water consumption, supply characteristics, and household tank sizes. In this work, a novel uncertainty quantification framework for assessing uncertain model input parameters is proposed.
1. Introduction
Hydraulic modelling of IWS systems is a crucial step in analysing and addressing the problems that arise. It has been used for the design, improvement of equitable supply, conversion to continuous supply, and rehabilitation of IWS systems. In all these applications where the IWS network model is used to support decision making, understanding the relative magnitude of risk and uncertainty is critical to accurately assessing system behaviour. To simulate realistic scenarios, develop and validate model-based methodologies, and make informed decisions, it is important to better understand the similarities and differences between various IWSs and their operating modes. To develop more representative models, the first step is to analyse all factors affecting the quantity of water a consumer receives over time, and the second step is to integrate uncertainties that arise for each case into the modelling processes. Failure to account for uncertainty can lead to incorrect conclusions, which underscores the importance of a thorough analysis that takes into account the various uncertainties. In short, the accurate determination of the network model’s parameters and the consideration of their uncertainty are essential components of developing reliable and effective solutions.
To the best of the authors’ knowledge, there have been few attempts to address the diverse practices and analyse the unique characteristics of IWS systems through hydraulic modelling [1,2]. An issue arises with these modelling techniques, as they are unable to fully simulate the crucial processes of network filling and draining that dictate consumer supply access, and only a select set of uncertain parameters are examined under specific circumstances. A further limitation lies in the numerous simplifying assumptions made about consumer behaviour and the hydraulic model itself, which still awaits calibration and verification against real-world data.
IWS behaviour investigation with a suitable modelling approach in the context of uncertainty analysis is a relatively new research topic that this paper attempts to cover.
2. Uncertainty Quantification Framework
The proposed uncertainty quantification framework was adapted from [3]’s general probabilistic framework (GPF) for the uncertainty and global sensitivity analyses of deterministic models. In the initial phase, uncertainty analysis (UA), each uncertain parameter is characterised with probabilistic-based approaches (Section 2.1), and Monte Carlo simulations are used to investigate the impact of uncertain model input parameters on the network performance indicators (Section 2.2). In the second phase, a global sensitivity analysis (SA) (Section 2.3) is conducted to identify the primary sources of uncertainty impacting the simulation results and to identify the influential and non-influential parameters.
2.1. IWS Modelling with Uncertain Input Parameters
- The uncertainty in supply characteristics was characterised using probability distribution functions (PDFs). These PDFs were derived from the water supply schedules of Delhi, dated 12 May 2020 [4].
- The uncertainty in the household tank size was characterised by a truncated normal distribution considerin the IWS practices, with a mean value (µ) of 1.0 m3 and standard deviation (σ) of 0.8. Each realisation had the minimum tank size restricted to 0.2 m3, and the sampled tank sizes were rounded to 1 decimal place.
- For the time series of the water consumption from the household tank, several demand patterns were generated by employing Gaussian process (GP) emulators using a given hourly-based demand pattern to account for the correlation between successive demand multipliers.
2.2. Performance Indicators
Of the nine indicators described by [5], four key metrics were selected to assess the uncertainties in model outputs: indicator I1—the proportion of the number of effective hours a user is served; indicator I2—the proportion of the volume of water supplied to users; indicator I3—the level of pressures at consumption nodes; and indicator I4—the level of equity in the supply.
2.3. Global Sensitivity Analysis
Sobol’s method [6] was employed in this study to examine the influence of both individual uncertain parameters and their interactions on the model’s performance. The objective was to understand the behaviour of the network in response to the interactions between household water consumption, household tank size, and supply characteristics.
Utilising the Saltelli sequence, which is specifically designed for Sobol’s SA [7], 213 = 8192 samples were used. This led to a total of N × (2D + 2) = 65,536 simulations being executed to calculate the Sobol sensitivity indices (where N is the number of samples, and D is the number of uncertain input parameters, here, 3).
3. Results and Discussion
The proposed framework implementation was demonstrated by its application to an IWS network detailed in [8]. The EPA-SWMM-based IWS modelling approach was used for hydraulic simulation [9]. The simulation spanned 24 h for both SA and UA, covering a total of 12 scenarios split into two groups based on the household tank sizes at each node.
- 1.
- Same-sized household tank (SSHT) for each node: In this situation, each node was characterised by household tanks of the same size.
- 2.
- Different-sized household tanks (DSHT) for each node: In this situation, household tanks of different sizes were assigned to each node.
These scenarios were designed to examine two primary aspects: the reduction in the water supplied to the network and the variability in water demands met at the nodes. In this context, “demand” was defined as the average water consumption from the household tanks. Each scenario, amounting to 12 in total, was executed 65,536 times.
Table 1 outlines the scenario names and IDs, along with the alterations made to the water supplied in the network and to the demand values. Percentages represent the modification relative to the default value, where a “0” value indicates an assumption of no water consumption from the household tanks. A scenario with no water consumption does not reflect real-world conditions; however, it was included to investigate the interplay between uncertain parameters and to understand the system dynamics under hypothetical extreme conditions.

Table 1.
Scenarios for uncertainty and sensitivity analyses.
3.1. Uncertainty Analysis (UA)
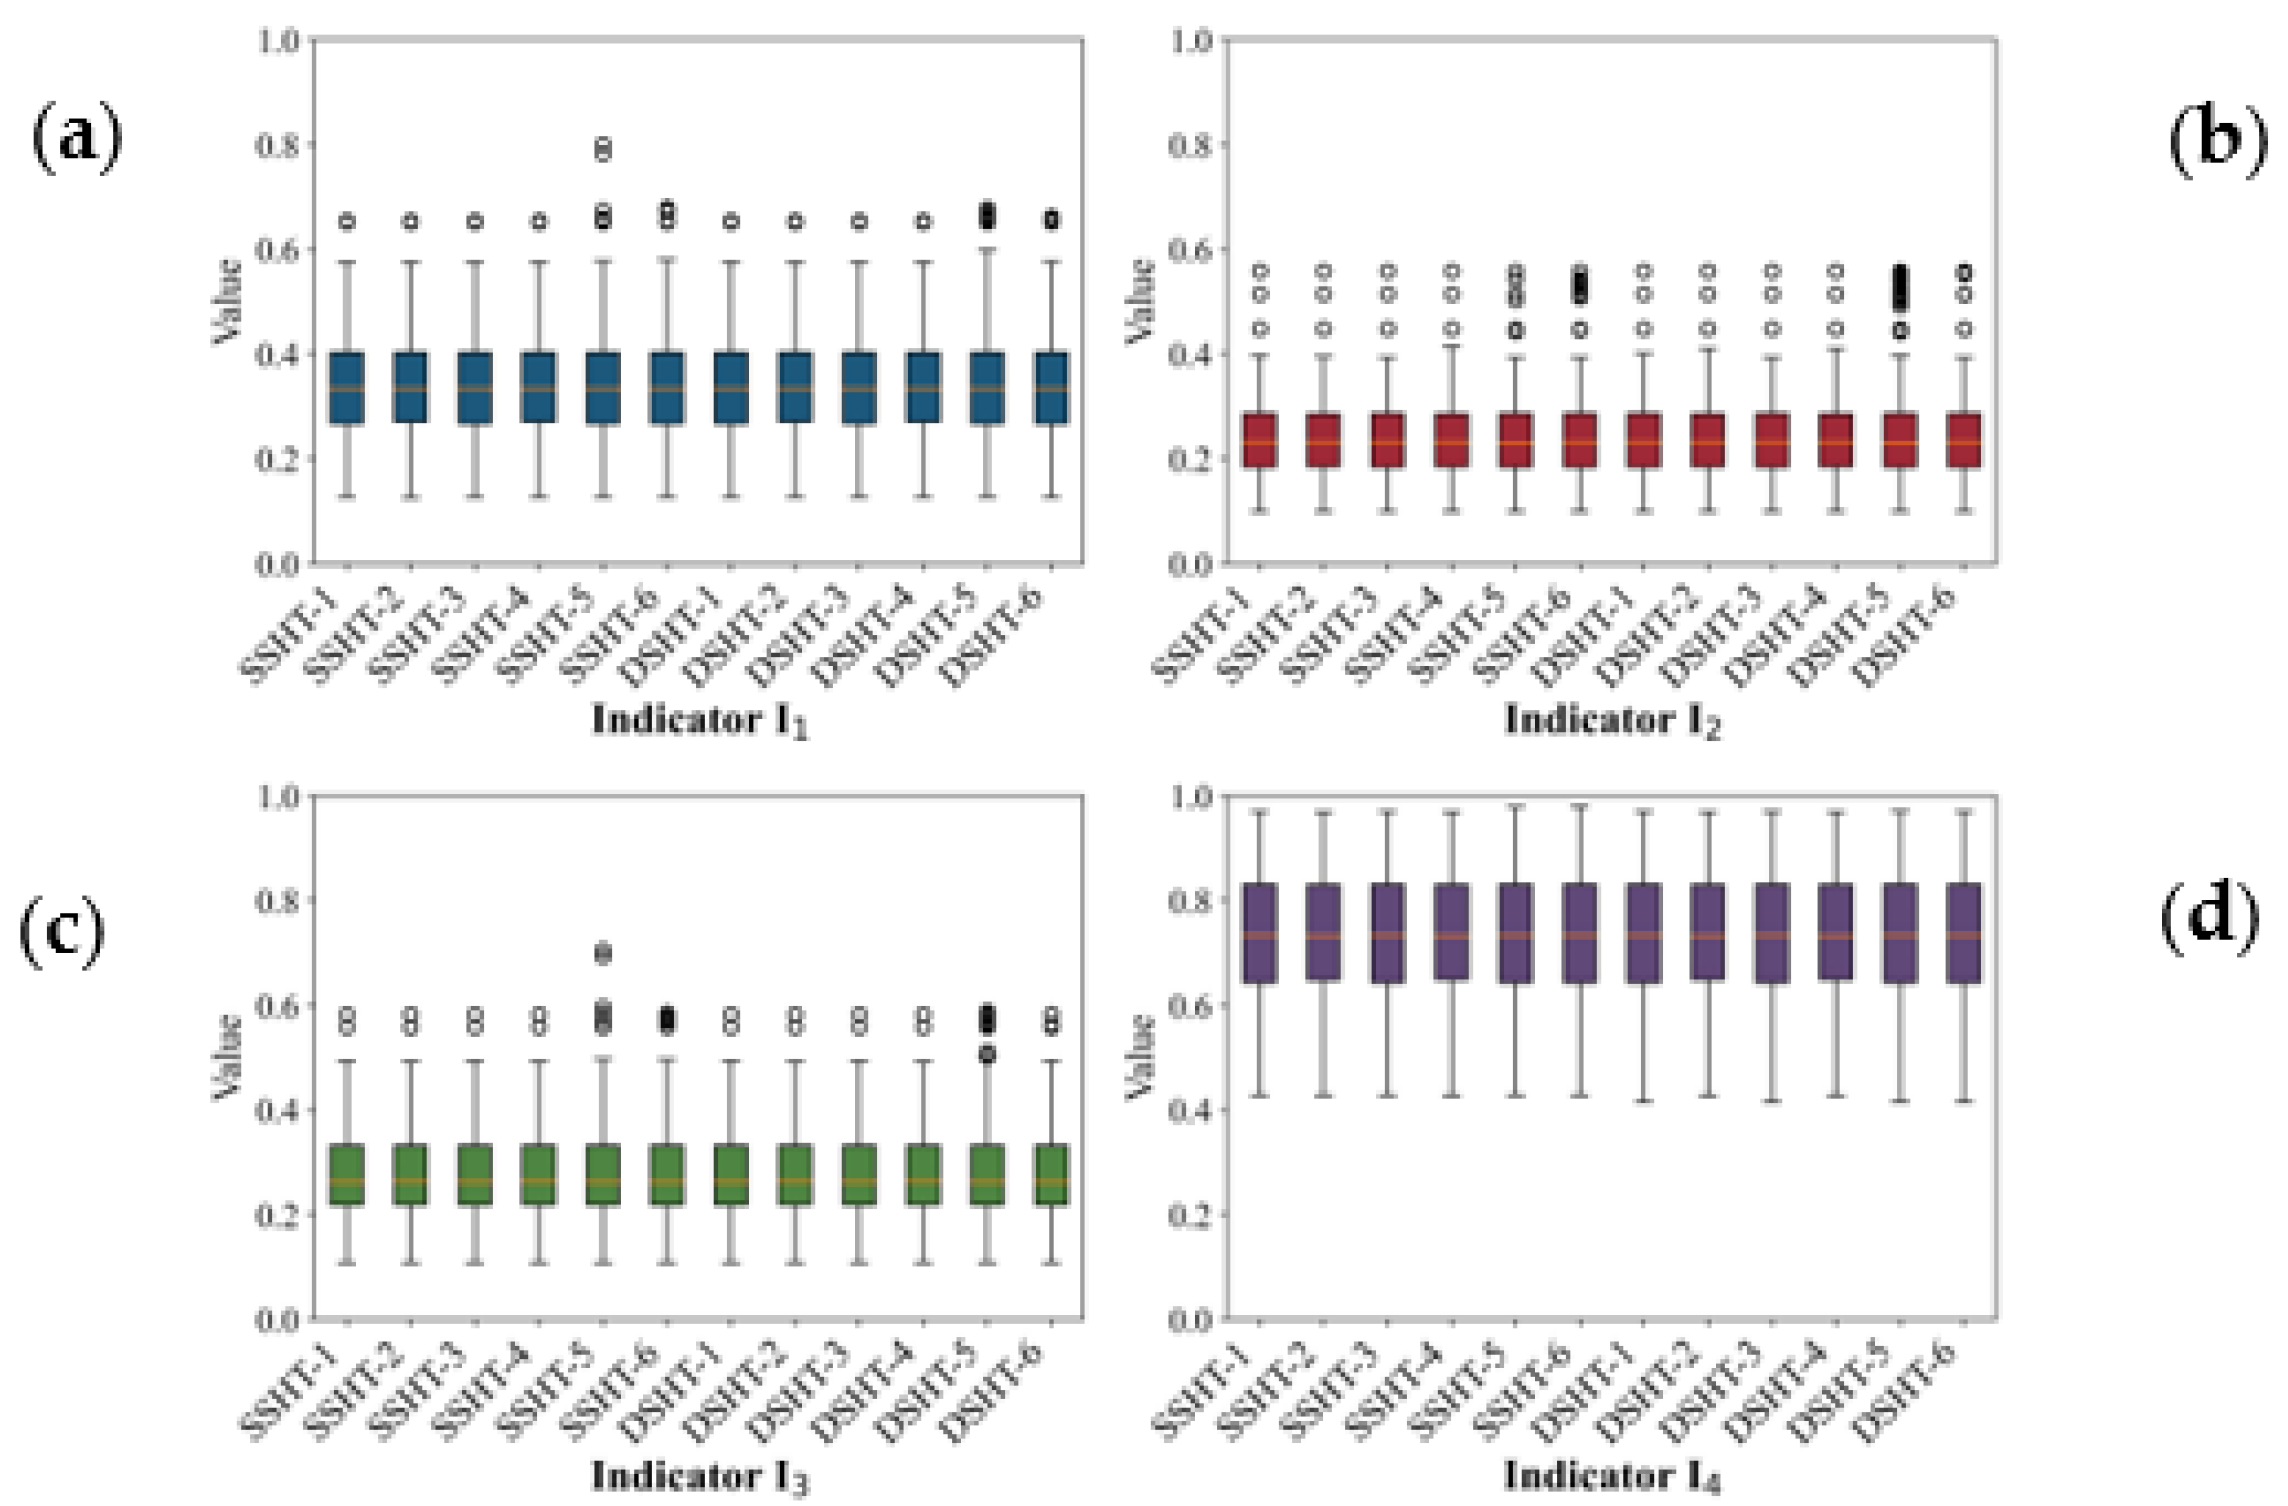
Figure 1 shows the variations in the performance indicators in the 12 scenarios to ascertain the overall uncertainty in the network’s performance. It can be seen from the figure that the scenarios themselves do not impose significant impacts on the network’s overall performance. I4 has the highest levels of uncertainty, with values above 0.4, which indicates a significant relationship with the uncertain input parameters.

Figure 1.
Boxplots illustrating the variability and central tendency of each indicator across 12 scenarios: (a) indicator I1, (b) indicator I2, (c) indicator I3, and (d) indicator I4. The boxes represent the interquartile ranges, encompassing the 25th–75th percentiles, and the horizontal line within each box marks the median (50th percentile).
3.2. Sensitivity Analysis (SA)
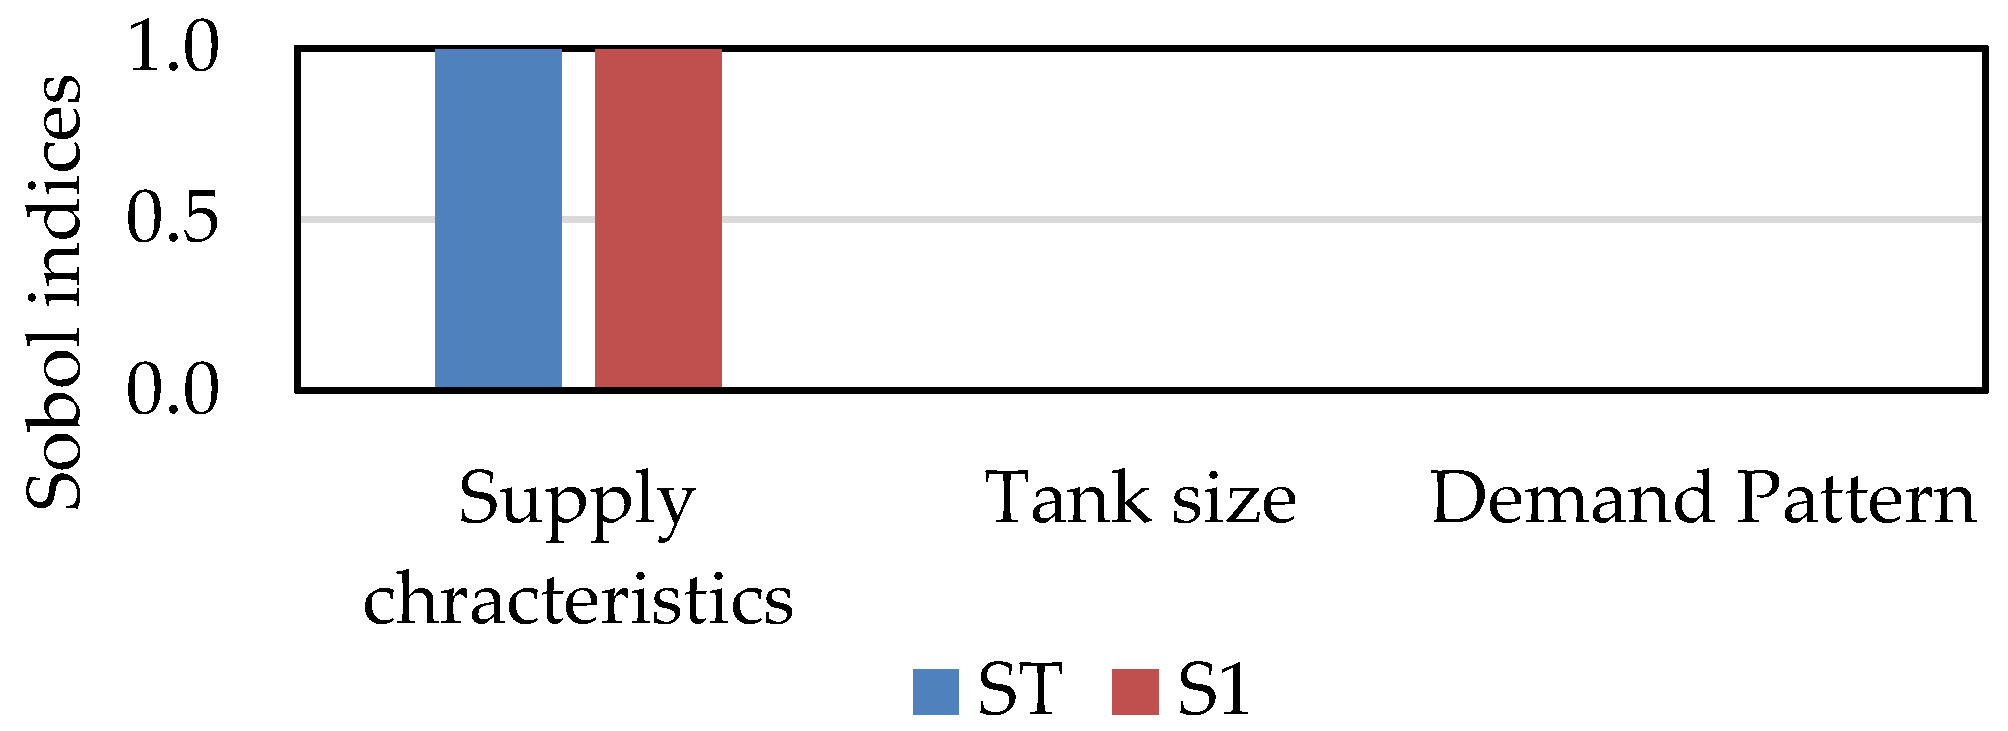
Figure 2 shows the Sobol indices for the base case scenario, SSHT-1, specifically for indicator I2. The figure clearly indicates that the most sensitive parameter affecting the model is the supply characteristics. This is primarily because the quantity of water delivered to the system is determined by the duration of the supply.

Figure 2.
First- and total-order Sobol indices of uncertain parameters in the base case scenario, SSHT-1, for indicator I2.
4. Conclusions
It is challenging to anticipate system performance without comprehensive field data, but uncertainty analysis helps reveal the system behaviour and leads towards modelling improvements. The performance indicators display variability under uncertainties, emphasising the necessity of incorporating uncertain input parameters into relevant decision-making processes. Further data collection is needed for more accurate modelling, particularly regarding supply characteristics.
Author Contributions
Conceptualisation, D.S., R.F. and F.A.M.; methodology, D.S., R.F. and F.A.M.; software, D.S.; validation, D.S.; formal analysis, D.S.; investigation, D.S.; resources, D.S.; data curation, D.S.; writing—original draft preparation, D.S.; writing—review and editing, D.S., R.F. and F.A.M.; visualisation, D.S.; supervision, R.F. and F.A.M.; project administration, D.S.; funding acquisition, D.S. All authors have read and agreed to the published version of the manuscript.
Funding
This research was funded by the Republic of Turkiye’s Ministry of National Education.
Institutional Review Board Statement
Not applicable.
Informed Consent Statement
Not applicable.
Data Availability Statement
The raw data supporting the conclusions of this article will be made available by the authors upon request.
Acknowledgments
Special thanks are due to Chao Zang for assisting with certain sections of the code and to Hossein Mohammadi and Richard Collins for their invaluable discussions.
Conflicts of Interest
The authors declare no conflicts of interest. The funders had no role in the design of this study; in the collection, analyses, or interpretation of the data; in the writing of this manuscript; or in the decision to publish the results.
References
- Abhijith, G.R.; Naidu, M.N.; Boindala, S.P.; Vasan, A.; Ostfeld, A. Analyzing the role of consumer behavior in coping with intermittent supply in water distribution systems. J. Hydroinform. 2022, 25, 1766–1787. [Google Scholar] [CrossRef]
- Randeniya, A.; Radhakrishnan, M.; Sirisena, T.A.J.G.; Maish, I.; Pathirana, A. Equity—Performance trade-off in water rationing regimes with domestic storage. Water Supply 2022, 22, 4781–4797. [Google Scholar] [CrossRef]
- Baroni, G.; Tarantola, S.A. General Probabilistic Framework for uncertainty and global sensitivity analysis of deterministic models: A hydrological case study. Environ. Model Softw. 2014, 51, 26–34. [Google Scholar] [CrossRef]
- Meyer, D.D.J.; Singh, S.; Singh, J.; Kumar, M.; He, M. Learning from intermittent water supply schedules: Visualizing equality, equity, and hydraulic capacity in Bengaluru and Delhi, India. Sci. Total Environ. 2023, 892, 164393. [Google Scholar] [CrossRef] [PubMed]
- WDSA. Battle of Intermittent Water Supply Instructions. In Proceedings of the 2nd WDSA/CCWI Joint Conference, Valencia, Spain, 18–22 July 2022. [Google Scholar]
- Soboĺ, I.M. Sensitivity estimates for nonlinear mathematical models. Math. Model. Comput. Exp. 1993, 1, 407–414. [Google Scholar]
- Saltelli, A. Sensitivity analysis for importance assessment. Risk Anal. 2002, 22, 579–590. [Google Scholar] [CrossRef] [PubMed]
- Campisano, A.; Gullotta, A.; Modica, C. Using EPA-SWMM to simulate intermittent water distribution systems. Urban Water J. 2019, 15, 925–933. [Google Scholar] [CrossRef]
- Sarisen, D.; Farmani, R.; Watkins, D.W.; Barkdoll, B.D.; Rivers, B.W.; Zhang, C.; Memon, F.A. Verifying an improved intermittent water distribution network analysis method based on EPA-SWMM. J. Hydroinform. 2024, jh2024254. [Google Scholar] [CrossRef]
Disclaimer/Publisher’s Note: The statements, opinions and data contained in all publications are solely those of the individual author(s) and contributor(s) and not of MDPI and/or the editor(s). MDPI and/or the editor(s) disclaim responsibility for any injury to people or property resulting from any ideas, methods, instructions or products referred to in the content. |
© 2024 by the authors. Licensee MDPI, Basel, Switzerland. This article is an open access article distributed under the terms and conditions of the Creative Commons Attribution (CC BY) license (https://creativecommons.org/licenses/by/4.0/).