Proceeding Paper

Combining Physical and Network Data for Attack Detection in Water Distribution Networks †

by
Côme Frappé - - Vialatoux
1,2,* and
Pierre Parrend
1,2
1
ICube—Laboratoire des Sciences de L’ingénieur, de L’informatique et de L’imagerie UMR 7357, Université de Strasbourg, 67000 Strasbourg, France
2
Laboratoire de Recherche de l’EPITA, EPITA, 94270 Le Kremlin-Bicêtre, France
*
Author to whom correspondence should be addressed.
Presented at the 3rd International Joint Conference on Water Distribution Systems Analysis & Computing and Control for the Water Industry (WDSA/CCWI 2024), Ferrara, Italy, 1–4 July 2024.
Eng. Proc. 2024, 69(1), 118; https://doi.org/10.3390/engproc2024069118
Published: 11 September 2024

Abstract

:
Water distribution infrastructures are increasingly incorporating the IoT in the form of sensing and computing power to improve control over the system and achieve greater adaptability to water demand. This evolution, from physical to cyber-physical systems, comes with an attack perimeter extended from physical infrastructure to cyberspace. Being able to detect this novel kind of attack is gaining traction in the scientific community. Machine learning detection algorithms, which are showing encouraging results in cybersecurity applications, are leveraging the increasing number of datasets published in the water distribution community for better attack detection. These datasets also begin to reflect this novel cyber-physical aspect in two ways, first by conducting cyberattacks against the testbed infrastructures during data acquisition, and secondly by including network traffic data along with the physical data captured during the experimentations. However, current machine learning models do not fully take into account this cyber-physical component, being only trained either on the physical or on the network data. This paper addresses this problem by providing a multi-layer approach to applying machine learning to cyber-physical systems, by combining physical and network traffic data and assessing their effects on the attack detection performance of machine learning algorithms, as well as the cross-impact with data enriched with graph metrics.

1. Introduction

The role of water distribution infrastructures in providing access to water is crucial to society, as it is both a vital need and among the most used resources in the industry. This importance places these infrastructures as part of the critical system family, which implies the highest level of resilience, security, and reliability. To meet these requirements, a modernization effort is being conducted on water distribution infrastructures in the vein of Industry 4.0, allowing for better monitoring, adaptability, and control over the system. This transformation effectively places water distribution infrastructures in the category of Cyber-Physical Systems (CPSs), in that they are composed of a physical layer dedicated to the handling of water and a cyber layer that supports the communication of the components of the physical layer. However, this increase in connectedness is expanding the attack perimeter of water distribution infrastructures significantly and exposes them to the threat of cyber-attacks [1]. These new threats motivate the need for more accurate detection models, for which Machine Learning (ML) algorithms have gained attention for their promising results. Still, the current use of ML algorithms for attack detection has yet to be adapted to the specific architecture of CPSs by integrating the physical and cyber layers [2]. Recent work from the literature introduces a combination method based on model aggregation [3]. However, while showing promising results, its reliance on numerous models in parallel implies a custom fit for the CPS architecture, as well as high computational costs.
This paper describes a general approach for combining the physical and network data of a CPS, allowing ML algorithms to be trained on data that capture the interactions between the multiple layers of the systems.
The remainder of the paper presents the combination approach and the experimental setup in Section 2, the results are reported in Section 3, and the discussion and conclusions are given in Section 4.

2. Materials and Methods

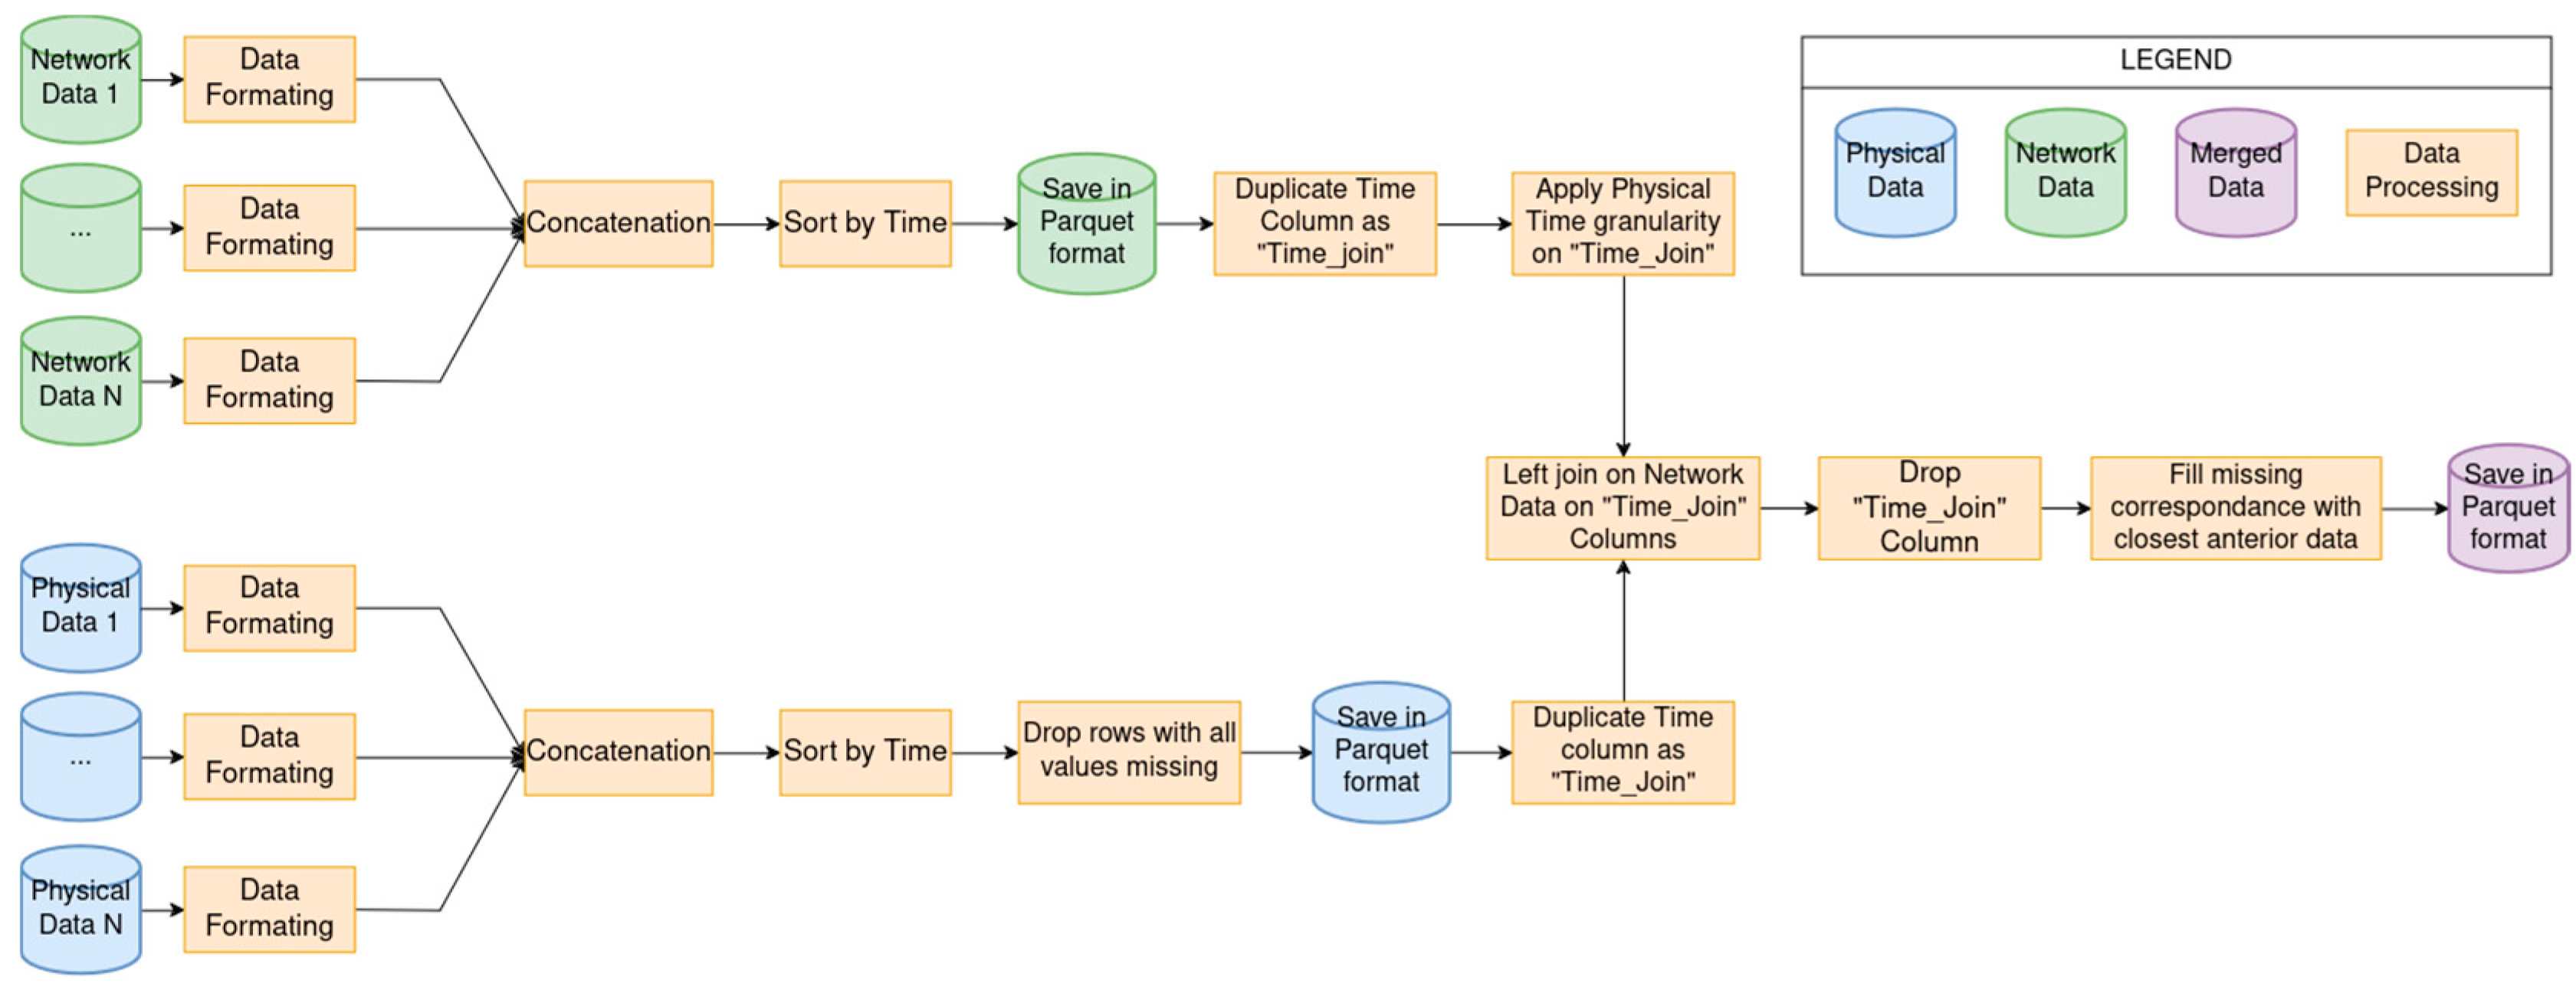
2.1. Data Combination Process

The combination process requires both the physical data and the network traffic data to obtain the time of acquisition, and these must be acquired during the same timeframe. As observed in CPS open datasets in the water distribution field, the physical data’s acquisition frequency is lower than that of the network data, usually with an acquisition each second versus acquisition at the millisecond scale for network data. To allow for the conjoint use of these data, a synchronization process is required, consisting of concatenating the most recent anterior physical data to each network data entry. The complete combination pipeline for static data is shown in Figure 1. The first step for both data types accounts for cases when the data are separated into multiple files. This step results in all network data as one file, and all physical data as another file, from which we remove lines with only missing values. The next step creates a common time column with an identical granularity for both files, corresponding to the physical data’s time granularity. This allows for a left join of the physical data onto the network data, based on this common time column that has just been created. This column is then removed, and the eventual network data that do not have physical data corresponding to their acquisition time are treated by filling with the most recent anterior physical data.

2.2. Experimental Setup

To assess the performance of the proposed combination, we benchmark the proposed process on the Hardware-In-The Loop (HITL) dataset [4]. This experiment consists of training 4 different machine learning algorithms, namely Decision Tree, Random Forest, XGBoost, and Multi-Layer Perceptron (MLP), respectively, on physical data, network data, network data enriched with graph metrics, and on the data obtained by applying the proposed combination. The graph metrics are computed on two graphs generated from network data, with edges representing communication between nodes consisting of MAC_Source and MAC_Destination for the first graph and the unique combinations of MAC_Source + Source_Port and MAC_Destination + Destination_Port for the second. These graphs are constructed over time windows of one and five minutes and used to compute the following metrics: number of edges, number of nodes, average degree, and density.
The hardware used to run the experiment is a laptop with 32Gb of RAM, 13th Gen Intel® Core™ i7-13700H 20 cores CPU, and NVIDIA RTX A500 GPU. The operating system is Ubuntu 22.04.3 LTS. Evaluations are run using Python 3.11.4 and the libraries pandas (2.0.2), numpy (1.25.1), scikit-learn (1.2.2), xgboost (1.7.6), and keras (2.13.1). As the available RAM is limited, network data are reduced in size by keeping only one instance of each unique packet at each second and adding the count of duplicates in a new column.

3. Results

The detection performance of the models shows a benefit associated with the use of the proposed data combination for all models except Random Forest.
The detection performance, using a balanced accuracy metric for each model on the different data configurations, is shown in Figure 2. The best results are obtained with the XGBoost algorithm on the combined data with 99.84% balanced accuracy. Table 1 shows that the addition of graph metrics to network data greatly improved the detection performances of Physical Fault and MITM, respectively, from 0% to 77% and from 1% to 88% of the True Positive Rate. However, it led to a decrease of 8.70% TPR in the detection of the Scan label on combined data. A possible explanation is that the addition of graph data adds less qualitative information for the detection of this specific label than the network data alone, thus diluting the useful information and resulting in a harder detection task. The overall improvement of detection performances also reflects on the False Positive Rate, as shown in Table 2, which is especially relevant in attack detection where false alarms have costs in terms of time and resources spent on irrelevant investigations, as well as the impact on personnel through the effect of alarm fatigue [5].

4. Discussion and Conclusions

The proposed approach for data combination improves the performances of machine learning models on the attack detection task in CPSs by having the training data capture the interactions between the physical and network subsystems. The addition of graph metrics to network data has a positive effect on performance compared to using network data without graph metrics; however, adding graph metrics to combined data lowered the detection performance. A possible explanation for this lowered detection performance is that graph metrics contain less qualitative information than the combined data alone, which makes the high-quality information more diluted in the data and thus harder for the models to learn. This work proves a promising approach for integrating the network and physical parts of a CPS for machine learning-based detection.

Author Contributions

Conceptualization, C.F.V. and P.P.; methodology, C.F.V. and P.P.; software, C.F.V.; validation, C.F.V. and P.P.; formal analysis, C.F.V.; investigation, C.F.V.; resources, P.P.; data curation, C.F.V.; writing—original draft preparation, C.F.V.; writing—review and editing, C.F.V. and P.P.; visualization, C.F.V.; supervision, P.P.; project administration, P.P.; funding acquisition, P.P. All authors have read and agreed to the published version of the manuscript.

Funding

This work is funded by French ANR under grant ANR-22-CE39-0010 for the Correau Project.

Institutional Review Board Statement

Not applicable.

Informed Consent Statement

Not applicable.

Data Availability Statement

No new data were created or analyzed in this study.

Conflicts of Interest

The authors declare no conflicts of interest.

References

  1. Tuptuk, N.; Hazell, P.; Watson, J.; Hailes, S. A Systematic Review of the State of Cyber-Security in Water Systems. Water 2021, 13, 81. [Google Scholar] [CrossRef]
  2. Ahmed Jamal, A.; Mustafa Majid, A.-A.; Konev, A.; Kosachenko, T.; Shelupanov, A. A Review on Security Analysis of Cyber Physical Systems Using Machine Learning. Mater. Today Proc. 2023, 80, 2302–2306. [Google Scholar] [CrossRef]
  3. Faramondi, L.; Flammini, F.; Guarino, S.; Setola, R. A Hybrid Behavior- and Bayesian Network-Based Framework for Cyber–Physical Anomaly Detection. Comput. Electr. Eng. 2023, 112, 108988. [Google Scholar] [CrossRef]
  4. Faramondi, L.; Flammini, F.; Guarino, S.; Setola, R. A Hardware-in-the-Loop Water Distribution Testbed Dataset for Cyber-Physical Security Testing. IEEE Access 2021, 9, 122385–122396. [Google Scholar] [CrossRef]
  5. Deb, S.; Claudio, D. Alarm Fatigue and Its Influence on Staff Performance. IIE Trans. Healthc. Syst. Eng. 2015, 5, 183–196. [Google Scholar] [CrossRef]
Figure 1. Complete pipeline of the combination process.
Engproc 69 00118 g001
Figure 2. Balanced Accuracy performance of models for all data configurations.
Engproc 69 00118 g002
Table 1. True Positive Rates of XGBoost.
DataModelTPR NormalTPR DoSTPR MITMTPR Physical FaultTPR Scan
PhysicalXGB99.21%96.88%88.56%95.48%0.00%
NetworkXGB99.90%97.50%1.41%0.01%100.00%
Network + GraphXGB98.04%99.51%88.69%77.43%87.50%
CombinedXGB99.91%99.94%99.74%99.62%100.00%
Combined + GraphXGB99.96%99.96%99.77%99.67%91.30%
Table 2. Per attack False Positive Rate of XGBoost.
DataModelFPR DoSFPR MITMFPR Physical FaultFPR Scan
PhysicalXGB0.031%0.505%0.164%0.000%
NetworkXGB0.066%0.043%0.000%0.000%
Network + GraphXGB0.011%0.755%0.984%0.000%
CombinedXGB0.003%0.036%0.036%0.000%
Combined + GraphXGB0.002%0.016%0.020%0.000%
Disclaimer/Publisher’s Note: The statements, opinions and data contained in all publications are solely those of the individual author(s) and contributor(s) and not of MDPI and/or the editor(s). MDPI and/or the editor(s) disclaim responsibility for any injury to people or property resulting from any ideas, methods, instructions or products referred to in the content.

