Abstract
Water distribution network (WDN) simulation models are usually classified as demand-driven or pressure-driven, depending on whether the demands are independent of or dependent on network pressures, respectively. In real-world networks, both types of demands coexist in the same building. This paper presents a hybrid modelling approach that combines volume-based and pressure-dependent demands in the same model, allowing for different pressure–demand relationships. This hybrid modelling approach is intended to produce more realistic results when modelling WDNs, and it was implemented in WaterNetGen, an EPANET extension.
1. Introduction
In water distribution network hydraulic models, the water demand is allocated to nodes. The nodal demand aggregates both pressure-independent (volume-based demand, such as filling bathing tubs, toilet tanks, washing machines, dishwashers, …) and pressure-dependent demands (leaks and pressure-dependent demand, such as washbasins, bidets, showers, kitchen sinks, …). Two approaches can be used to solve the steady-state hydraulic equations: demand-driven analysis (DDA) and pressure-driven analysis (PDA). In DDA, the nodal outflows are treated as fixed values; in PDA, the actual demand depends on the available pressure. DDA usually provides good precision when the WDN operates with enough pressure, while PDA is a more suitable approach to model insufficient pressure conditions (e.g., in a fire fighting scenario or a pipe break) or the impact of pressure changes on water demand (e.g., leakage modelling in pressure management projects).
The usual implementation of PDA uses Wagner et al.’s [1] Equation (1), which assumes that all the demand follows a power law with a certain exponent for the pressure–demand relationship (usually taken as 0.5—Torricelli’s law for orifices). As volume-based demand does not exhibit this behaviour, Wu et al. [2] proposed a new pressure-driven formulation that also includes volume-based demands, assuming that they are modelled as fixed nodal demands that are always met as in the conventional DDA. However, this approach only makes sense if the volume-based demands are located at the ground level, whereas the pressure-dependent demands can be located at higher elevations. However, this is not the case in common buildings, where both volume-based and pressure-dependent demands are usually located on different floors, above the ground level. Therefore, as pressure decreases, the volume-based demand should also decrease, although at a different rate than the pressure-dependent demands.
This paper presents a new approach by using a hybrid modelling method that combines DDA and PDA, including leakage and bursts and allows for assigning both volume-based and pressure-dependent demands to each node, following different pressure–demand relationships. This hybrid modelling approach was implemented in WaterNetGen [3], an EPANET extension. The EPANET node category list was adapted to support the demand classification, and the link object properties were extended to support the pipe leakage and bursts. The results from this hybrid approach are illustrated with an example.
2. Materials and Methods
EPANET 2.0 software is a worldwide open-source software used for WDN simulation. It computes the nodal hydraulic head considering that the water demand assumes fixed and known values that are assigned to the nodes; that is, EPANET follows for the demand-driven approach. Muranho et al. extended EPANET software to deal with (optimised) network design [3], pressure-dependent demand and leakage modelling [4], as well as network reliability analysis [5,6], among other capabilities. This EPANET extension embeds a pressure–demand algorithm that computes the available demand (qavl) based on a pressure–demand relationship [1]:
The available demand—Equation (1)—is computed for each node i and considers the current nodal pressure (Pi) and the reference pressure (Pref) necessary to fully satisfy the required demand (qreq). Pmin is the pressure below which no water can be supplied, and α (typically α = 0.5) is the exponent of the pressure–demand relationship. The available demand is the required demand times the demand satisfaction ratio (DSR).
Leakage modelling follows the pressure–leakage relationship for each pipe [7]:
where qleak is the total leakage along pipe k; lk is the length of pipe k; αk and βk are parameters of the background leakage model; Ck and δk are parameters of the burst’s leakage model (classical orifice flow formulas); and Pk is the average pressure in pipe k computed as the average of the pressure values of its end nodes (see [4] for details).
Both pressure relationships are incorporated in WaterNetGen. The properties are added to the “Node object” to implement Equation (1); the demands (“Demand Categories”, in EPANET terminology) were classified as volume-based or pressure-dependent (with reference pressure, minimum pressure and exponent). For the leakage modelling, new properties are added to the “Pipe object” (in EPANET terminology) to implement Equation (2).
The incorporation of Equations (1) and (2) on the network solver algorithm has a side effect: sometimes, the solver does not converge [8]. Therefore, for this work, polynomial smoothing is applied on both ends of the DSR curve of Equation (1).
3. Results
The hybrid modelling approach is applied to a synthetic network generated by WaterNetGen. The network consists of 500 junctions, two reservoirs and 624 pipes. The network is supposed to supply a district of 25,000 inhabitants, with a per capita consumption of 200 (50 pressure-independent + 150 pressure-dependent) litres per day and has 10% of water losses through pipe leakage. Therefore, the network must supply 57.87 (=14.47 + 43.40) litres per second (LPS) for consumption plus 5.79 LPS for water losses, for a total of 63.66 LPS. The pressure-independent demand is equally divided by the network nodes (0.02894 LPS/node). The pressure-dependent demand (consumption and leakage) is assigned to nodes assuming that the inhabitants are equally distributed along the pipes. The pipes’ diameters were set by the WaterNetGen sizing process, so this network does not have pressure-deficient nodes. Figure 1 shows an example network.
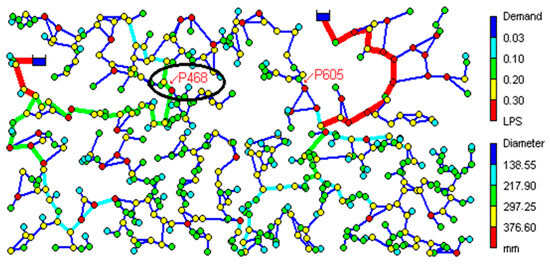
Figure 1.
Synthetic network with 500 junctions, 2 reservoirs and 624 pipes.
To illustrate the hybrid modelling approach, pipe P468 is closed (simulating a repair), and all flow is forced to pass through pipe P605. This leads to excessive flow velocities and insufficient pressures—see Figure 2 for the DDA (EPANET) modelling.
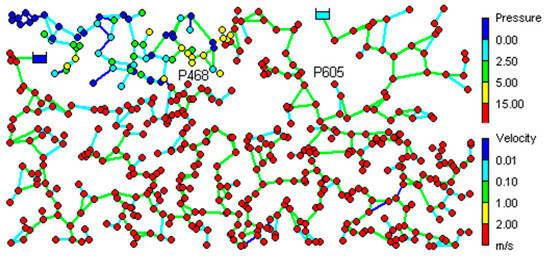
Figure 2.
Network map with negative pressures due to a pipe repair (pipe P468)—DDA.
In this scenario, EPANET results are not realistic. In WaterNetGen, the simple redefinition of the demand categories to be pressure-dependent leads to more realistic results, in which some nodes only receive a fraction of the required demand (light blue) or no water at all (dark blue)—see Figure 3.
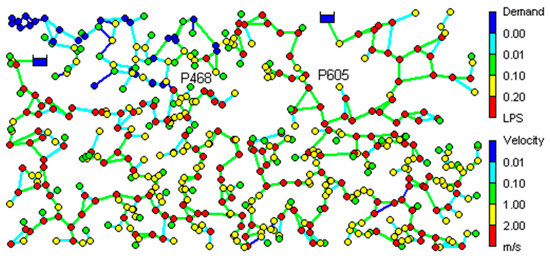
Figure 3.
Network map illustrating the demand distribution due to insufficient pressure-PDA. Dark blue nodes have zero demand satisfied.
Some water demands, e.g., toilet tanks, are volume-based and are more realistically modelled as such. Although this type of demand can be modelled by a suitable choice of parameters for Equation (1), for example setting α = 1.0, applying a demand-driven approach may be simpler or easier. The modelling of water leakage at pipe level—Equation (2)—is different: it always requires a pressure-driven approach for realistic results.
As seen, demand modelling may require various approaches even within the same model, where the nodal demand is computed based on distinct categories: some demand-driven and others pressure-driven. WaterNetGen can be used with any of these kinds of demands, expanding the modelling capabilities and producing more realistic results.
4. Conclusions
The nodal total demand is the sum of several demands, each one classified as pressure-independent or as pressure-dependent. Water losses should be modelled as the pressure-dependent demand model or by the pipe leakage model. The hybrid modelling presented here effectively integrates the two approaches. WaterNetGen supports multi-type demand categories. With this extension, EPANET users can continue to use this well-known tool and benefit from the new features introduced in this paper to produce more realistic modelling results.
Author Contributions
Conceptualization, methodology, validation and writing: J.M., J.S., A.F., A.S.-M. and A.G.; software: J.M. All authors have read and agreed to the published version of the manuscript.
Funding
This research was funded by the Portuguese Foundation for Science and Technology under the project grant UIDB/00308/2020, with the DOI 10.54499/UIDB/00308/2020.
Institutional Review Board Statement
This study did not require ethical approval.
Informed Consent Statement
Not applicable.
Data Availability Statement
Data are available by contacting the corresponding author.
Conflicts of Interest
The authors declare no conflicts of interest.
References
- Wagner, J.M.; Shamir, U.; Marks, D.H. Water distribution reliability—Simulation methods. J. Water Resour. Plan. Manag. 1988, 114, 276–294. [Google Scholar] [CrossRef]
- Wu, Z.Y.; Wang, R.H.; Walski, T.M.; Yang, S.Y.; Bowdler, D.; Baggett, C.C. Extended Global-Gradient Algorithm for pressure-dependent water distribution analysis. J. Water Resour. Plan. Manag. 2009, 135, 13–22. [Google Scholar] [CrossRef]
- Muranho, J.; Ferreira, A.; Sousa, J.; Gomes, A.; Sá Marques, A. WaterNetGen: An EPANET extension for automatic water distribution network models generation and pipe sizing. Water Sci. Technol. Water Supply 2012, 12, 117–123. [Google Scholar] [CrossRef]
- Muranho, J.; Ferreira, A.; Sousa, J.; Gomes, A.; Sá Marques, A. Pressure-dependent Demand and Leakage Modelling with an EPANET Extension—WaterNetGen. Procedia Eng. 2014, 89, 632–639. [Google Scholar] [CrossRef]
- Muranho, J.; Sousa, J.; Sá Marques, A.; Gomes, R. Water Distribution Network Reliability: Are Surrogate Measures Reliable? In Proceedings of the 13th International Hydroinformatics Conference, Palermo, Italy, 1–5 July 2018. [CrossRef]
- Sousa, J.; Muranho, J.; Bonora, M.A.; Maiolo, M. Why aren’t surrogate reliability indices so reliable? Can they be improved. In Proceedings of the 2nd International Joint Conference on Water Distribution Systems Analysis & Computing and Control in the Water Industry (WDSA/CCWI), Valencia, Spain, 18–22 July 2022. [Google Scholar] [CrossRef]
- Germanopoulos, G. A technical note on the inclusion of pressure dependent demand and leakage terms in water supply network models. Civ. Eng. Syst. 1985, 2, 171–179. [Google Scholar] [CrossRef]
- Muranho, J.; Ferreira, A.; Sousa, J.; Gomes, A.; Sá Marques, A. Pressure-Driven Simulation of Water Distribution Networks: Searching for Numerical Stability. In Proceedings of the 4th EWaS International Conference: Valuing the Water, Carbon, Ecological Footprints of Human Activities, Corfu, Greece, 24–27 June 2020. [Google Scholar] [CrossRef]


Disclaimer/Publisher’s Note: The statements, opinions and data contained in all publications are solely those of the individual author(s) and contributor(s) and not of MDPI and/or the editor(s). MDPI and/or the editor(s) disclaim responsibility for any injury to people or property resulting from any ideas, methods, instructions or products referred to in the content. |
© 2024 by the authors. Licensee MDPI, Basel, Switzerland. This article is an open access article distributed under the terms and conditions of the Creative Commons Attribution (CC BY) license (https://creativecommons.org/licenses/by/4.0/).