Abstract
In this study, a new methodology based on performance indices is presented to carry out a detailed energy audit of water systems. Given a water network, the proposed procedure allows for a direct assessment of the critical areas in terms of energy efficiency, as well as for a detailed quantification of the energy benefits resulting from the new management strategies proposed to increase the sustainability of the network. To verify the viability of the methodology, a pressure control strategy is proposed, based on the installation of pressure-reducing valves, containing the excess pressure and thus the water leakage within the system. The operation strategy is carefully designed by the use of a global optimization solver, searching for both the number and location of the devices in order to maximize water savings and minimize the investment cost. The energy benefits resulting from the pressure control are then investigated by the assessment of the performance indices. According to the obtained results, the proposed methodology is a useful tool to assess the vulnerability and inefficiency of a given network, as well as to quantify the benefits resulting from the new management strategies.
1. Introduction
In the last decades, several strategies have been presented in the literature with the aim of increasing the sustainability of water networks. Most of the proposed interventions rely on the use of hydraulic devices, such as pressure-reducing valves (PRVs) or pumps as turbines (PATs), in order to contain the amount of leaked water and to save energy [1]. According to recent investigations [2], the careful scheduling of pumping systems operations can result in significant containment of the energy consumption and all the operational costs related to the water supply and distribution.
Despite the large number of indices proposed in the literature to assess the performance of water networks, only a limited number of investigations accounts for the energy efficiency of the systems [3]. In a recent work [4], the authors developed a new methodology based on a set of global indices to carry out a detailed energy audit of water networks and quantify the benefits resulting from different management strategies.
In this study, a new methodology based on a local formulation of performance indices is provided in order to carry out an intensive and more detailed assessment of water networks in terms of energy efficiency. Based on the evaluation of these indices, new strategies can be proposed with the aim of increasing the sustainability of the whole system. In this work, the network operation based on the installation of PRVs is presented as pressure control strategy and properly designed by means of a deterministic optimization. The total gain in terms of energy efficiency is finally quantified by the aid of the global performance indices.
2. Materials and Methods
2.1. The Performance Indices
With reference to a water network, a global power balance can be written, equalizing the hydraulic power supplied to the network from both the source () and pumping systems () to the total power distributed to the end-users, as well as the power dissipated due to both friction losses () and any installed dissipation points, such as valves () and PATs (). The power distributed to the end-users depends on the available power at the nodes, which can be expressed as the sum of a minimum required and an excess pressure. Moreover, apart from the water demand from the end-users, the total water request also consists of the leakage flow rate related to the minimum ideal pressure and the leakage flow rate determined by the excess pressure head. In [4], all terms of the balance were divided by the minimum required power () obtaining the following global expression:
where and represent the rate of the power supplied by the source and pumping systems, respectively, with respect to the minimum required power, whereas , , and are the portion of the total power dissipated by friction losses, valves, and turbines, respectively, with respect to the minimum required power. Moreover, the index depends on the total power absorbed by water leakage due to the minimum pressure; is related to the total power absorbed by the users’ demand in the presence of an excess pressure; . depends on the total power absorbed by the minimum leakage when an excess pressure occurs; and is instead related to the total power absorbed by the excess leakage in the presence of an excess pressure. From here on, the term () is named as
and represents the rate of total delivered power with respect to the minimum required, whereas the quantity () is the named as and represents the excess of the total delivered power with respect to the minimum required power. A detailed and more exhaustive analysis of the indices is provided in [1]. Instead of integrating the expression of the distributed power terms over the whole system, a local formulation of such distribution indices with respect to each node of the network is proposed in this study in order to perform an intensive assessment of the energy efficiency and analyze the vulnerability of the system in detail.
2.2. The Case Study
The case study is a literature synthetic network consisting of 22 nodes, 37 links, and three reservoirs, with a head equal to 56 m [1].
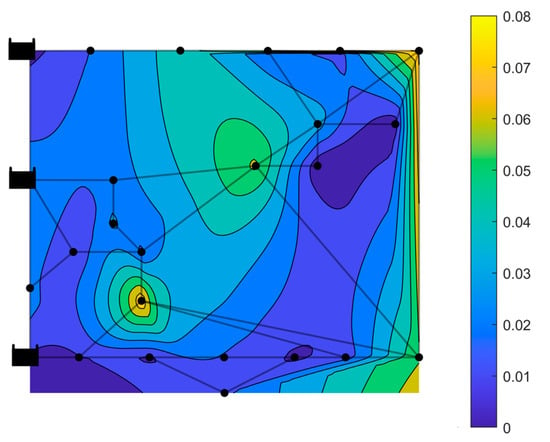
It is worth considering that, instead of evaluating the global values of indices as integrals over all the nodes of the network, a spatial distribution of the local values of is proposed, in order to identify the most critical part of the network in terms of energy efficiency. According to the intensive distribution of within the network shown in Figure 1, the excess power at the nodes with respect to the minimum required varies up to 8%. High values of are registered, commencing from the upstream part of the network, where the installation of dissipation points could be crucial to dissipate the excess pressure in the whole downstream network. Nevertheless, the exact position of devices within the system should be investigated by performing an optimization procedure with the aim of maximizing the water savings, as explained in Section 3.

Figure 1.
Spatial distribution of within the network in presence of excess pressure.
3. Results and Discussion
Among the different management strategies that could be proposed to keep the pressure in the whole system under control, in this study, the installation of PRVs is proposed. Such a strategy is properly designed, implementing an optimization procedure based on a deterministic approach. Since the optimization has been carried out by the use of a global optimization solver, the achieved solution is the absolute optimum of the problem. More details about the performed strategy can be found in [1].
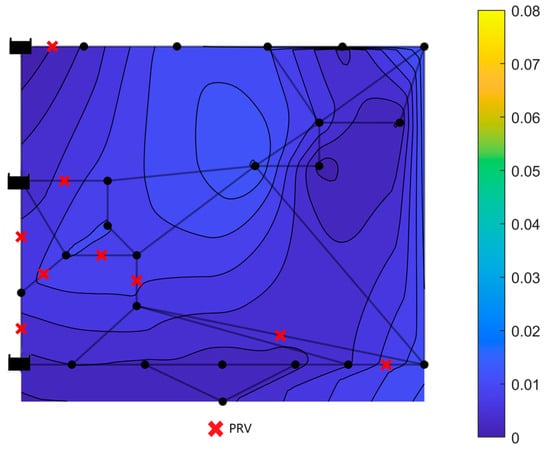
Figure 2 shows the spatial distribution of the index resulting from the pressure control strategy. Compared to the distribution presented in Figure 1, the index exhibits values smaller than 0.01 in the whole network, meaning that the excess power at the nodes with respect to the minimum required is below 1%. According to the optimal location, most of the devices are installed in the initial part of the network, resulting in lower values of pressure and thus a leakage in the whole downstream system.

Figure 2.
Spatial distribution of within the network once a pressure control management is performed by means of PRVs.
Table 1 shows the performance indices resulting from two different operating conditions. With reference to this table, Scenario 0 refers to the configuration without any installed devices. The power dissipated by the valves is equal to 26.4% of the minimum required power, according to the value of . Aside from , which does not depend on the hydraulic operation of the network, all the indices vary according to the considered scenarios. With regard to performing a pressure control strategy, the power absorbed by the water demand in presence of an excess pressure decreases from 35.6% (in Scenario 0) to 4.4% of the minimum required power. According to , performing a pressure control strategy, only 0.5% of the minimum required power is due to the minimum leakage in the presence of an excess pressure. Moreover, with reference to , the percentage of minimum required power that is absorbed by the excess leakage in the presence of an excess pressure decreases from 10.4% (in Scenario 0) to 0.90% (in Scenario I).

Table 1.
Values of performance indicators for different operation scenarios.
On the whole, the installation of PRVs is an effective management strategy, as it results in a total delivered power exceeding the minimum required power of 17.5% (against 61.7% in Scenario 0).
4. Conclusions
This work proposes a spatial analysis of new performance indices, enabling a direct identification and quantification of the most critical parts of a given network affected by low energy efficiency. In addition, the presented methodology allows for a detailed energy audit in order to assess the benefits resulting from the different management strategies performed on a water distribution network. In this study, the benefits resulting from a pressure management strategy based on PRVs are quantified by means of the global performance indices. According to the results, the total delivered power exceeding the minimum requirement decreases from 61.7% to 17.5%.
Future developments will regard the use of the proposed methodology to carry out a detailed energy audit in a real case study network and choose, among the different management solutions, the most effective strategy to increase the sustainability of the network.
Author Contributions
Conceptualization, M.C.M., A.C. and O.F.; methodology, M.C.M., A.C. and O.F.; software, M.C.M. and R.M.; formal analysis, O.F. and R.M.; investigation, M.C.M. and R.M.; resources, A.C.; data curation, M.C.M., A.C., O.F. and R.M.; writing—original draft preparation, M.C.M., A.C., O.F. and R.M.; writing—review and editing, M.C.M., A.C., O.F. and R.M.; visualization, M.C.M., A.C., O.F. and R.M.; supervision, A.C. and O.F.; project administration, A.C.; funding acquisition, A.C. All authors have read and agreed to the published version of the manuscript.
Funding
This work is supported by the “Network 4 Energy Sustainable Transition—NEST” project (MUR project code PE000021, Concession Decree No. 1561 of 11.10.2022), in the framework of the NextGenerationEu PNRR plan (CUP E63C22002160007).
Institutional Review Board Statement
Not applicable.
Informed Consent Statement
Not applicable.
Data Availability Statement
Dataset available on request from the authors.
Conflicts of Interest
The authors declare no conflicts of interest.
References
- Morani, M.C.; Carravetta, A.; D’Ambrosio, C.; Fecarotta, O. A new mixed integer non-linear programming model for optimal PAT and PRV location in water distribution networks. Urban Water J. 2021, 18, 394–409. [Google Scholar] [CrossRef]
- Zhang, L.; Wang, X.; Wu, P.; Huang, B.; Wu, D. Optimization of a centrifugal pump to improve hydraulic efficiency and reduce hydro-induced vibration. Energy 2023, 268, 126677. [Google Scholar] [CrossRef]
- Cabrera, E.; Pardo, M.A.; Cobacho, R.; Cabrera, E.J. Energy Audit of Water Networks. J. Water Resour. Plan. Manag. 2010, 136, 669–677. [Google Scholar] [CrossRef]
- Morani, M.C.; Carravetta, A.; Fecarotta, O.; Montillo, R. Detailed Audit of the Energy Efficiency in Water Systems: New Performance Indices. Water Resour. Manag. 2024, 38, 1241–1260. [Google Scholar] [CrossRef]
Disclaimer/Publisher’s Note: The statements, opinions and data contained in all publications are solely those of the individual author(s) and contributor(s) and not of MDPI and/or the editor(s). MDPI and/or the editor(s) disclaim responsibility for any injury to people or property resulting from any ideas, methods, instructions or products referred to in the content. |
© 2024 by the authors. Licensee MDPI, Basel, Switzerland. This article is an open access article distributed under the terms and conditions of the Creative Commons Attribution (CC BY) license (https://creativecommons.org/licenses/by/4.0/).