Abstract
A method for a real-time now- and forecasting hydraulic and quality simulation model for combined sewer networks, based on an enhanced version of the Storm Water Management Model (SWMM) simulator, with added support for storing the hot start file at any time during the simulation, the rotational speed control of the pumps, multiple dry weather flows with unique patterns, and improvements for quality simulations over control devices is presented. The methodology is applied in the combined sewer network of Helsinki, Finland. The model includes all pipes and dry weather flows, including the pollutants, catchment hydrology, infiltration, snowpacks, and other climate aspects.
1. Introduction
The use of real-time nowcasting and forecasting hydraulic models—or digital twins—is becoming more common. While more established on the water supply system side [], there have been several reported cases for combined sewer modeling in the literature too, e.g., [,]. The use-cases for such models have included, e.g., model predictive control (MPC) for reducing combined sewer overflows (CSO).
This paper presents a generic real-time modeling framework, based on an enhanced version of the Storm Water Management Model (SWMM) simulator [], and applied in a case study for the Helsinki Region Environmental Services (HSY) for approximating the CSO volume and load in terms of biological oxygen demand (BOD), chemical oxygen demand (COD), suspended solids (SS), total phosphorous (P), and total nitrogen (N). Besides the CSO volume and load values used for reporting to the environmental authorities, the model is used for various operational and design purposes at the water utility.
2. Materials and Methods
The presented method, Fluidit Storm Online, is based on the Fluidit Storm [] modeling software version 2.5, using an enhanced version of OpenWaterAnalytic’s (OWA) SWMM [] simulator. Enhancements over OWA’s version include, e.g., various simulation performance improvements, bug fixes, support for saving the hot start file at any time in order to support continuous modeling while reporting results for longer time periods, support for zeroth- and second-order reaction kinetics, fixes for quality modeling at control devices, support for multiple inflows with different patterns and timeseries connected to same node, support for custom length patterns with pattern-specific time steps, pump rotational speed control, and improved support for time zones and daylight saving time.
The simulation process is divided into three phases: (1) fetching and pre-processing the input data, (2) restoring the simulator state from the previous run’s hot start file and simulating the model, and (3) saving the simulator state into a new hot start file, saving the model with the results, and exporting the results. The process is repeated continuously with a constant frequency, in this case once an hour. The schematic representation of the framework is shown in Figure 1a.
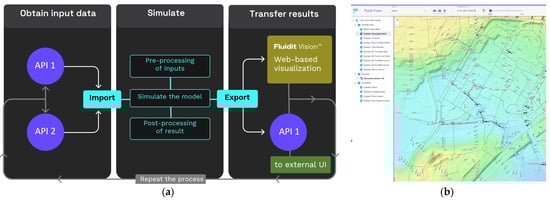
Figure 1.
(a) The Fluidit Storm Online framework and the system integrations. (b) An example map view of a model in Fluidit Vision.
The simulation process starts by fetching and pre-processing the input data. If the input data are unavailable or are of too poor quality, data replacement is performed. For example, missing radar-based precipitation is replaced with land-based measurements, and external inflows replaced with average inflows stored previously. All data replacement actions are logged for further analysis. External data connections, data pre- and post-processing, and replacement steps, and the connections between the model components and data inputs, are set up visually in the Fluidit Storm desktop software and stored in the model itself.
The simulation is run next, and when it completes, the entire model with the simulation results, pre-defined schematic reports, and visualizations is uploaded into Fluidit Vision, a browser-based platform, shown in Figure 1b, for use by system analysts and network operators. Selected results can also be exported into any external systems.
The framework will issue warnings and alerts to the operators. For instance, in case the input data replacement fails, a simulation fails to run, or unsatisfactory results with large continuity errors are obtained, alerts are logged and sent via e-mail to the relevant parties at the utility. For minor cases, such as the replacement of a few input data entries, only warnings are generated and logged for future analysis and improvement.
3. Case Study
The HSY has rebuilt the Helsinki combined sewer model for better accuracy and usability over the last years. The area covered by the model and its size details are shown in Figure 2a. The model includes even small pipes, the relevant separate sanitary sewer network, each customer’s inflow and the inflow patterns read from water supply system measurements, all pumping stations and overflow structures, the relevant external flows from the surrounding areas that are not part of the model itself, the sewage quality model, and hydrology.
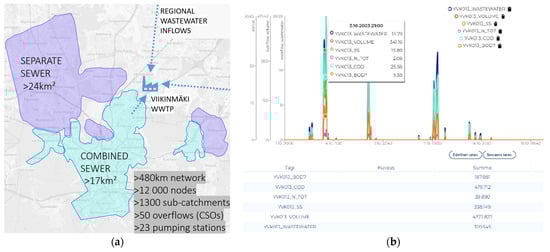
Figure 2.
(a) Coverage and details of Helsinki’s combined sewer Fluidit Storm model. (b) CSO flow and load results presented in Smartvatten Neuro as timeseries and table for October 2023.
The rainfall-derived infiltration and inflow (RDII) was modeled using a physics-based approach via SWMM’s aquifers and groundwater flows. Unit hydrographs were used to model the RDII for some peripheral separate sewer areas. Snow accumulation and melting was included using snowpack components. Evaporation, catchment runoff and infiltration, and sea level variations were also modeled.
After calibration, the model was able to satisfactorily reproduce inflows and average load concentrations measured at the Viikinmäki wastewater treatment plant (WWTP) during all seasons, with marked improvements in winter and spring, compared with the earlier models that had been used, and the model was approved for environmental load reporting by the authorities overseeing the utility operations.
Weather data, sea level, temperature, and rain intensity are obtained from the Finnish Meteorological Institute (FMI) []. Sea level and temperature measurements have an hourly time resolution, while radar-based rain intensities for the 500 × 500 m cells have a five-minute time resolution. External inflows, the inflow patterns, and pumping station wet well levels and flows are obtained from the control system via the Smartvatten Neuro [] data and visualization platform. Data are obtained from both providers via their respective open representational state transfer (REST) application programming interfaces (API), as shown in Table 1.

Table 1.
Input and output data for Fluidit Storm Online for Helsinki’s combined sewer model.
The CSO volumes and simulated loads for the 54 overflow structures are exported into Smartvatten Neuro, shown in Figure 2b, for further analysis, visualization, and archiving. Besides BOD, COD, P, N, and SS, the sixth pollutant represents share of the sanitary sewage in the network. The share of wastewater at each overflow location is multiplied by the total CSO volume to estimate the amount of wastewater discharged into the sea.
The production deployment runs on an on-premises server with a Windows Server 2019 operating system, having a 12-core 2.60 GHz Intel Xeon Gold 6126 processor, 16 GB memory, and 256 GB disk space. A one-hour long nowcasting simulation, including all the data fetching, pre- and post-processing, and uploading the results, took about 2 min.
4. Conclusions and Discussion
A generic framework for performing hind-, now-, and forecasting simulations for large-scale sewer networks was presented. The case study included an accurate hydrological model and a model of sewage quality aspects. In the case study, the framework was utilized in nowcasting mode for gaining near real-time insights into the CSOs and the resulting environmental loads, and reporting the CSO events, volumes, and loads to the environmental authorities. Previously, manual data treatment, simulations, and post-processing were carried out to produce an overflow report for the authorities only quarterly.
Besides the numerical results exported to the reporting system, the full set of simulation results and various analyses and visualizations are available via the Fluidit Vision tool. The model is also utilized at the water utility for design, operational, and hindcasting uses daily.
While the CSO data are inherently public, the data become available only long after the spills. Different stakeholders have expressed their desire for more timely access to the simulated CSO data. For example, environmental and health authorities, and certain companies negatively affected by the CSOs, see a lot of benefit from having a warning as soon as a significant enough CSO happens close to their operations or when a water quality sampling would be necessary. The HSY will start a project to deliver the relevant warnings and summaries timely to the stakeholders in early 2025.
The further future developments in the HSY include the use of rainfall and temperature forecasts as inputs for forecasting the system behavior, and automatically sending warnings, if the forecasted results show capacity problems or overflows in the network. An automated continuous result validation and model performance evaluation comparing the real-time model results and measured data will be added too. A plan exists to include real-time coupled 1D–2D flood simulations for parts of the network in the medium-term future.
Author Contributions
Conceptualization, M.I.S. and P.A.; methodology, M.I.S. and P.A.; software, M.I.S. and P.A.; writing—draft, P.A.; writing—review and editing, M.I.S.; project administration, H.B. and H.R. All authors have read and agreed to the published version of the manuscript.
Funding
This research was partially funded by the Finnish Ministry of the Environment via its Water Protection Program 2019–2023 (YM007:00/2023).
Institutional Review Board Statement
Not applicable.
Informed Consent Statement
Not applicable.
Data Availability Statement
The datasets presented in this article are not readily available because of the network model data confidentiality.
Conflicts of Interest
Authors Sunela, Almeida, and Björninen own stock in Fluidit Ltd.
References
- Sunela, M.I.; Puust, R. Real Time Water Supply System Hydraulic and Quality Modeling—A Case Study. Procedia Eng. 2014, 119, 744–752. [Google Scholar] [CrossRef][Green Version]
- Bartos, M.; Kerkez, B. Pipedream: An interactive digital twin model for natural and urban drainage systems. Environ. Model. Softw. 2021, 144, 105120. [Google Scholar] [CrossRef]
- Lumley, D.; Wanninger, D.J.; Magnusson, Å.; I’Ons, D.; Gustafsson, L.-G. Implementing a digital twin for optimized real-time control of Gothenburg’s regional sewage system. Water Pract. Technol. 2024, 3, 657–670. [Google Scholar] [CrossRef]
- McDonnell, B.; Wu, J.X.; Ratliff, K.; Mullapudi, A.; Tryby, M. Open Water Analytics Stormwater Management Model, v5.1.13; Zenodo. Available online: https://zenodo.org/records/6561640 (accessed on 25 March 2024).
- Fluidit Storm—Manage Flood Risks. Available online: https://fluidit.com/software/fluidit-storm/ (accessed on 25 March 2024).
- Open Data—Finnish Meteorological Institute. Available online: https://en.ilmatieteenlaitos.fi/open-data (accessed on 25 March 2024).
- Smartvatten Neuro. Available online: https://www.smartvatten.com/neuro (accessed on 25 March 2024).
Disclaimer/Publisher’s Note: The statements, opinions and data contained in all publications are solely those of the individual author(s) and contributor(s) and not of MDPI and/or the editor(s). MDPI and/or the editor(s) disclaim responsibility for any injury to people or property resulting from any ideas, methods, instructions or products referred to in the content. |
© 2024 by the authors. Licensee MDPI, Basel, Switzerland. This article is an open access article distributed under the terms and conditions of the Creative Commons Attribution (CC BY) license (https://creativecommons.org/licenses/by/4.0/).