Proceeding Paper

Using the Acoustic Velocity Vector to Assess the Condition of Buried Water Pipes †

by
Joanna Watts
*,
Michael-David Johnson
and
Kirill Horoshenkov
Department of Engineering, University of Sheffield, Sheffield S10 2TN, UK
*
Author to whom correspondence should be addressed.
Presented at the 3rd International Joint Conference on Water Distribution Systems Analysis & Computing and Control for the Water Industry (WDSA/CCWI 2024), Ferrara, Italy, 1–4 July 2024.
Eng. Proc. 2024, 69(1), 187; https://doi.org/10.3390/engproc2024069187
Published: 9 October 2024

Abstract

:
Traditionally, acoustic methods for leak inspection are based on the measurement of the acceleration of the external pipe wall or of the acoustic pressure in the pipe. This work presents an alternative inspection methodology based on measuring the acoustic velocity vector in the fluid filling the pipe. Unlike the acoustic pressure, the acoustic quantity is very sensitive to the presence of a pipe wall defect. Such defects are important to detect before they develop into leaks, which can lead to the loss of water, environmental pollution and service disruption. A new sensor design is proposed to measure the acoustic velocity vector in a pipe. A model is presented to demonstrate the underpinning theory behind this new sensor technology. The results of this model are compared with experimental data based on measurements of the acoustic velocity in an exhumed section of ductile iron pipe. These sensors can be deployed on robots to autonomously monitor the deterioration of buried pipes to support proactive asset management at a low operational cost.

1. Introduction

Rising mains are used to transport wastewater either uphill or over long distances of flat ground. The rising main network is smaller than both gravity sewer networks and potable water networks. However, rising mains have a higher breakage incidence per kilometer due to several factors, namely they are rarely inspected; they are pumped periodically so there is cyclic strain on the network; and their contents are both abrasive and chemically corrosive. Any leakage represents an ecological and health hazard, and they may leak large volumes relatively quickly since they are pressurized. As such, pre-emptive maintenance checks are important to find the onset of damage before it leads to any leakage [1].
The existing methods of defect detection mainly use sampling techniques, such as ultrasonics, longer-distance methods such as acoustics or PIGs. An extensive review of these is available in [2]. PIGs are becoming increasingly popular, whether they use CCTV, acoustic or electromagnetic sensors, e.g., the Sahara system [3], to find defects as they move through the pipe. In this paper, we propose a novel sensor to be deployed on an in-pipe robotic platform to provide an increased sensitivity to defects in the pipe.

2. Materials and Methods

The most common types of defect found in rising mains are abrasion of the bottom surface of the pipe or chemical corrosion of the top surface [4]. These were modeled in COMSOL MultiPhysics to investigate what effect localized pipe thinning and small holes in the pipe wall have on the pipe acoustics, and, therefore, which parameters are most sensitive to defects in the pipe. To validate the results of the models, the change in pressure and acoustic velocity were compared with experimental data from an exhumed section of rising main, which contained numerous holes along the bottom surface.

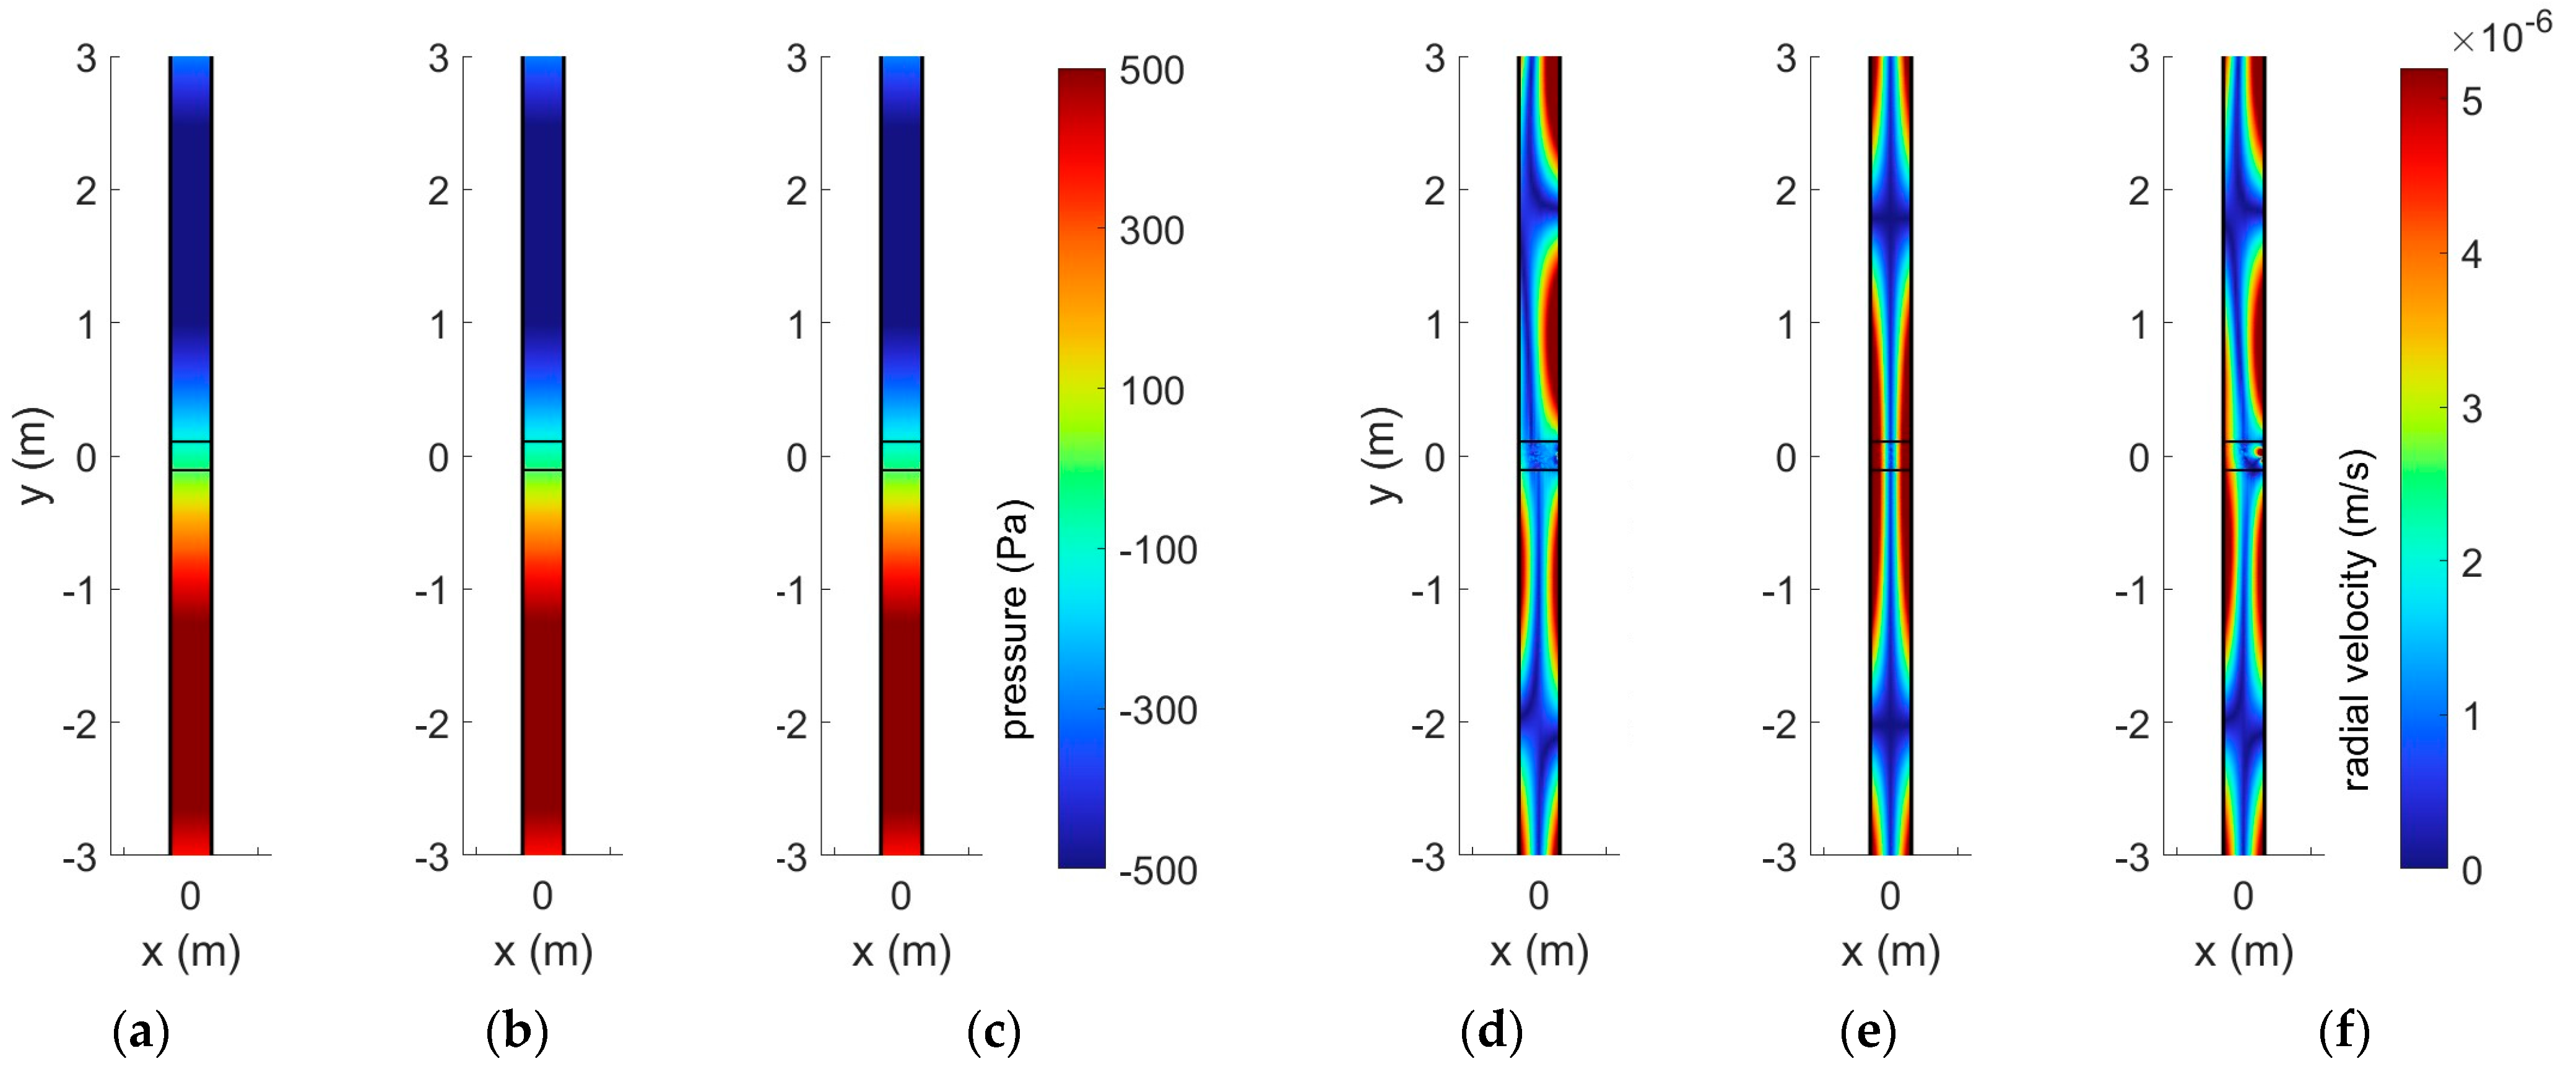
2.1. Numerical Models

Three models were run, all considering the frequency response of a water-filled ductile iron pipe of length 56 m, diameter 310 mm and wall thickness 10 mm. In one model, there was no defect; in the second, there was localized thinning of the pipe wall to 1/3 of its usual thickness; and in the third, there was a hole of radius 10 mm in the pipe wall.
Based on these models, the fluid velocity/acceleration was found to be particularly sensitive to the presence of defects, informing the choice of sensor used for the experiments. The results extracted from these models are discussed fully in Section 3.1.

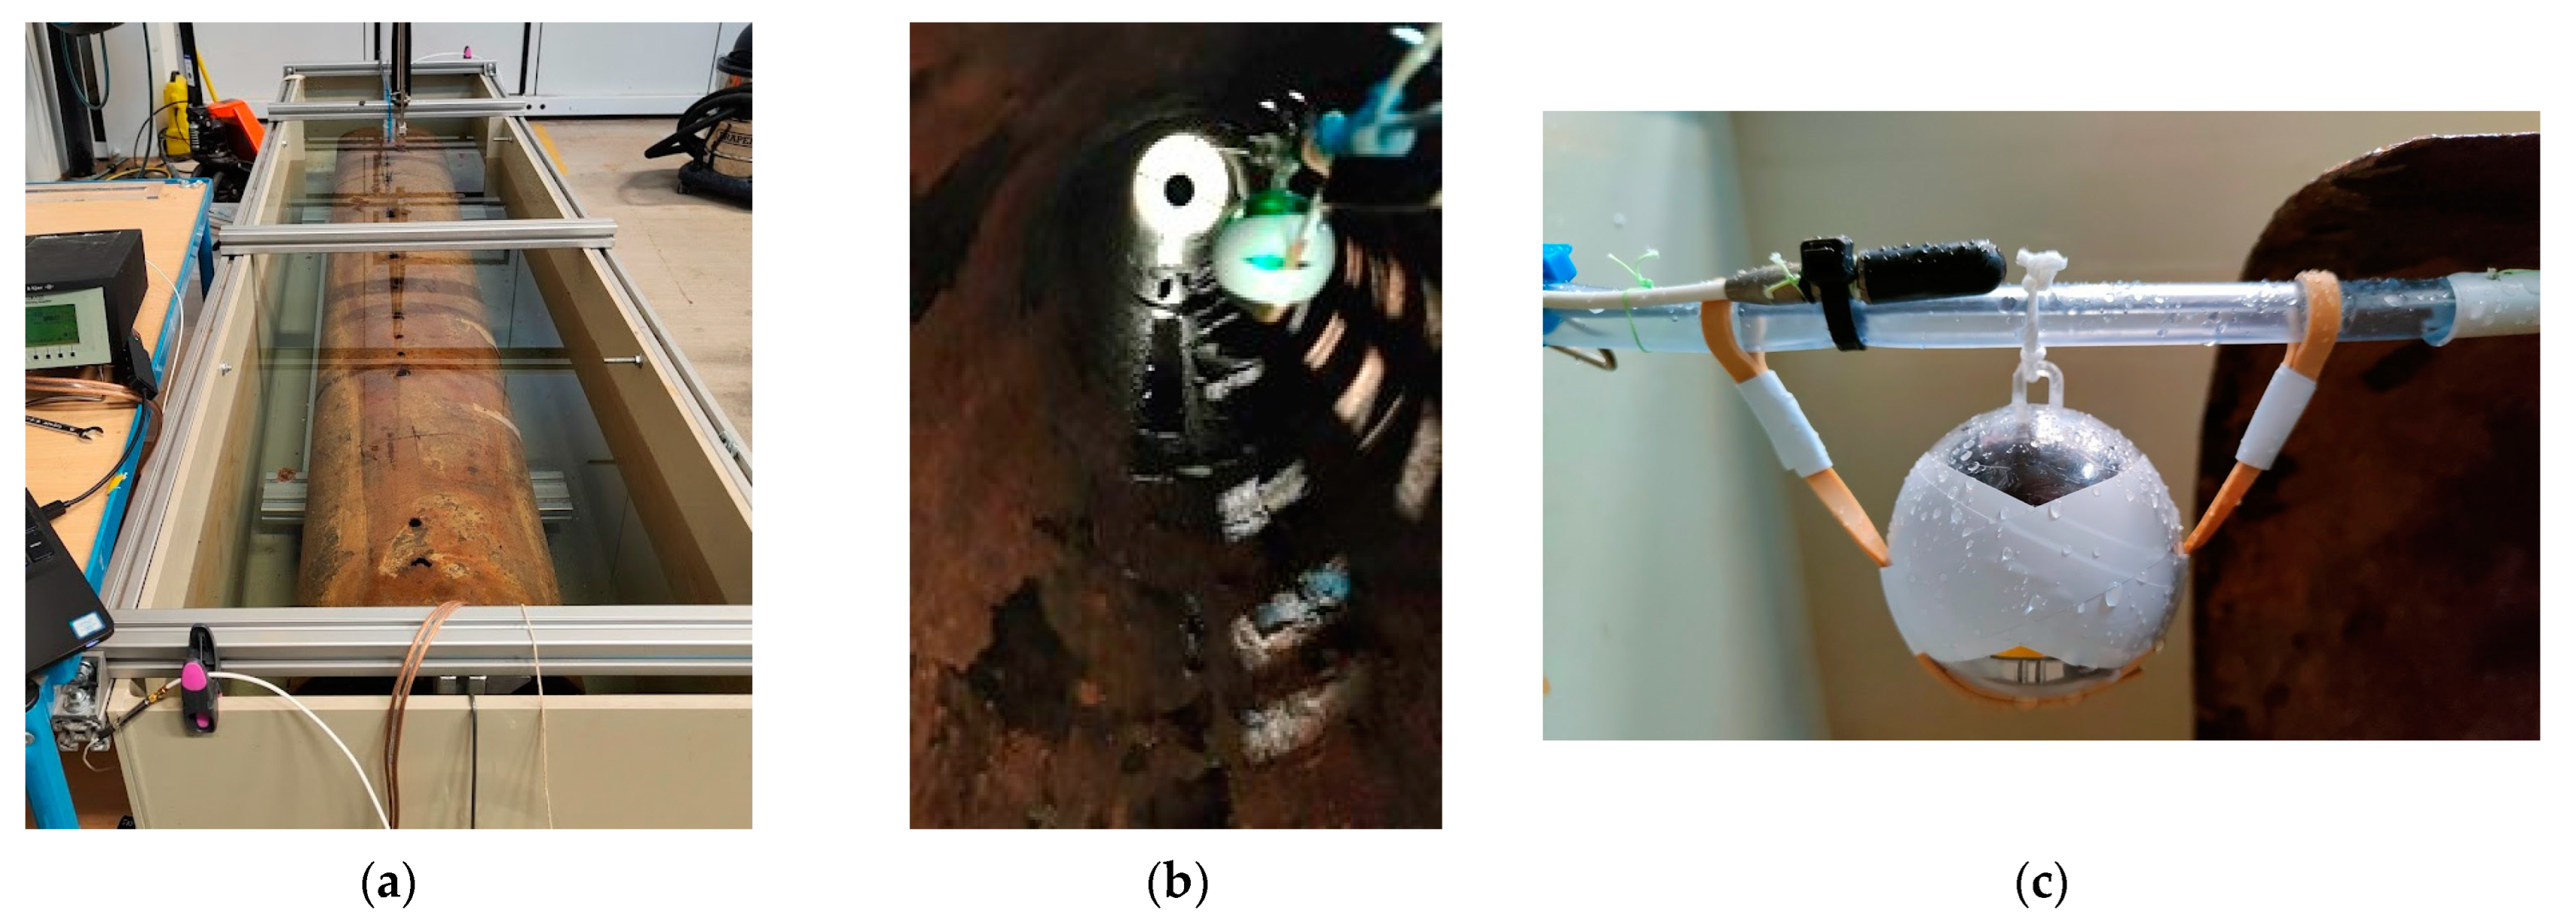
2.2. Experimental Methodology

A 2.0 m length of 310 mm diameter ductile iron rising main was provided by Thames Water. It had significant deterioration on its bottom surface, as shown in Figure 1a. In order to measure the acoustic velocity vector near both the deteriorated and intact surfaces of the pipe wall, the pipe was placed on a wheeled frame such that it could be rotated, while the sensor was mounted at the top of the pipe, as shown in Figure 1b. Measurements were taken with the holes next to the sensor and with the pipe rotated by 90° such that an intact surface was next to the sensor. The sensor consisted of a wireless G-link-200 accelerometer (manufactured by HBK Microstrain, Williston, VT, USA) and an 8103 hydrophone (B&K, Nærum, Denmark), which was mounted as shown in Figure 1c. The accelerometer in the G-link-200 had a 20-bit resolution over a range of ±2 g, and could sample at a rate of 2046 Hz. It was constrained by rubber bands to ensure that the motion of the three axes could be analyzed independently. The hydrophone was amplified using a 2693-0S4 conditioning amplifier (B&K, Nærum, Denmark) and was recorded using a USB-4431 data acquisition card (NI, Emerson, USA) with LabVIEW 2022 Q3. The sensor was recording the response to a 170 Hz tone, produced by a FR8 underwater speaker (Visaton GmbH & Co., Haan, Germany) amplified by a TDA7498E audio amplifier (Fosi Audio, Shenzhen, China), which was installed at the end of the pipe (Figure 1b).
For each pipe orientation, the sensor was moved in 25 mm increments over a 400 mm range centered around a defect, and the response was recorded using the hydrophone and the accelerometer. The results of these measurements are discussed in Section 3.2.

3. Results

3.1. Numerical Models

It is most common, conventionally, to measure either the wall acceleration or the sound pressure to determine the presence of a defect in a pipe. A comparison of the sound pressure for the three models introduced in Section 2 is shown in Figure 2a–c for a source frequency of 170 Hz. It can be seen that there is no discernible difference between the three cases, i.e., it is difficult or impossible to use the sound pressure at a relatively low frequency to localize these defects. It should be noted here that the defects being investigated are significantly smaller than those being found by current methods.
In contrast, Figure 2d–f show a clear loss of symmetry in the radial component of the acoustic velocity vector in the immediate vicinity of these defects and at some distance from it. In the case of an intact pipe (Figure 2e), there is a symmetric mode with nodes at −2.1 and 1.9 m; when a small defect is introduced (Figure 2f), a distortion is introduced at the location of the defect, and these nodes are shifted off the axis of symmetry. For a larger defect (Figure 2d), this effect is exaggerated.

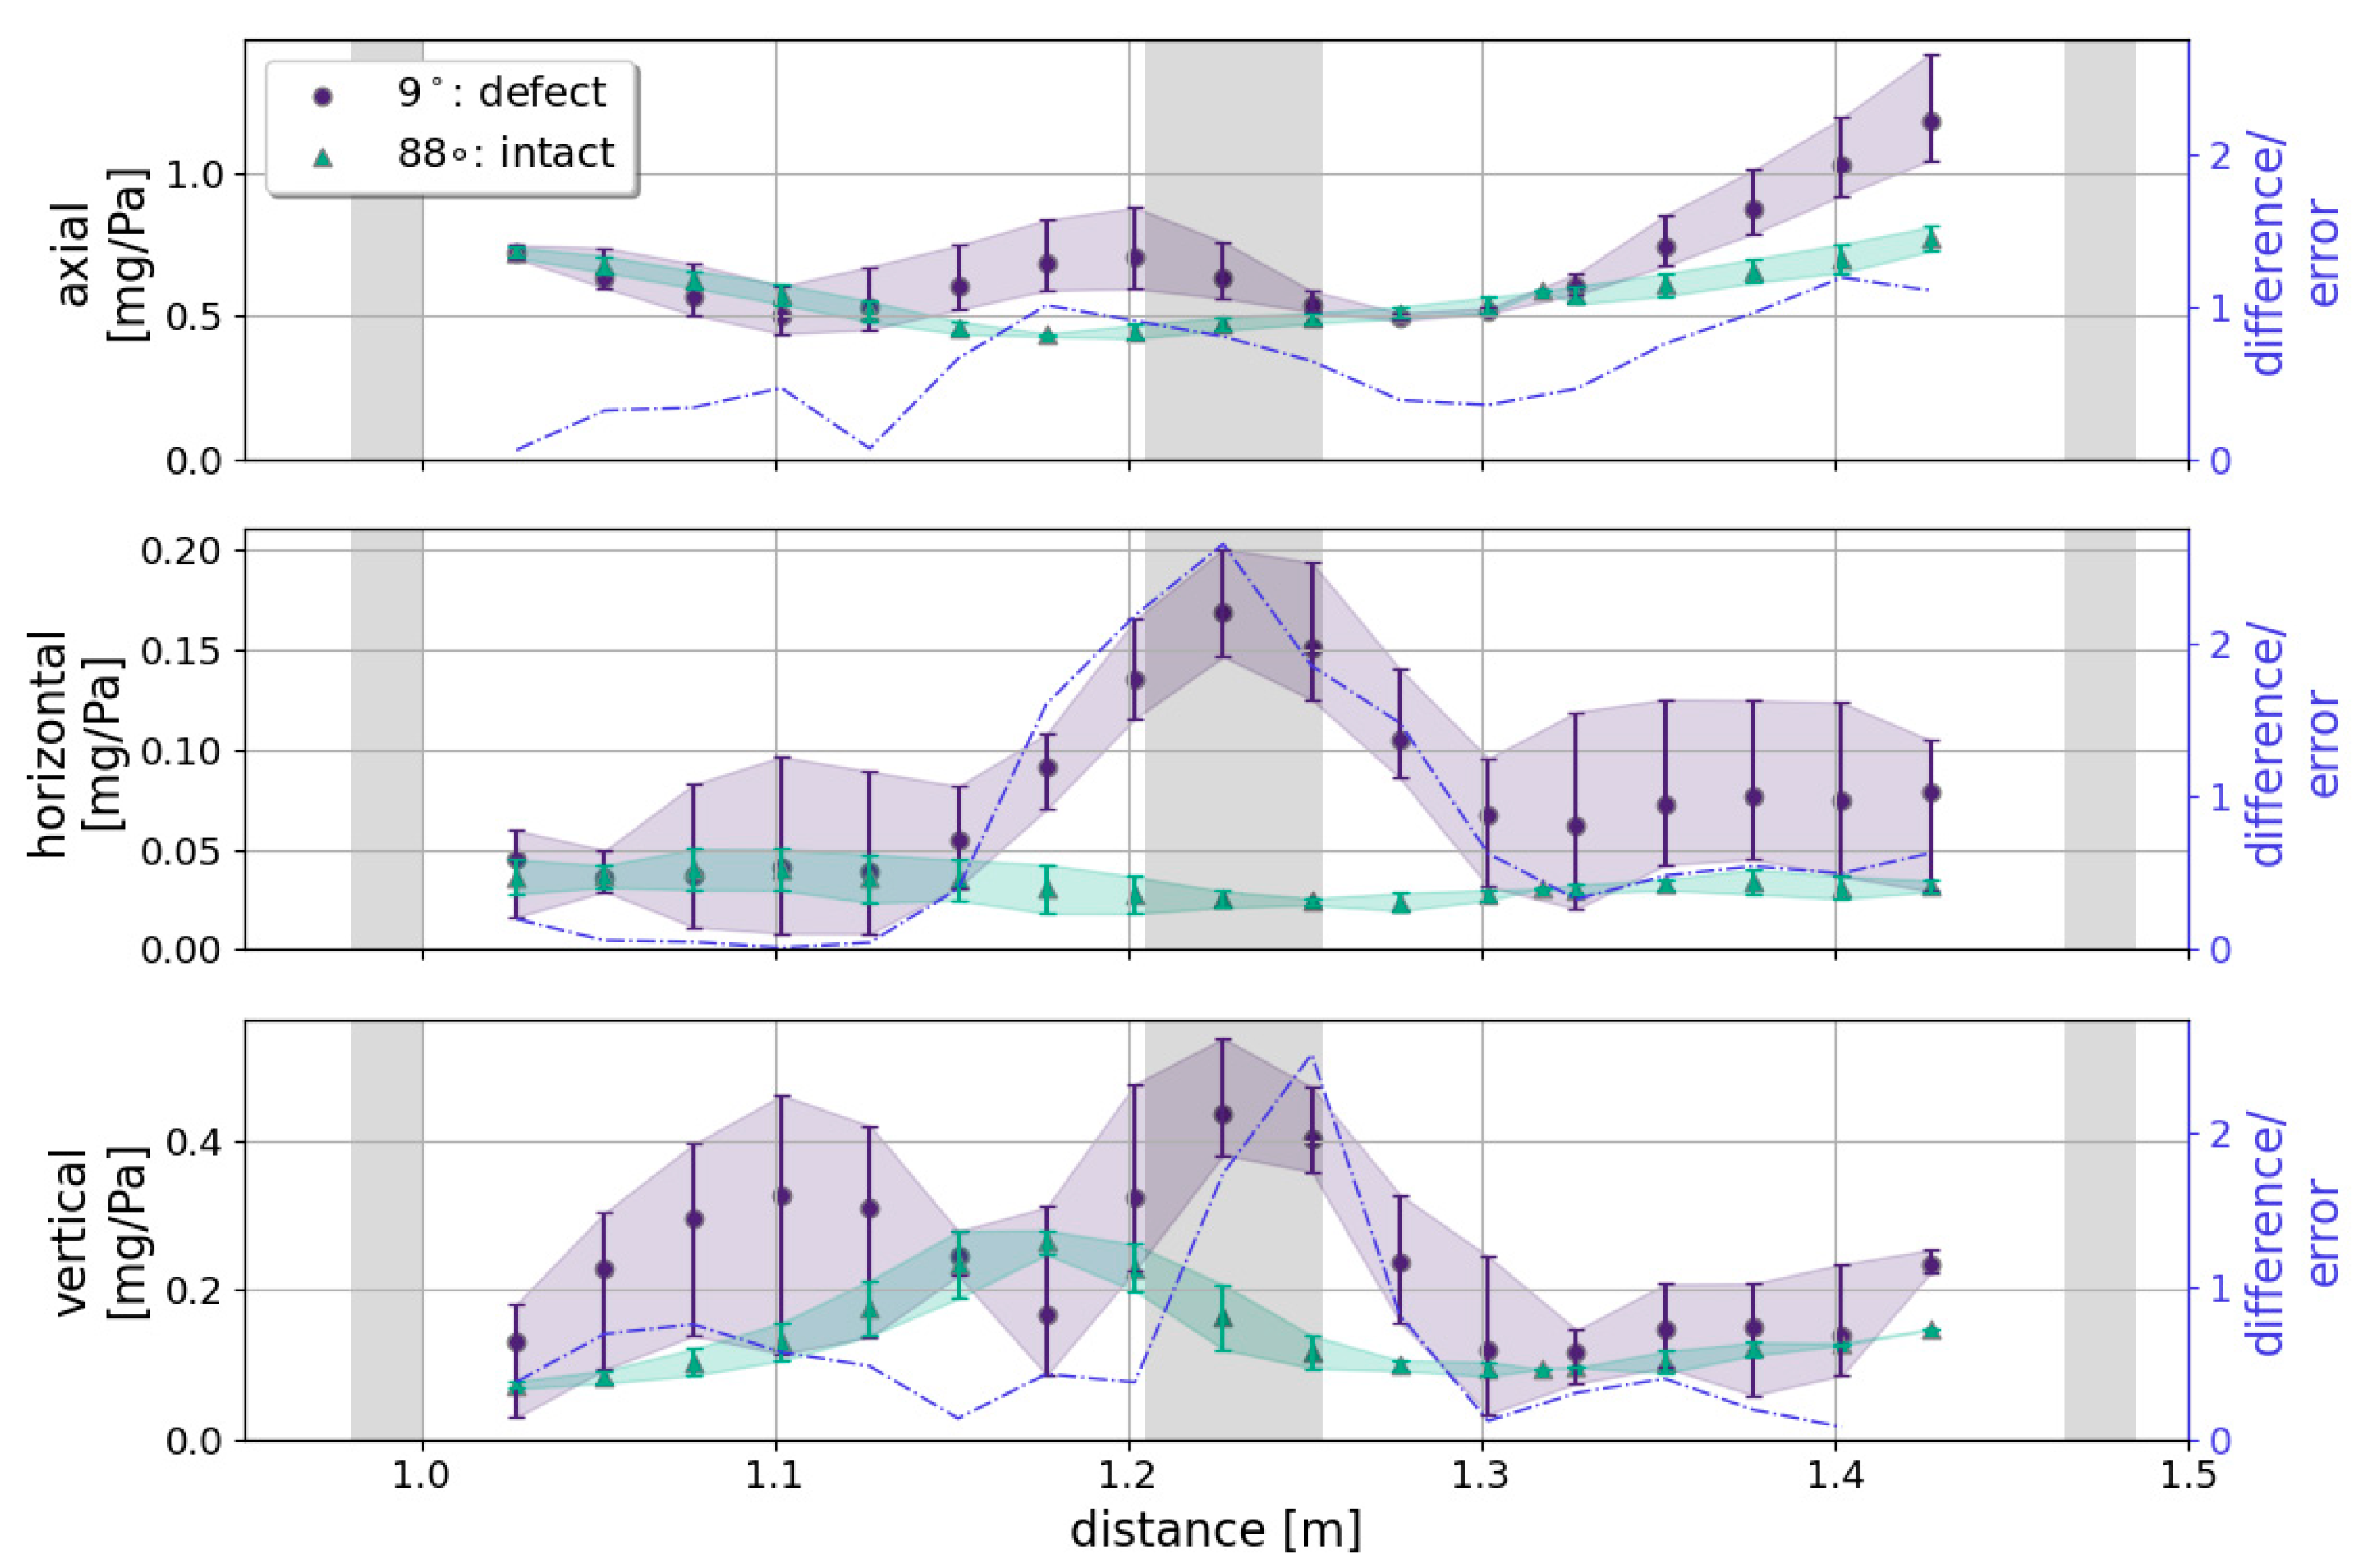
3.2. Experimental Results

The results of the numerical model suggest that the presence of holes in the pipe should be detectable using the accelerometer chosen; a change in fluid velocity of 6 × 10⁻⁶ m/s equates to an acceleration of 6.4 × 10⁻³ m/s2 at 170 Hz, and the accelerometer has a sensitivity of 4 × 10⁻⁵ m/s2. The experimental results are shown in Figure 3, where the three components of acceleration measured by the sensor next to the defective side of the pipe are compared with those next to an intact side of the pipe. There is a clear separation in behavior between the two measurement locations as the sensor passes the defect. It is particularly noticeable in the horizontal direction, where the difference is ~2.5 times the combined measurement error. The vertical acceleration also displays a change of two errors bars at the defect. The axial acceleration shows much less difference; this is to be expected, given the close relationship between pressure and axial fluid velocity.

4. Conclusions

It has been shown through modeling and experiments that the vertical and horizontal components of the acoustic velocity vector can be used to detect small defects in a water-filled pipe; initially, this is based on numerical simulations, but also using measurements from an ex-rising main. The sound pressure and axial velocity components are insensitive to the presence of a defect. It has been shown that a commercial triaxial accelerometer can be used to measure the acoustic velocity components in water and at relatively low frequencies of sound. This work paves the way for the deployment of new sensors on a robotic platform to inspect pressurized water pipes that are difficult or impossible to inspect with more traditional methods such as CCTV or electromagnetic sensors.

Author Contributions

Conceptualization, methodology, validation, and investigation: J.W. and K.H.; formal analysis, data curation, and original draft: J.W.; visualization: J.W. and M.-D.J.; review and editing: K.H. and M.-D.J.; supervision and funding acquisition: K.H. All authors have read and agreed to the published version of the manuscript.

Funding

This work is supported by the UK’s Engineering and Physical Sciences Research Council (EPSRC), grant no. EP/S016813/1.

Institutional Review Board Statement

Not applicable.

Informed Consent Statement

Not applicable.

Data Availability Statement

Experimental and simulation results are available upon request.

Acknowledgments

The authors would like to thank Paul Osbourne for kindly helping with the design of the rig and other experimental facilities, and David Walters of Thames Water for the provision of the exhumed pipe. For the purpose of open access, the authors have applied a ‘Creative Commons Attribution’ (CC BY) license to any Author Accepted Manuscript version arising.

Conflicts of Interest

The authors declare no conflicts of interest. The funders had no role in the design of the study; in the collection, analyses, or interpretation of data; in the writing of the manuscript; or in the decision to publish the results.

References

  1. Gould, S.; Davis, P.; Beale, D.; Marlow, D. Failure analysis of a PVC sewer pipeline by fractography and materials characterization. Eng. Fail. Anal. 2013, 34, 41–50. [Google Scholar] [CrossRef]
  2. Rizzo, R. Water and Wastewater Pipe Nondestructive Evaluation and Health Monitoring: A Review. Adv. Civ. Eng. 2010, 2010, 818597. [Google Scholar] [CrossRef]
  3. Jones, C.; Mergelas, B.; Laven, K.; Bond, A. Pinpointing Exfiltration in Large Diameter Pressurized Wastewater Pipelines with the Sahara Tethered System. In Pipelines 2006: Service to the Owner; ASCE: Reston, VA, USA, 2006. [Google Scholar] [CrossRef]
  4. Donazzolo, V.; Yelf, R. Determination of wall thickness and condition of asbestos cement pipes in sewer rising mains using Surface Penetrating Radar. In Proceedings of the XIII International Conference on Ground Penetrating Radar, Lecce, Italy, 21–25 June 2010; pp. 1–5. [Google Scholar] [CrossRef]
Figure 1. Experimental setup. (a) Exterior view of pipe (pipe inverted such that defects are along the top of the pipe). (b) Internal view of pipe showing sensor and speaker. (c) Triaxial accelerometer suspended from line with reference hydrophone above.
Engproc 69 00187 g001
Figure 2. Model results: frequency response of the radial fluid velocity and pressure to a 170 Hz source located at −2.0 m; the response for different defects are compared. (a) Pressure with defect thinning the pipe wall; (b) pressure for intact pipe; (c) pressure with a hole in the pipe wall; (d) radial velocity with thinning of the pipe wall; (e) radial velocity for intact pipe; (f) radial velocity with a hole in the pipe wall. The defects are located at y = 0 m in each case.
Engproc 69 00187 g002
Figure 3. Comparison of data measured for the pipe in two orientations for f = 170   Hz with acceleration normalized by the pressure. The blue dashed line shows the ratio of the difference between the with- and without-defect cases and the combined error at each distance. The error bars indicate the reproducibility across multiple measurements. Gray areas show the axial location of holes in the pipe.
Engproc 69 00187 g003
Disclaimer/Publisher’s Note: The statements, opinions and data contained in all publications are solely those of the individual author(s) and contributor(s) and not of MDPI and/or the editor(s). MDPI and/or the editor(s) disclaim responsibility for any injury to people or property resulting from any ideas, methods, instructions or products referred to in the content.

