Abstract
While disinfection residuals in drinking water limit planktonic microorganism regrowth during distribution, their impact on biofilms remains uncertain. This study examined how different water qualities, specifically chlorine versus chloramine disinfection residuals, affect drinking water biofilm growth in controlled, fully representative, pipe loop experimental facilities. For the first time, pipe loops were deployed at distribution system extremities, enabling the assessment of biofilms grown in bulk waters with higher water ages than previously studied. Biofilms were grown for three months under comparable hydraulic conditions and temperatures in two operational DWDS (chlorine and chloramine). After three months, experiments regarding hydraulic changes (flushing) were performed to mobilise the biofilm and assess the water quality response. Analysis revealed elevated levels of iron and turbidity, exceeding UK regulatory limits, especially in the chloramine system. Cell count data showed a complex response, with differences likely associated with the residual type. The data provide evidence that chloramine does not restrict biofilm growth and that biofilms grown within chloramine DWDS can present an equal, if not greater, risk to water quality than chlorine counterparts.
1. Introduction
Access to safe drinking water is a basic human right and essential to public health and well-being. To protect drinking water against planktonic microbial regrowth during transit, a disinfection residual (chlorine or chloramine) is commonly added. Yet, the majority of biomass in drinking water distribution systems (DWDSs) is in biofilm [1], which is found on the internal surfaces of DWDS infrastructure, consisting of mixed microbial taxa communities and embedded within an extracellular polymeric substance (EPS) matrix. Biofilms can degrade water quality if mobilised into the water column (causing discolouration and potential public health risks if pathogens are released), or via the processes they mediate at the pipe–wall interface (e.g., nitrification) [2,3]. Despite these risks and biofilms comprising the majority of DWDS microbial biomass, the impact of disinfection residuals on biofilm characteristics, growth, and associated water quality risk is under-explored.
Chlorine is a widely used disinfectant, and the use of chloramine continues to rise globally, driven predominantly by the introduction of the DBP rule: U.S. Safe Drinking Water Act, 1974 [4]. Existing studies on the effects of chlorine and chloramine on biofilms often lack representation of real DWDS conditions, and debates persist regarding the specific impacts of these disinfection residuals on biofilm dynamics. An improved understanding of biofilms grown under fully representative controlled conditions and the potential risk they present to water quality is needed to protect public and regulatory compliance. This paper investigates how different water qualities, including disinfection residuals, impact biofilm growth and subsequent water quality response upon mobilisation (flushing), within a controlled fully representative pipe loop experimental environment.
2. Methods
Biofilms were grown within two containerised pipe loops (A2: chloramine and B1: chlorine) for three months under directly comparable hydraulic conditions (0.44 l/s, steady state) and temperatures (20 ± 1.4 °C) (Table 1). Pipe loops were located at two DWDS extremities; therefore, during growth, biofilms were exposed to different water qualities. Following growth, the pipe loop hydraulics were elevated to 5 l/s via three shear stress increments, and impacts on biofilm and water quality (in response to mobilisation) were measured. Bulk water physical and chemical parameters associated with discolouration (iron, manganese, aluminium, and turbidity) and chlorine (free and total) were analysed bi-weekly during growth and pre/post-mobilisation. Biofilm and bulk biological qualities were also assessed as cell counts via flow cytometry; these were analysed monthly and pre/post-mobilisation. Data analysis was performed by statistical software “R”, and due to non-normal distributions, Wilcoxon (RStatix) non-parametric tests were used.

Table 1.
Pipe loop experimental plan (A2 and B1): biofilm and bulk water sampling.
3. Results
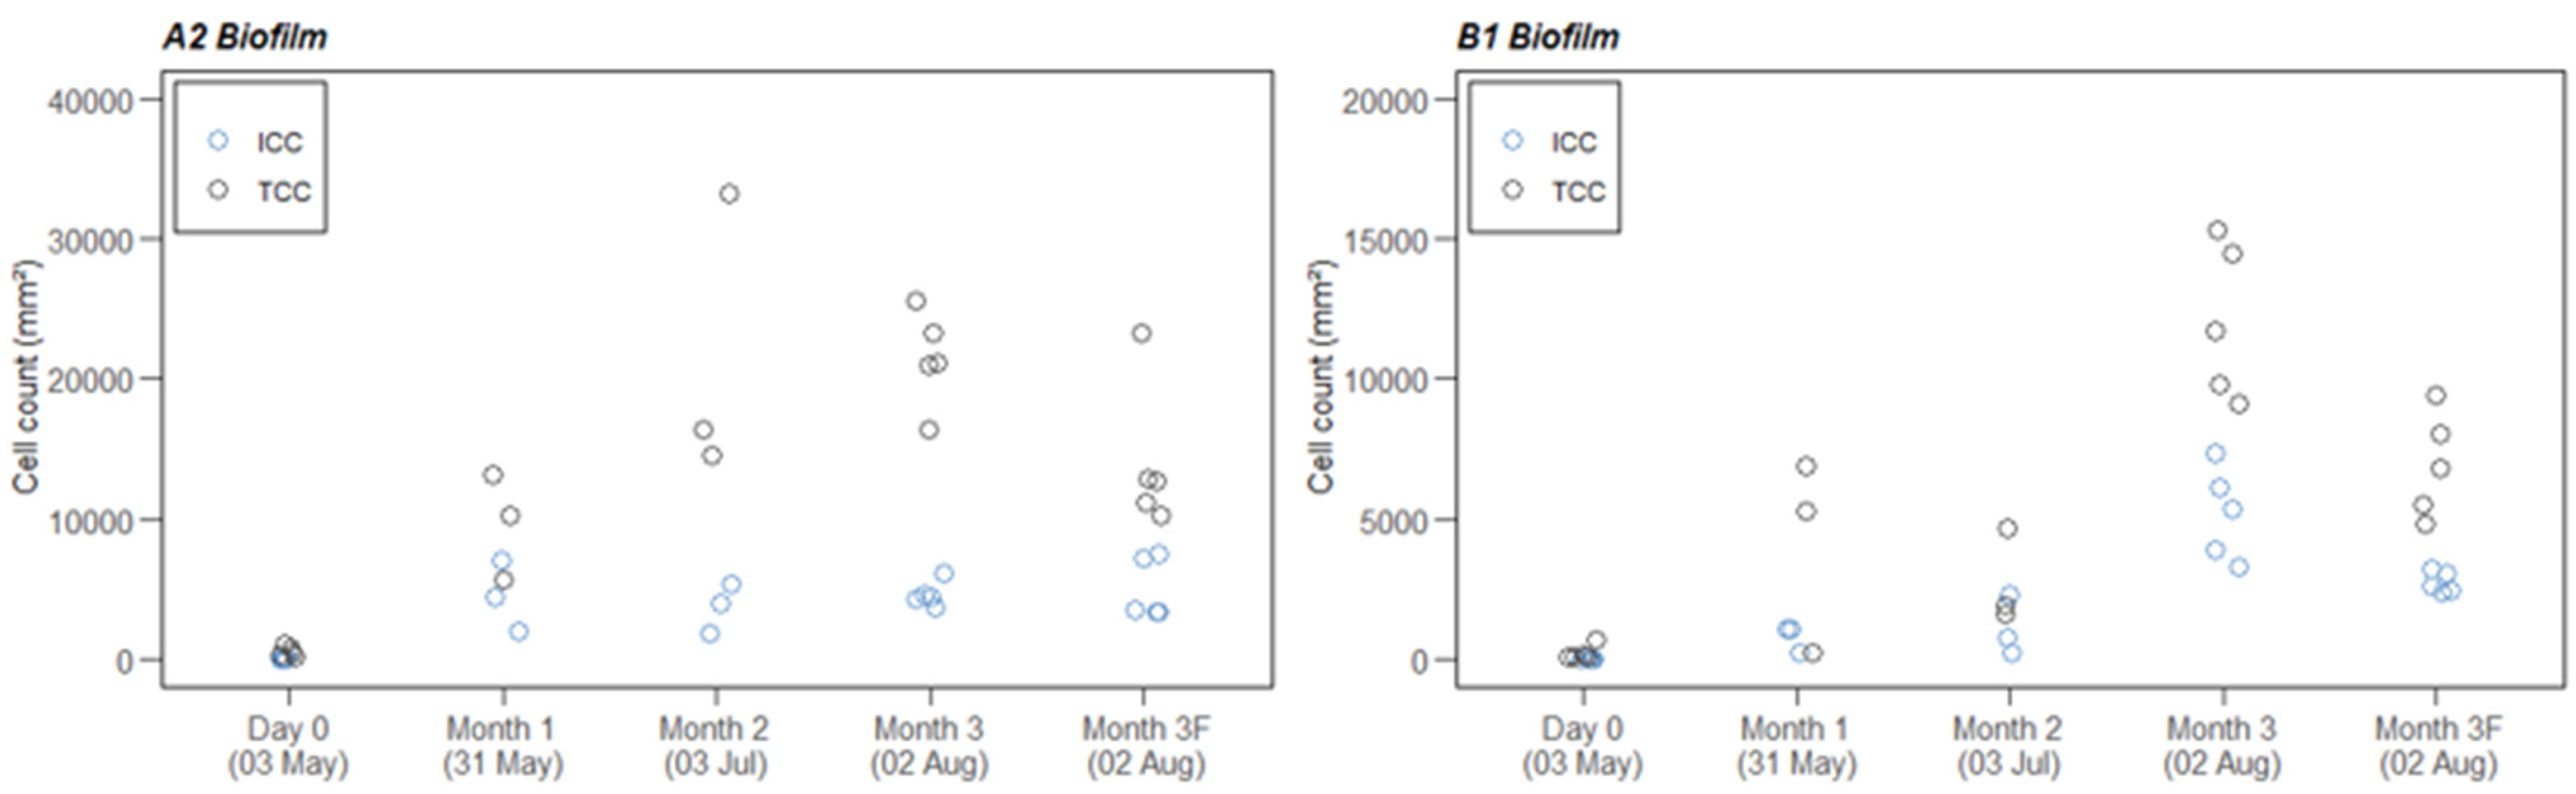
During the growth phase, the chloramine system experienced higher loading of the water quality parameters monitored, particularly discolouration parameters (Fe, NTU, Mn) and cells (Table 2). In terms of biofilms, both A2 and B1 were shown to accumulate cells throughout the growth phase. A2 accumulated a greater number of cells than B1, particularly the total cell count (TCC) (Figure 1). Specifically, at the end of growth, A2 biofilms showed significantly more TCC (W = 25, p = 0.008 (**)) than B1; however, no significant difference was seen in the ICC (W = 11, p = 0.84 (ns)). Upon flushing, cells were removed from the biofilm; a greater % change (between medians) in biofilm cells was seen in B1, with a 51% and 47% reduction in the ICC and TCC, respectively. Comparably, A2 showed an 18% and 40% reduction in the ICC and TCC, respectively, following flushing.
Table 2.
Growth summary statistics for water quality parameters; when not normally distributed, median is shown by *. TCC = total cell counts, ICC = intact cell counts.
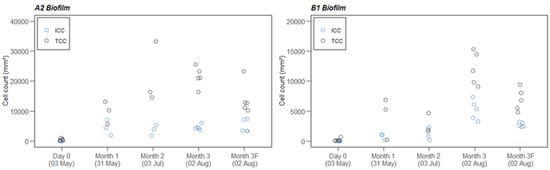
Figure 1.
Biofilm and bulk water cells during the 3-month growth phase and upon hydraulic intervention (flushing—F). Note: Y-axis range differs. TCC = total cell counts, ICC = intact cell counts.
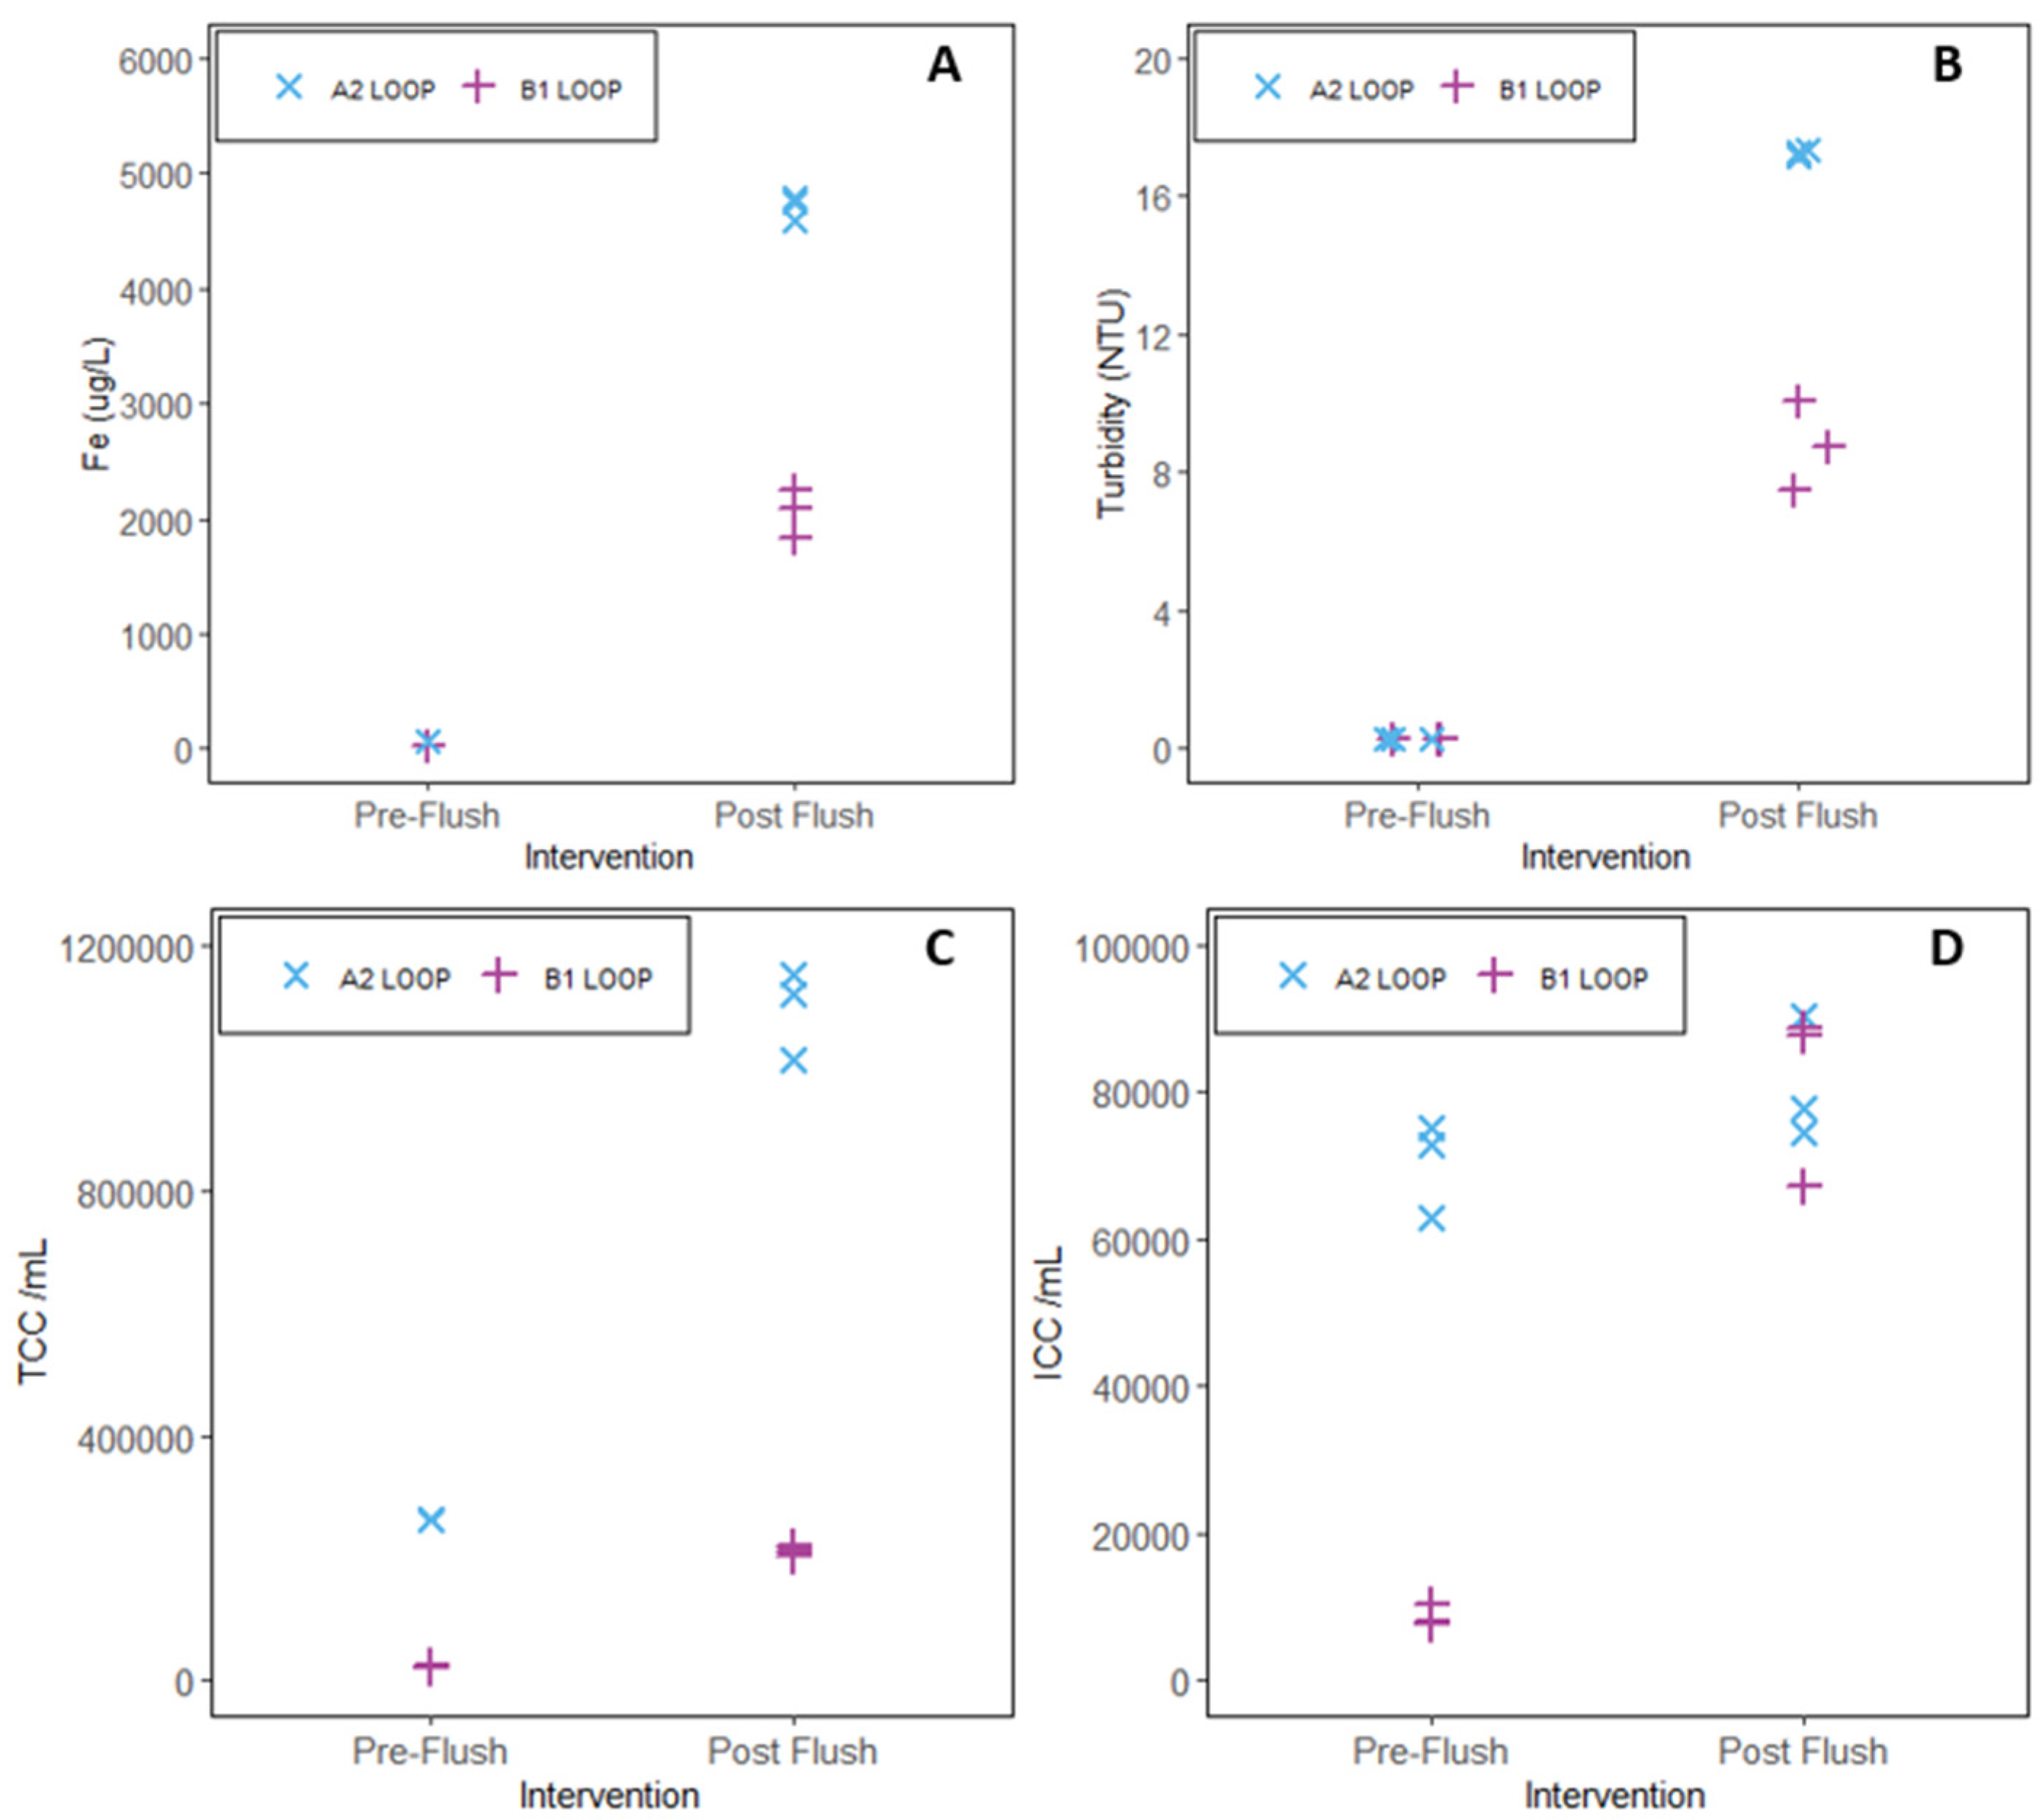
Upon flushing, elevated levels of iron and turbidity, exceeding UK regulatory limits, were seen in both pipe loops, specifically, 19 NTU and 4707 Fe µg/L in A2 and 9 NTU and 2056 µg/L in B1 (Figure 2). Increases in bulk water manganese and aluminium were also seen in both systems but were less notable.

Figure 2.
Bulk water quality concentrations pre- and post-flushing: (A) Fe, (B) turbidity, (C) total cell count (TCC), and (D) intact cell count (ICC).
Bulk water TCC increased more in A2 than in B1 during flushing, corresponding with the biofilm results. A2 showed a limited increase in bulk water ICC (6%) compared to B1, which showed a large increase (977%), resulting in comparable ICC concentrations between both systems after flushing (Figure 2).
4. Discussion
In this study, chloramine disinfection did not completely restrict biofilm growth as the chloramine biofilms showed higher total and intact cells after three months of growth. This contradicts the assumption that chloramine provides better inactivation of cells than chlorine [5,6], particularly at the network extremity. However, biofilm ICC did not differ between chloramine and chlorine biofilms, despite the chloramine system having a much higher loading of cells, which suggests something more complex is occurring: biofilms are not just a function of the microbiology they are exposed to during growth.
Biofilms grown under chloramine presented a much greater discolouration risk than chlorine counterparts, potentially due to the high loading of iron and turbidity in the pipe loop feed water, which subsequently accumulated at the pipe–wall interface. Lower loading of iron and turbidity was seen in the chlorine pipe loop, and this translated to a lower discolouration response. However, when mobilised both chlorine and chloramine biofilms caused bulk water regulatory exceedances for iron and turbidity and showed large increases in planktonic cell counts. Therefore, biofilms grown within 3 months can risk regulatory compliance and potentially public health.
5. Conclusions
- A chloramine residual does not restrict biofilm growth;
- Biofilms grown within a chloramine DWDS can present an equal, if not greater, risk to water quality than chlorine counterparts, particularly regarding discolouration.
Author Contributions
Conceptualisation, J.B., V.S., K.F. and G.M.; methodology, J.R., J.B., V.S., K.F. and G.M.; software, J.R.; validation, J.R.; formal analysis, J.R.; investigation, J.R.; resources, J.R. and G.M.; data curation, J.R.; writing—original draft preparation, J.R.; writing—review and editing, J.B., V.S., K.F. and G.M.; visualisation, J.R.; supervision, J.B., V.S., K.F.; project administration, J.B., V.S., K.F. and G.M.; funding acquisition, J.B., V.S., K.F. and G.M. All authors have read and agreed to the published version of the manuscript.
Funding
This research was funded by Scottish Water and EPSRC.
Institutional Review Board Statement
Not applicable.
Informed Consent Statement
Not applicable.
Data Availability Statement
Unavailable due to privacy restrictions.
Acknowledgments
Lab work and fieldwork assistance; Frances Pick and Isabel Carneiro, both University of Sheffield. For the purpose of open access, the author has applied a Creative Commons Attribution (CC BY) license to any author-accepted manuscript versions arising.
Conflicts of Interest
The authors declare no conflicts of interest.
References
- Flemming, H.-C.; Percival, S.L.; Walker, J.T. Contamination potential of biofilms in water distribution systems. Water Supply 2002, 2, 271–280. [Google Scholar] [CrossRef]
- Gomez-Alvarez, V.; Schrantz, K.; Pressman, J.; Wahman, D. Biofilm community dynamics in bench-scale annular reactors simulating arrestment of chloraminated drinking water nitrification. Environ. Sci. Technol. 2014, 48, 5448–5457. [Google Scholar] [CrossRef] [PubMed]
- AWWA. Nitrification Prevention and Control in Drinking Water(AWWA MANUAL M56); 2013. [Google Scholar]
- Boorman, G.A.; Dellarco, V.; Dunnick, J.K.; Chapin, R.E.; Hunter, S.; Hauchman, F.; Gardner, H.; Mike, C.; Sills, R.C. Drinking water disinfection byproducts: Review and approach to toxicity evaluation. Environ. Health Perspect. 1999, 107 (Suppl. 1), 207–217. [Google Scholar] [CrossRef] [PubMed]
- Pressman, J.G.; Lee, W.H.; Bishop, P.L.; Wahman, D.G. Effect of free ammonia concentration on monochloramine penetration within a nitrifying biofilm and its effect on activity, viability, and recovery. Water Res. 2012, 46, 882–894. [Google Scholar] [CrossRef] [PubMed]
- Lee, W.H.; Pressman, J.G.; Wahman, D.G. Three-Dimensional Free Chlorine and Monochloramine Biofilm Penetration: Correlating Penetration with Biofilm Activity and Viability. Environ. Sci. Technol. 2018, 52, 1889–1898. [Google Scholar] [CrossRef] [PubMed]

Disclaimer/Publisher’s Note: The statements, opinions and data contained in all publications are solely those of the individual author(s) and contributor(s) and not of MDPI and/or the editor(s). MDPI and/or the editor(s) disclaim responsibility for any injury to people or property resulting from any ideas, methods, instructions or products referred to in the content. |
© 2024 by the authors. Licensee MDPI, Basel, Switzerland. This article is an open access article distributed under the terms and conditions of the Creative Commons Attribution (CC BY) license (https://creativecommons.org/licenses/by/4.0/).