Proceeding Paper

Employing Extended Kalman Filter for Faulty Sensor Detection in Water Distribution Systems †

Fariborz Maseeh Department of Civil, Architectural and Environmental Engineering, The University of Texas at Austin, Austin, TX 78712, USA
*
Author to whom correspondence should be addressed.
Presented at the 3rd International Joint Conference on Water Distribution Systems Analysis & Computing and Control for the Water Industry (WDSA/CCWI 2024), Ferrara, Italy, 1–4 July 2024.
Eng. Proc. 2024, 69(1), 28; https://doi.org/10.3390/engproc2024069028
Published: 2 September 2024

Abstract

:
State estimation techniques offer an effective approach for integrating information from hydraulic models with sensor measurements, providing a more accurate representation of the system dynamics. The accuracy of state estimation depends heavily on the reliability of sensor data, making the identification of faulty sensors critical for decision-makers who rely on model estimates. This study proposes a new approach for detecting faulty sensors in water distribution systems to mitigate the adverse effects of incorrect measurements on operational decisions. We utilize the Extended Kalman Filter as the state estimation method and introduce a masking approach for identifying faulty pressure sensors. The effectiveness of the proposed approach is evaluated using a benchmark network model, demonstrating its proficiency in detecting faulty sensor data.

1. Introduction

Water managers need continuous and timely access to information on water distribution system (WDS) states, including pressures and flows, for effective monitoring and operations. Strategically deploying sensors throughout WDSs and integrating measured data with hydraulic models yield valuable insights into real system conditions. State estimation provides an effective approach to merge information from hydraulic models with sensor measurements, offering a more accurate and timely depiction of system dynamics [1,2,3,4].
We utilize the open-source hydraulic solver PipeDream [5] to formulate a state-space model of WDS hydraulics based on the Saint–Venant equations. The fusion of sensor data with the hydraulic model is then implemented using the Extended Kalman Filter [6], which accommodates uncertainties in both model estimates and sensor readings. However, the accuracy of the state estimation relies heavily on the validity of the collected data, making the reliability of the sensor data and identification of faulty sensors critical for decision-makers.
We propose a masking approach to assess sensor reliability. Each sensor is individually masked, and state estimates are derived using all other sensors in the network excluding the masked sensor. Comparing these estimates with readings from the masked sensor offers insights into sensor reliability. This research presents a foundational step toward by establishing an online framework that enhances the robust observability and operational efficiency of drinking water systems.

2. Methods

The system states of a WDS include the heads at each node and the flows in each pipe. The governing dynamics of a WDS may be expressed in terms of a state equation and an observation equation:
x t + Δ t = A t x t + B t u t + v t y t = C t x t + w t
where xt is the state vector comprising heads at all nodes, ut is the vector comprising demands at each node, At describes the interconnection between nodes and coupling between heads and flows, Bt is the interconnection between heads and demands, vt is the process noise of the model, yt is the observation vector, Ct is the observation matrix, and wt is the measurement noise of the sensors. The state equation describes how the internal system states evolve over time, while the observation equation describes the observations of the system states (e.g., pressure sensor measurements). To assimilate the sensor observations with model estimates, we employ the Extended Kalman Filter (EKF) [6], which accommodates nonlinearities in the equations describing the WDS states by using the Jacobian of the governing equations at each time step.
In this study, our focus is on pressure sensors installed at storage tanks and junctions within the WDS. Various types of errors can occur in sensor readings [7]. The specific faults we consider include: (i) base shift, where sensor readings have a constant deviation from the ground truth; (ii) noise, where the sensor exhibits random noise exceeding the allowable error range; and (iii) step drift, observed when sensor data suddenly increase or decrease during a certain period.
To detect the faulty sensor, a masking approach is proposed. Each sensor is individually masked, i.e., in each iteration, the measurements from one sensor are considered to be unknown, and state estimates are derived using all the other sensors in the network, excluding the masked sensor. Comparing these estimates with readings from the masked sensor, the most pronounced difference between estimates and readings is most likely indicative of a faulty sensor. To evaluate the difference, we use the median value of the absolute head difference over the entire period as the indicator.

3. Results

The PA1 WDS model is used to showcase the results of this study [8]. The WDS model comprises 2 tanks, 399 pipes, and 337 nodes. Figure 1 illustrates the network schematic, with red highlighted nodes denoting two tank sensors and green highlighted nodes indicating the location of three sensors. The sensor data utilized in this study are generated from the model by adjusting uncertain parameters such as demands at nodes and pipe roughness, thereby reflecting the typical inconsistencies between the hydraulic model and the WDSs. The assumed standard deviations of the measurement noise (sensor uncertainty) and the process noise (model uncertainty) are set at 0.5 m and 0.005 m, respectively.
As illustrated in Figure 2, we consider a specific scenario where incorrect sensor data are introduced at node 433, characterized by noise with a standard deviation of 5 m. By masking (excluding) the sensor at node 433, we assimilate sensor data solely from all other four sensors in the system. Subsequently, we compare the EKF estimates with the measurements at node 433. From Figure 2, it is evident that the masked sensor at node 433 exhibits the greatest discrepancy between its measured values and our estimates.
By injecting the same error at node 433 and employing the same approach to all the sensors, wherein each sensor is masked individually, we assimilate data from all other sensors to derive estimated values and compare them with the masked sensor data. Given the EKF’s capability to provide accurate estimates, a significant discrepancy between the estimation and the masked sensor data suggests potential sensor faultiness. As depicted in Figure 3, the difference between the estimates from EKF and the masked sensor data is most pronounced for the sensor at node 433, precisely where erroneous sensor data were introduced. In summary, in this specific instance, the application of EKF combined with our masking operation effectively identifies the faulty sensor.
To evaluate the effectiveness of our approach in identifying the faulty sensor under various error types, including base shift, noise, and step drift, we applied the same methodology, injecting erroneous sensor data into the sensor at node 433. In Figure 4, we compare the difference when masking different sensors under different error scenarios. For each sensor (x-axis), the marker indicates the median head difference between the given sensor data and the EFK estimates when the sensor is masked, and the gray boxplots indicate the distribution of these differences when each of the other sensors is masked (one at a time). The blue and the red markers indicate normal and faulty sensors, respectively.
From Figure 4, it is evident that the median values of the faulty sensor at node 433 (red marker) consistently exhibit the highest values compared to the other sensors, indicating that for this case study, the approach consistently succeeds in detecting the faulty sensor across all five error scenarios. In the scenario of step drift, the erroneous data persist for only four hours. In the last subfigure of Figure 4, the median value of the correct tank sensor 338 is very close to that of the faulty sensor 433. However, as depicted in the first and the last subfigures of Figure 4, this approach also entails the risk of mislabeling when the sensor error is relatively small or in short-lived drift cases.

4. Conclusions

In this research, we employ the EKF for state estimation in WDSs, integrating information from hydraulic models with sensor measurements to provide an accurate representation of real-time system dynamics. We then propose a masking approach for identifying faulty sensors, wherein each sensor is masked separately, and the predictions are compared with measurements at the masked sensor. Through evaluation on a benchmark network, the proposed approach demonstrates promising capabilities in detecting sensor faults under various types of errors. Ongoing work includes considering multi-sensor faults and assessing the proposed approach in more realistic settings.

Author Contributions

Conceptualization, L.S.; methodology, L.S., M.B., Y.H. and M.T.; software, M.B.; formal analysis, Y.H.; writing—original draft preparation, Y.H.; writing—review and editing, L.S., M.B. and M.T.; supervision, L.S.; funding acquisition, L.S. All authors have read and agreed to the published version of the manuscript.

Funding

This work was supported in part by the National Science Foundation under Grants 1943428 and 2220516.

Institutional Review Board Statement

Not applicable.

Informed Consent Statement

Not applicable.

Data Availability Statement

The raw data supporting the conclusions of this article will be made available by the authors on request.

Conflicts of Interest

The authors declare no conflicts of interest.

References

  1. Xing, L.; Sela, L. Graph Neural Networks for State Estimation in Water Distribution Systems: Application of Supervised and Semisupervised Learning. J. Water Resour. Plan. Manag. 2022, 148, 04022018. [Google Scholar] [CrossRef]
  2. Zhou, X.; Zhang, J.; Guo, S.; Liu, S.; Xin, K. A convenient and stable graph-based pressure estimation methodology for water distribution networks: Development and field validation. Water Res. 2023, 233, 119747. [Google Scholar] [CrossRef] [PubMed]
  3. Yu, X.; Wu, Y.; Meng, F.; Zhou, X.; Liu, S.; Huang, Y.; Wu, X. A review of graph and complex network theory in water distribution networks: Mathematical foundation, application and prospects. Water Res. 2024, 253, 121238. [Google Scholar] [CrossRef] [PubMed]
  4. Zhou, X.; Liu, S.; Xu, W.; Xin, K.; Wu, Y.; Meng, F. Bridging hydraulics and graph signal processing: A new perspective to estimate water distribution network pressures. Water Res. 2022, 217, 118416. [Google Scholar] [CrossRef] [PubMed]
  5. Bartos, M.; Kerkez, B. Pipedream: An interactive digital twin model for natural and urban drainage systems. Environ. Model. Softw. 2021, 144, 105120. [Google Scholar] [CrossRef]
  6. Simon, D. Optimal State Estimation: Kalman, H Infinity, and Nonlinear Approaches; John Wiley & Sons: New York, NY, USA, 2006. [Google Scholar]
  7. Lu, J.; Liu, A.; Dong, F.; Gu, F.; Gama, J.; Zhang, G. Learning under Concept Drift: A Review. IEEE Trans. Knowl. Data Eng. 2018, 31, 2346–2363. [Google Scholar] [CrossRef]
  8. Boccelli, D. “02 PA 1”. US Systems. 2. 2016. Available online: https://uknowledge.uky.edu/wdst_us/2 (accessed on 26 March 2024).
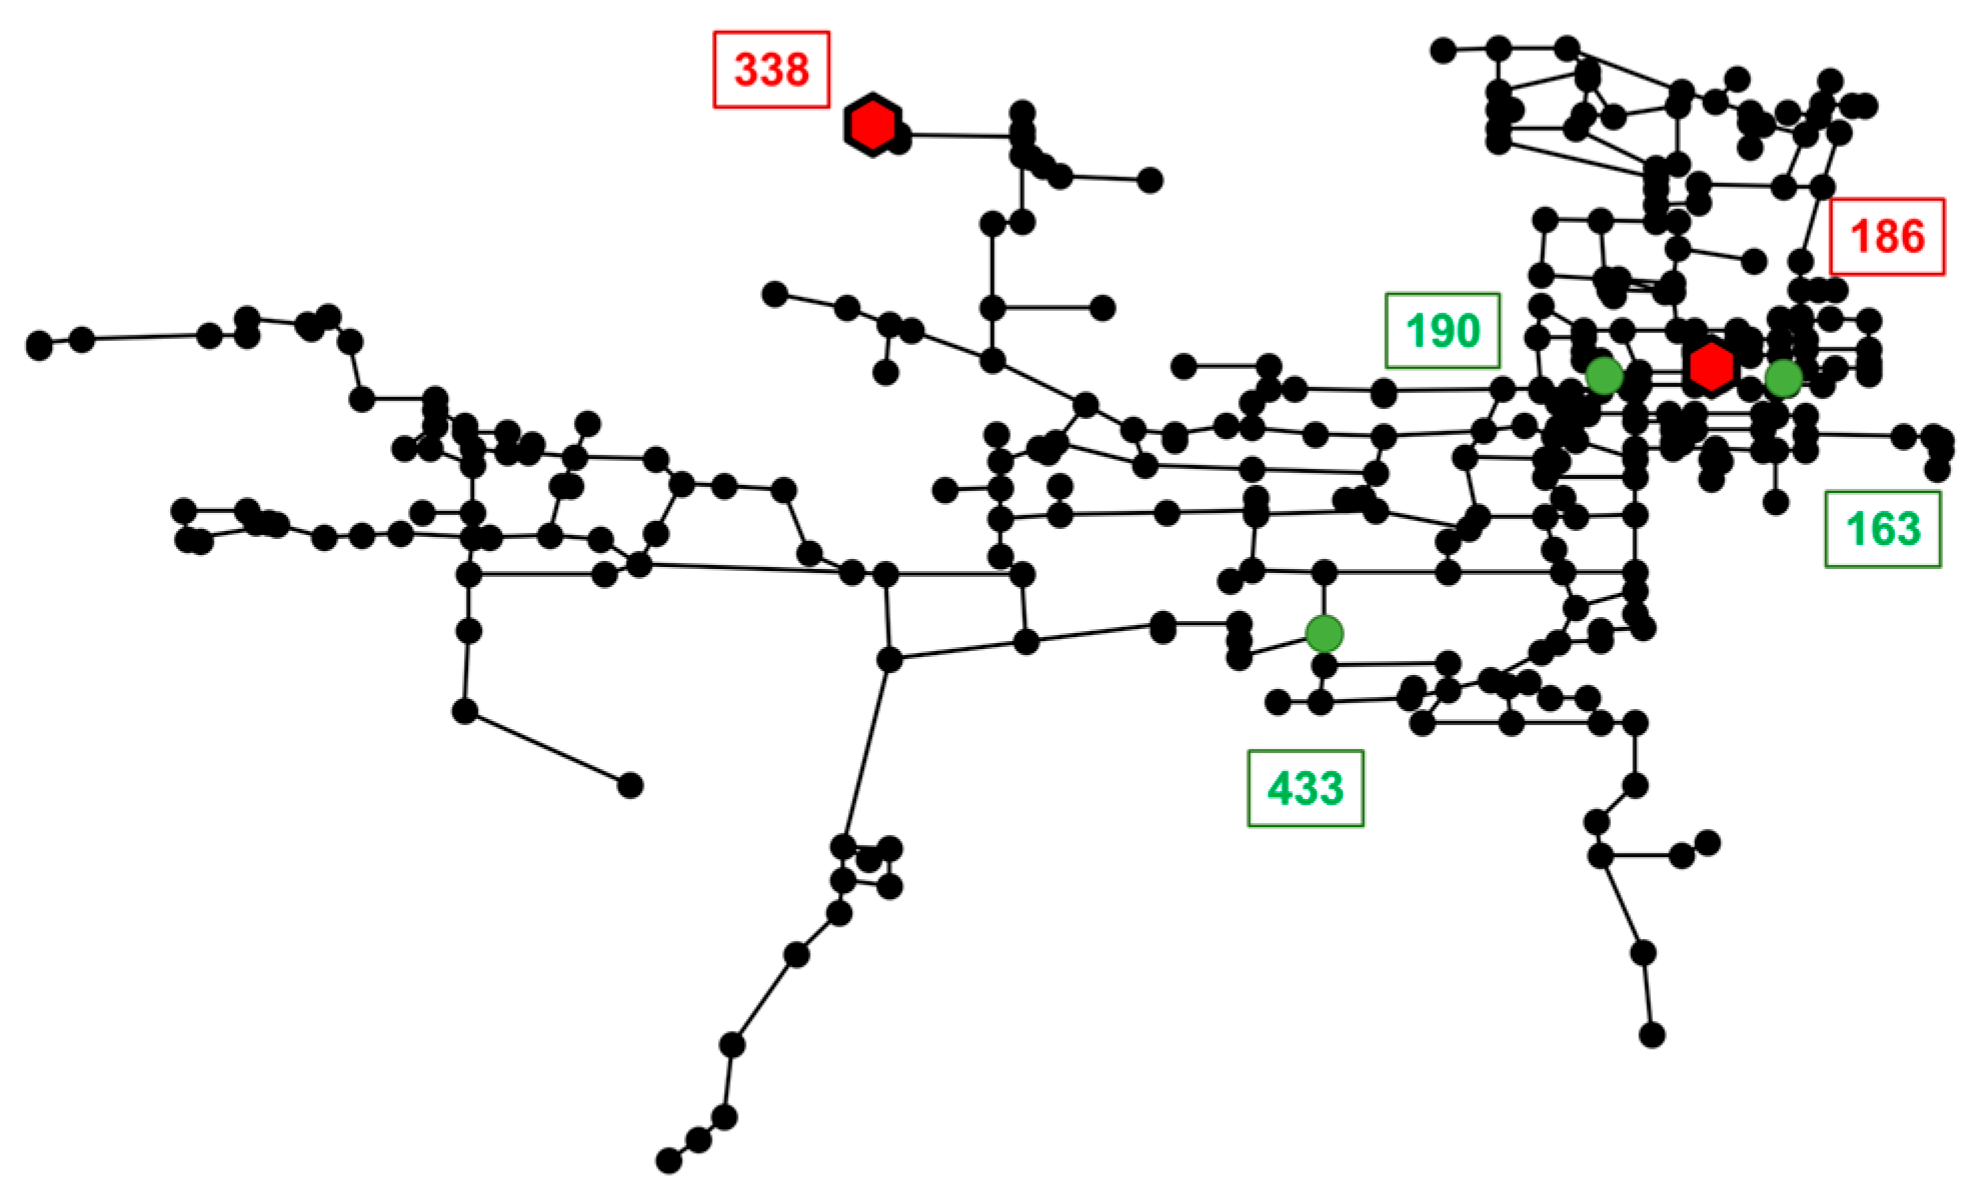
Figure 1. Schematic of PA1 networks. Sensor locations are highlighted; tanks (red), inner nodes (green).
Engproc 69 00028 g001
Figure 2. Time series results of heads at sensor locations. Hydraulic model estimates (blue), EKF estimates (dotted black), normal sensor measurements (teal), and faulty sensor measurements (red) with a noise level of 5 m standard deviation. The red boxed subfigure indicates that the sensor at node 433 is masked.
Engproc 69 00028 g002
Figure 3. Absolute difference between sensor data and the EKF estimates when masking different sensors. Each line corresponds to a scenario where a particular sensor is masked.
Engproc 69 00028 g003
Figure 4. Median absolute head difference under different types of faulty sensor data. Each column represents the case when the corresponding sensor is masked.
Engproc 69 00028 g004
Disclaimer/Publisher’s Note: The statements, opinions and data contained in all publications are solely those of the individual author(s) and contributor(s) and not of MDPI and/or the editor(s). MDPI and/or the editor(s) disclaim responsibility for any injury to people or property resulting from any ideas, methods, instructions or products referred to in the content.