Proceeding Paper

A Comprehensive Virtual Testbed for Modeling Disinfection Byproduct Formation in Water Distribution Networks †

KIOS Research and Innovation Center of Excellence, University of Cyprus, Nicosia 2109, Cyprus
*
Author to whom correspondence should be addressed.
Presented at the 3rd International Joint Conference on Water Distribution Systems Analysis & Computing and Control for the Water Industry (WDSA/CCWI 2024), Ferrara, Italy, 1–4 July 2024.
Eng. Proc. 2024, 69(1), 33; https://doi.org/10.3390/engproc2024069033
Published: 2 September 2024

Abstract

:
Drinking water disinfection by water utilities aims to ensure the safety and high quality of the provided water; however, it can pose a threat to human health due to the formation of disinfection byproducts (DBPs). The prediction and modeling of DBPs are challenging tasks due to the complex reactions within water distribution networks (WDN). To address this challenge, we introduce a virtual testbed based on a realistic WDN in Cyprus that utilizes the EPANET and EPANET-MSX engines to model multi-species reactions for the execution of simulation experiments under various conditions regarding the formation and fate of two families of DBPs within WDNs.

1. Introduction

Ensuring safe drinking water involves disinfection using chlorine-based agents by water utilities. Although effective against pathogens, these agents can react with water’s organic and inorganic compounds, leading to the formation of undesirable disinfection byproducts (DBPs). Therefore, due to the complex interactions that take place within water distribution networks (WDN), their prediction and modeling are challenging. In response to these issues, several mathematical models have been developed by the research community [1,2,3]; however, these typically try to capture part of the reaction kinetics. Further, some of these mathematical models have been integrated into simulation tools, utilizing the EPANET software and its EPANET-MSX extension. They have been used on an ad-hoc basis for demonstrating various interactions between the dynamic states of the different agents [1,4]. Complementary toolkits such as the EPANET-MATLAB toolkit [5], which enables the use of MATLAB’s simulation capabilities, were used to integrate EPANET-MSX to facilitate the modeling of multi-species reaction dynamics and consider a variety of scenarios and uncertainties [1]. Although the aforementioned tools offer the capability of modeling and visualizing the formation of DBPs within WDN, there is currently no open benchmark that can be used as a common reference for researchers in the field. To address these challenges, we introduce a comprehensive virtual testbed that utilizes the EPANET and EPANET-MSX engines to model multi-species reactions for the execution of simulation experiments, considering multiple scenarios and uncertainties regarding the formation and fate of various families of DBPs within WDN.

2. Materials and Methods

2.1. Benchmark Network

We introduce a new benchmark WDN, namely, the “CY-DBP” model, based on a realistic system in Cyprus and modified for security purposes. The proposed model comprises a District Metered Area (DMA) level distribution network with 31.2 km of pipes that serves a residential area of approximately 12,000 people and has a daily average demand of 1800 m3. The system can receive water from a Drinking Water Treatment Plant (DWTP) and from a Desalination Plant during periods with low surface water reserves or mixed water from both sources. In all cases, water is re-chlorinated in a main water tank before being transferred to the DMA. This model was developed through the EPANET hydraulic simulator by utilizing GIS and CAD data. Consumer billing data, flow, and pressure measurements acquired from the SCADA system were utilized to model the consumer demands and to calibrate the hydraulics of the network.

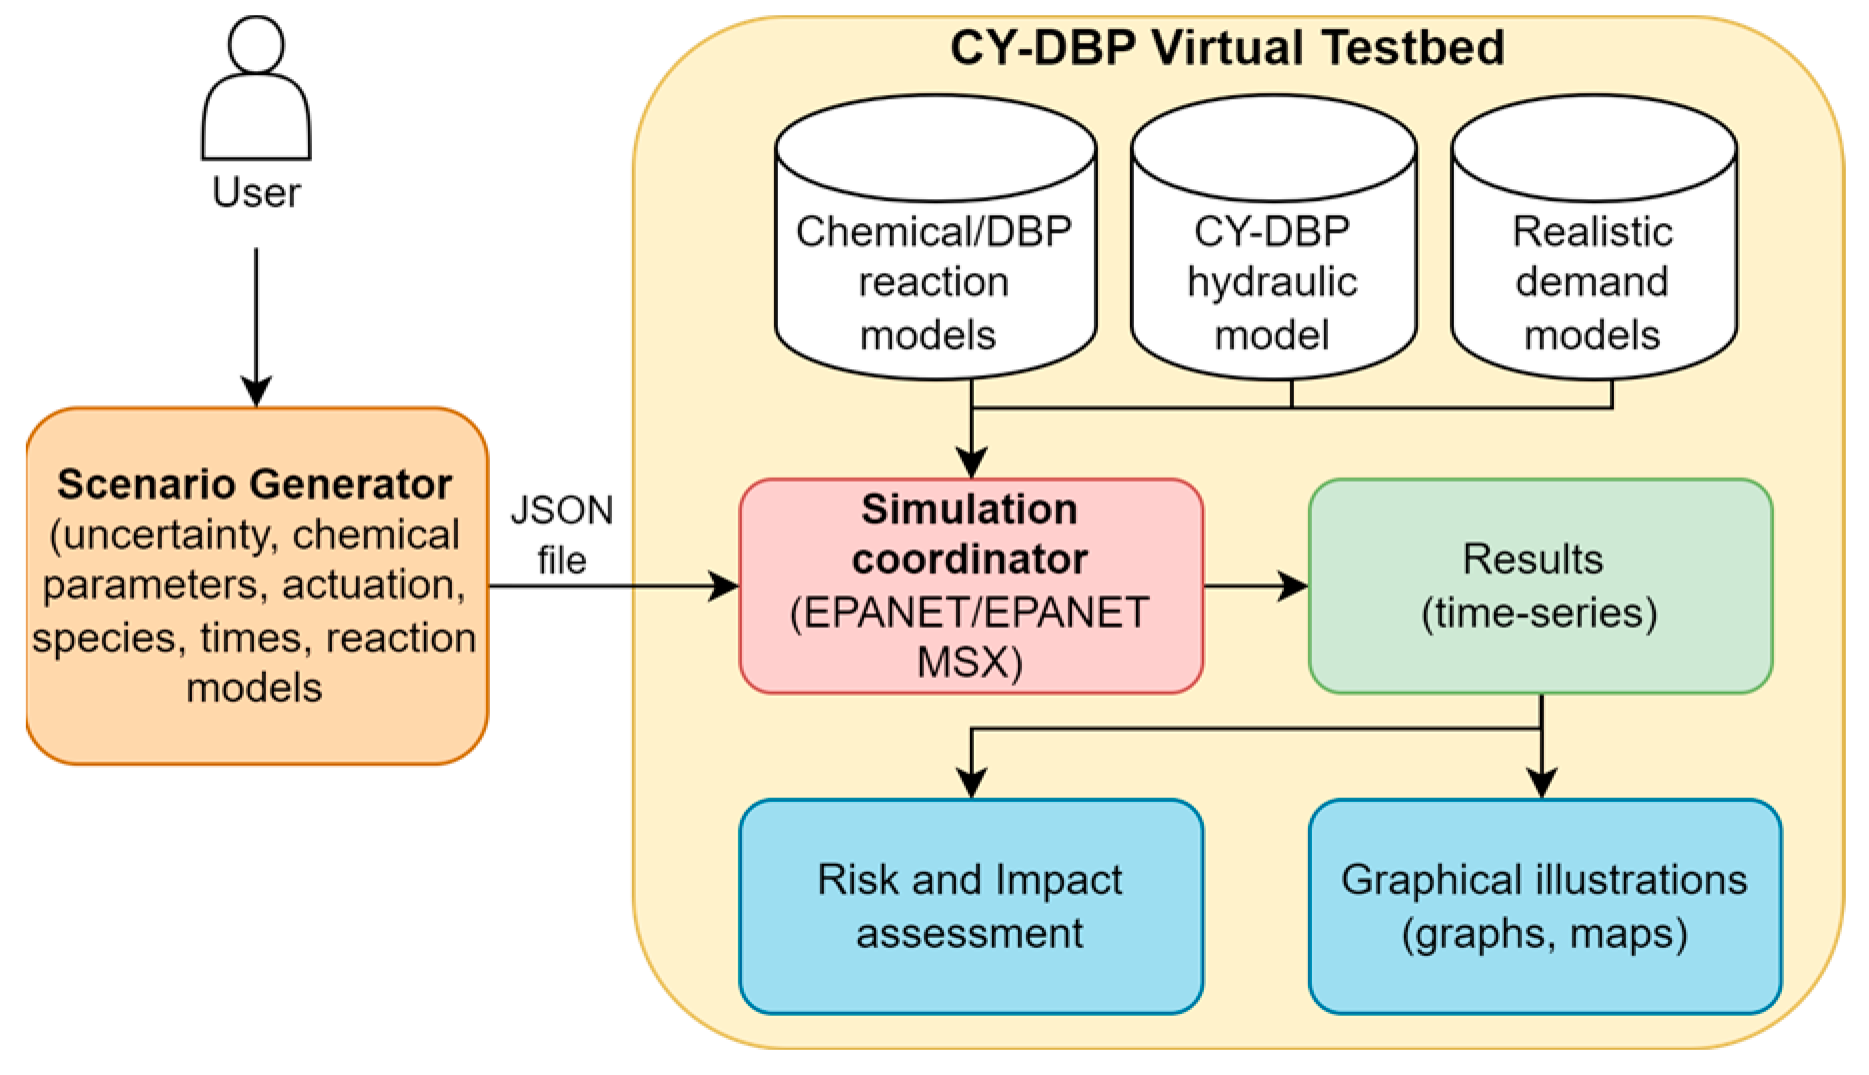
2.2. Virtual Testbed Design

The proposed testbed is built using the EPANET-MATLAB Toolkit [5], an open source software developed by KIOS CoE, and is designed so that it allows the users to test the effect of various chemical prediction models and parameters in the formation of DBPs by utilizing the EPANET and EPANET-MSX engines (Figure 1). The user can use stored equations and parameters, alter them, or load new ones as MSX files. Further, it allows the user to investigate the effects of uncertainty in a series of parameters with respect to the formation of DBPs. The users can simulate a variety of scenarios depending on the initial disinfectant and natural organic matter levels at the available water sources and considering the operational status of the network’s valves and actuators. Finally, the testbed can calculate pre-defined health risks and/or impact metrics related to DBPs.

2.3. Water Quality Dynamics
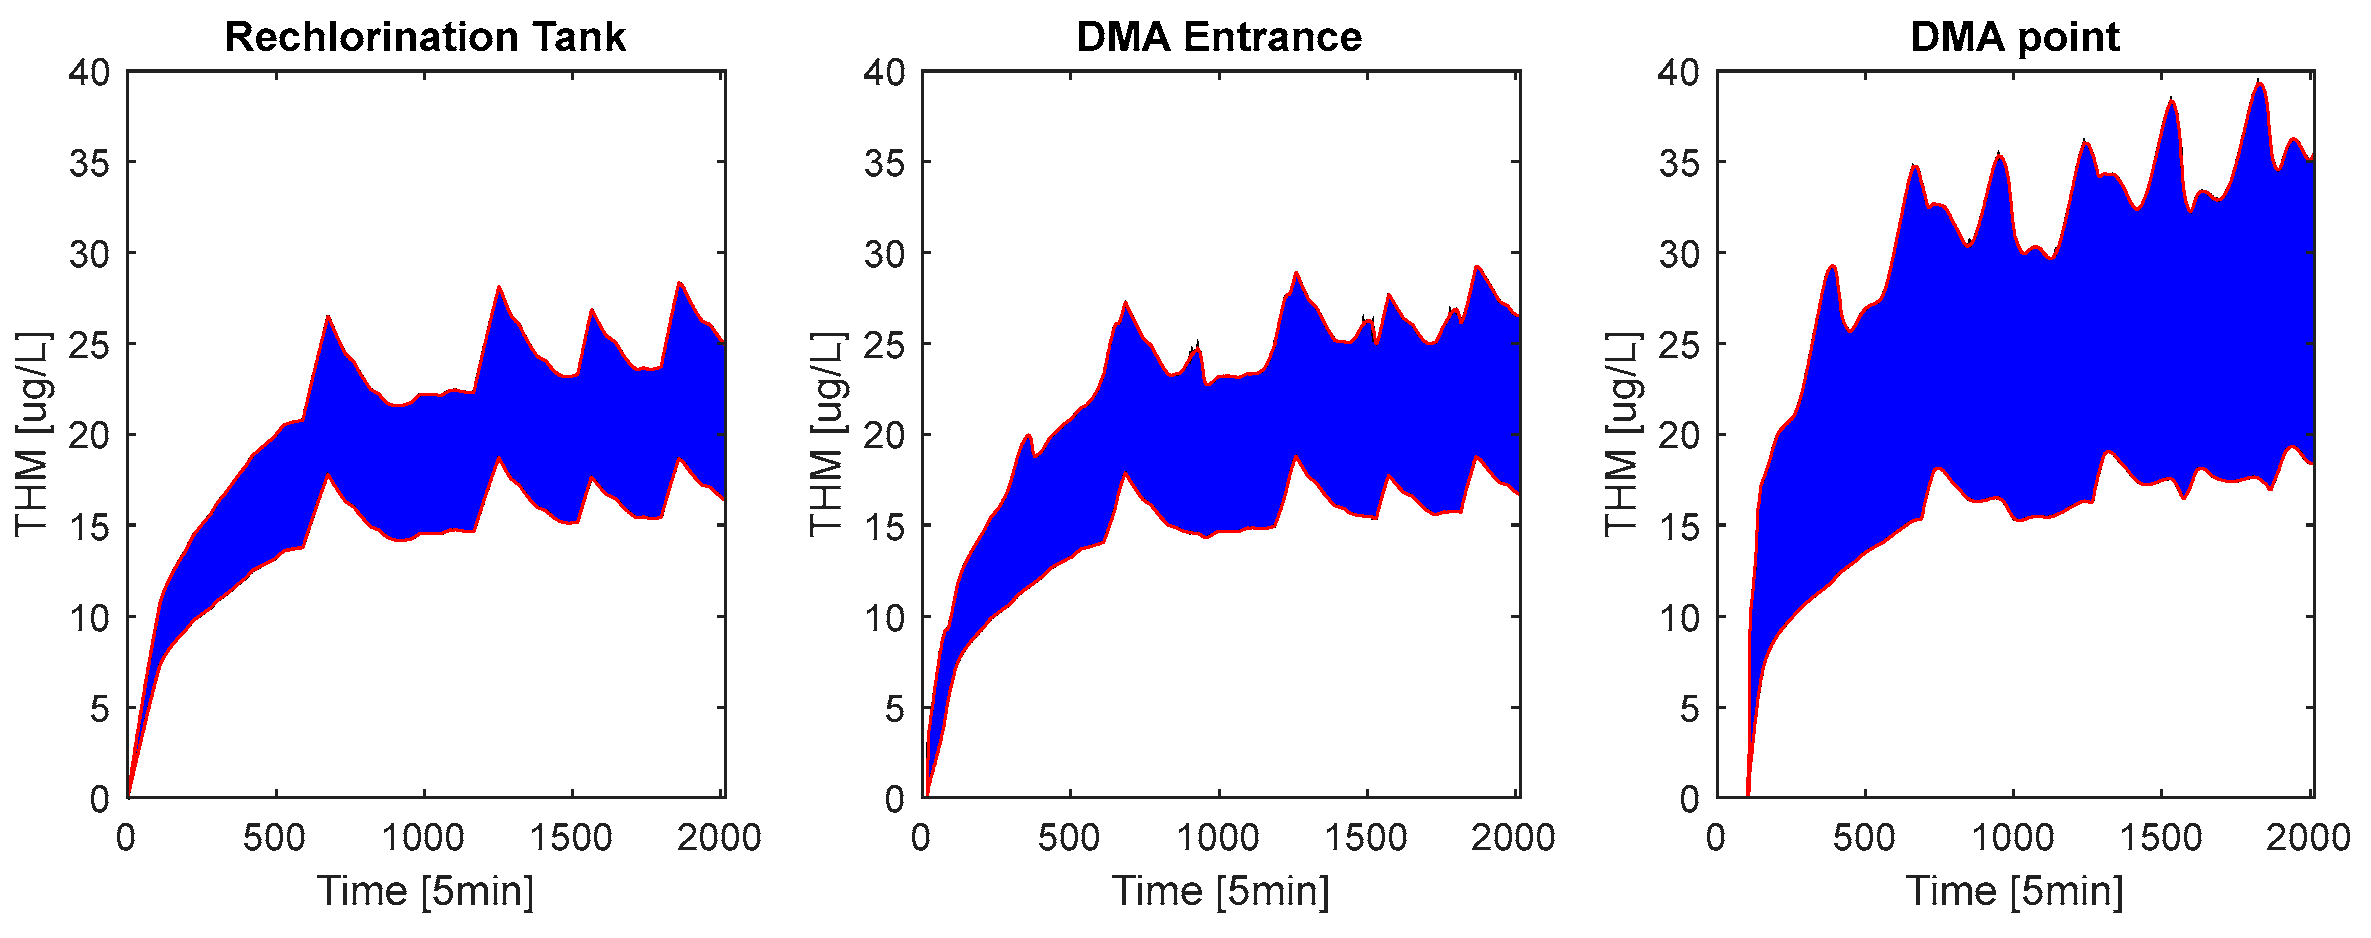
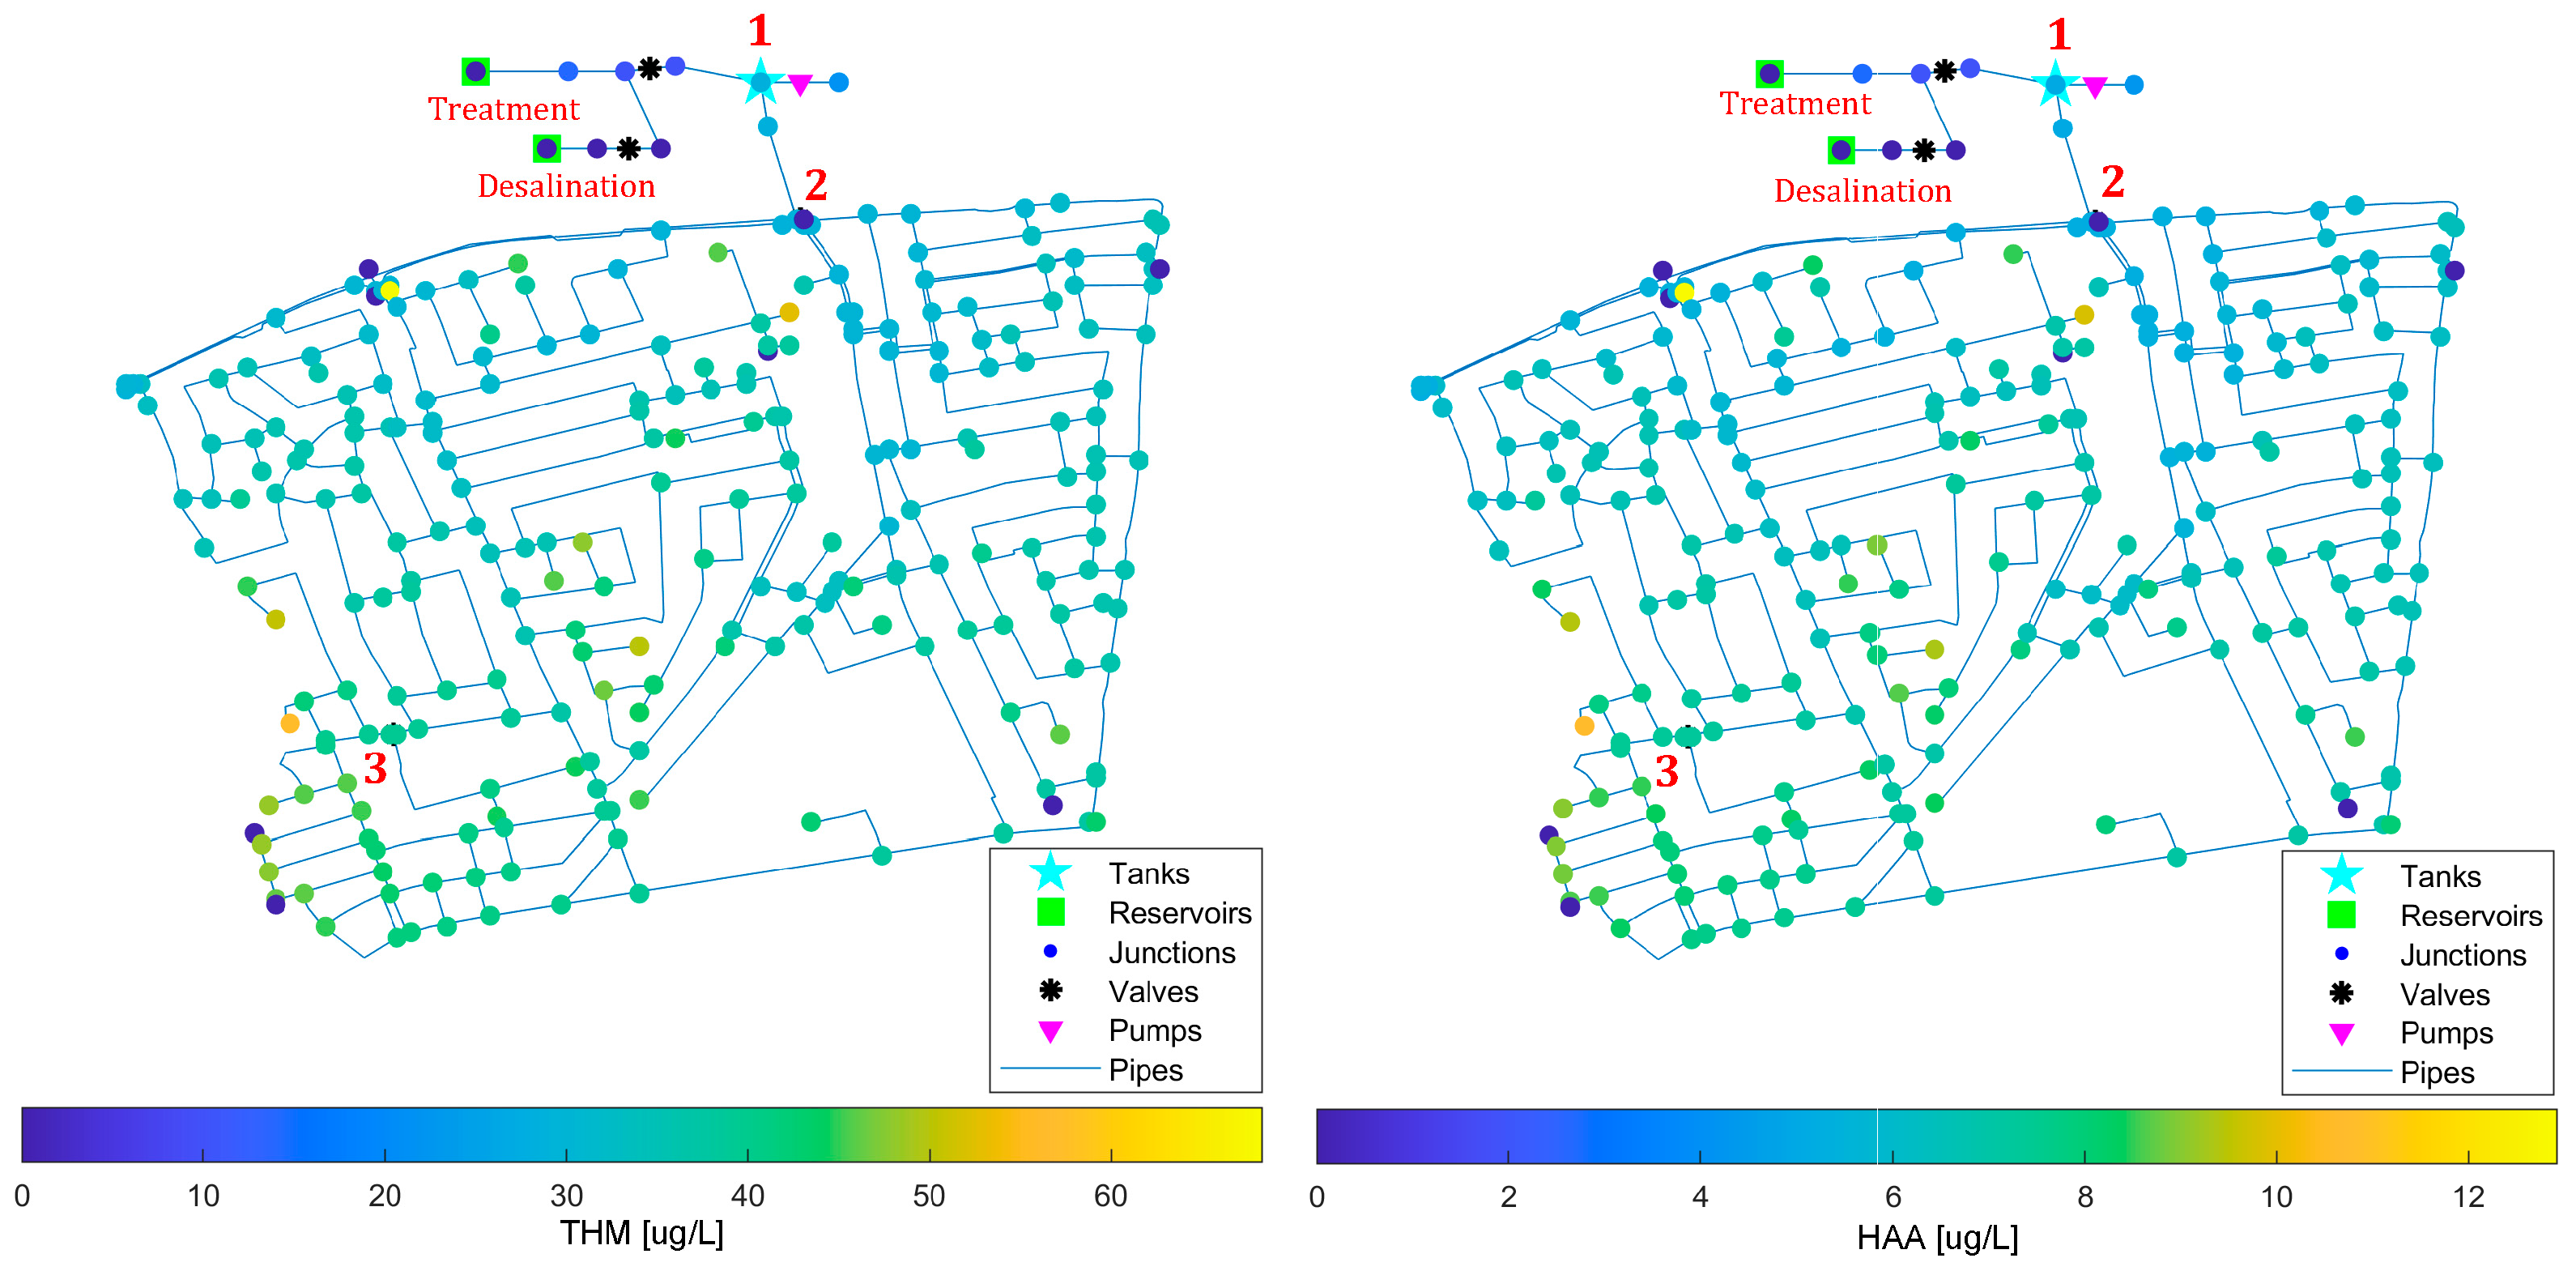
In this study, we consider the reactions between the following four species: chlorine as the main disinfectant C C l (mg/L); Total Organic Carbon (TOC) as the representative of the Natural Organic Matter (NOM) acting as slow (SRA) C T O C S   ( m g / L ) ; fast reducing agent (FRA) C T O C F (mg/L) of chlorine and trihalomethanes (THM) C T H M (mg/L); and halo-acetic acids (HAA) C H A A (mg/L), as DBPs. Chlorine decay due to the reactions with TOC in the bulk phase and due to reactions with biofilm on the pipe walls is generally described as follows [6,7]:
d C C l d t T o t a l = d C C l d t B u l k + d C C l d t W a l l .
There is a TOC degradation component due to its reaction with chlorine. THM and HAA formation is described by the following Equations (2) and (3):
d C T H M d t = Y T H M ( k F R A   C T O C F   C C l + k S R A   C T O C S   C C l ) ,
d C H A A d t = Y H A A ( k F R A   C T O C F   C C l + k S R A   C T O C S   C C l )
where Y T H M (μg-THM/mg-CL) and Y H A A (μg-HAA/mg-CL) are the yield coefficients for the formation of THM and HAA, respectively, due to the reactions between chlorine and TOC, and k F R A and k S R A (L/mgh) are the FRA and SRA decay rate coefficients, respectively.

3. Results

Using the developed benchmark network, we examined the effect of three uncertain parameters: (1) The ratio of drinking water acquired from each source (desalination or DWTP) practically affecting the bulk TOC concentration and the yield coefficients; (2) YTHM and (3) YHAA, on the formation of THM and HAA. A simulation experiment of 7 days was performed. Chlorination is introduced at three points, at the two main water sources and the re-chlorination tank. The daily and weekly variation in chlorine is considered by utilizing time series data retrieved from on-the-field chlorine sensors. Re-chlorination is simulated using the mass booster method. The following parameters are considered: CCl = 0.2–0.5 mg/L; MCl = 200 mg/minute (mass of chlorine injected at re-chlorination tank); CTOC = 0.8–1.2 mg/L; YTHM = 30–180 μg-THM/mg-CL; and YHAA =15–35 μg-HAA/mg-CL.
Time series results are presented at the outlet of the re-chlorination tank, the entrance, and a critical point (CP) of the DMA (Figure 2 and Figure 3, respectively). The latter point was selected after considering the network’s water resident time. As shown, the concentration of THM ranges between 10 and 28 μg/L at the re-chlorination tank and the DMA entrance and between 10 and 40 μg/L at the CP. The corresponding HAA concentrations range between 2 and 5 μg/L and between 2 and 7 μg/L. Higher TOC initial concentration leads to higher DBP concentrations. Further, maps with the maximum concentration of the selected DBP families, considering the maximum TOC concentration and the highest yield coefficients, indicate the high-risk areas of the network (Figure 4). The effect of the network’s residence time is noticed, with nodes located further from the source being more vulnerable to the formation of DBPs.

4. Conclusions

In this work, we introduce a new virtual testbed based on a real system to conduct simulation experiments focusing on the modeling of multi-species reactions that lead to the formation of DBPs within WDNs under various scenarios and uncertainties. The provided testbed can be used as a common reference for the application and comparison of various chemical reaction models. Future work will aim to develop a user-friendly environment to facilitate simulations and generate benchmark datasets that can be used for data-driven machine-learning research.

Author Contributions

Conceptualization, all; methodology, P.P., S.G.V. and D.G.E.; software, P.P., M.K.; validation, P.P.; formal analysis, P.P.; investigation, all; data curation, P.P.; writing—original draft preparation, P.P.; writing—review and editing, all; visualization, P.P. and M.K.; supervision, S.G.V. and D.G.E. All authors have read and agreed to the published version of the manuscript.

Funding

This work is co-funded by the European Union’s Horizon Europe Research and Innovation program under grant agreement No. 101081728 (IntoDBP), the EU H2020, and Rep. of Cyprus through the DMRID under the KIOS CoE project (739551).

Institutional Review Board Statement

Not applicable.

Informed Consent Statement

Not applicable.

Data Availability Statement

All data, models, or code generated during this study are available in the following online repository: https://github.com/KIOS-Research/dbp-virtual-water-testbed (accessed on 30 June 2024).

Conflicts of Interest

The authors declare no conflicts of interest.

References

  1. Kyriakou, M.; Eliades, D.G.; Polycarpou, M.M. dbpRisk: Disinfection By-Product Risk Estimation. In Proceedings of the Critical Information Infrastructures Security (CRITIS), Limassol, Cyprus, 13–15 October 2014. [Google Scholar] [CrossRef]
  2. Sathasivan, A.; Kastl, G.; Korotta-Gamage, S.; Gunasekera, V. Trihalomethane species model for drinking water supply systems. Water Res. 2020, 184, 116189. [Google Scholar] [CrossRef] [PubMed]
  3. Premarathna, S.M.; Kastl, G.; Fisher, I.; Sathasivan, A. Model for halo-acetic acids formation in bulk water of water supply systems. Sci. Total Environ. 2023, 857, 159267. [Google Scholar] [CrossRef] [PubMed]
  4. Fisher, I.H. Integrated EPANET-MSX process models of chlorine and its by-products in drinking water distribution systems. Water Environ. Res. 2023, 95, e10949. [Google Scholar] [CrossRef] [PubMed]
  5. Eliades, D.G.; Kyriakou, M.; Vrachimis, S.G.; Polycarpou, M.M. EPANET-MATLAB Toolkit: An Open-Source Software for Interfacing EPANET with MATLAB. In Proceedings of the Computing and Control for the Water Industry (CCWI), Amsterdam, The Netherlands, 7–9 November 2016. [Google Scholar] [CrossRef]
  6. Fisher, I.; Kastl, G.; Sathasivan, A. A comprehensive bulk chlorine decay model for simulating residuals in water distribution systems. Urban. Water J. 2017, 14, 4. [Google Scholar] [CrossRef]
  7. Fisher, I.; Kastl, G.; Sathasivan, A. New model of chlorine-wall reaction for simulating chlorine concentration in drinking water distribution systems. Water Res. 2017, 125, 427–437. [Google Scholar] [CrossRef] [PubMed]
Figure 1. Diagram illustrating the architecture of the CY-DBP virtual testbed.
Engproc 69 00033 g001
Figure 2. Simulated THM concentration bounds (red lines) at three locations, indicating the range in which this parameter may vary (blue area).
Engproc 69 00033 g002
Figure 3. Simulated HAA concentration bounds (red lines) at three locations, indicating the range in which this parameter may vary (blue area).
Engproc 69 00033 g003
Figure 4. Maximum THM (left) and HAA (right) concentration per node in μg/L. Sensors exist at numbered points: (1) re-chlorination tank; (2) DMA entrance; (3) DMA point.
Engproc 69 00033 g004
Disclaimer/Publisher’s Note: The statements, opinions and data contained in all publications are solely those of the individual author(s) and contributor(s) and not of MDPI and/or the editor(s). MDPI and/or the editor(s) disclaim responsibility for any injury to people or property resulting from any ideas, methods, instructions or products referred to in the content.

