1. Introduction
Approximately one billion people live with a piped water connection that operates intermittently, meaning they receive water for only a fraction of the day or week [
1]. Intermittent water supply (IWS) can be a barrier to providing the served community with universal and equitable access to safe drinking water (SDG target 6.1). Improved management of IWS systems has the potential to reduce the impacts of intermittency and enable a transition to continuous water supply (CWS).
Hydraulic models are widely used by managers of CWS networks to aid in the design, operation, and optimisation of the network. Models are only effective if the chosen inputs are appropriate for the desired output of the model. Consumer demand directs much of the hydraulic behaviour in the network and is, therefore, a critical input parameter [
2]. Under IWS conditions, consumer withdrawal characteristics are fundamentally different to those under CWS; withdrawal is limited to when water is available, and households often fill storage containers to provide water during the “off” periods [
3].
The challenge of representing consumer demand under IWS conditions has been highlighted as an area requiring more research [
4]. Currently, there are three prevailing methods: (i) Unrestricted (which assumes all consumers have their taps constantly open), (ii) volume-restricted (which assumes households withdraw water until their storage is filled), and (iii) flow-restricted (which assumes the demand of a household is just satisfied by the end of the supply period) [
5]. The different approaches affect the speed at which households achieve their desired demand. Therefore, when using a hydraulic model to assess inequalities in supply, predictions will vary significantly if a supply period is reduced [
5]. Currently, there is little evidence from IWS networks to support or contradict the use of different modelling approaches; this study aims to address that gap.
2. Materials and Methods
Quantitative measurements of household water withdrawal were performed alongside qualitative household survey data. Fifty-six smart meters were installed on the inlet pipe to the household, measuring the total household water withdrawal on a minute-by-minute basis. The meters recorded ten months of data starting from January 2023. The case study site (Lahan, Nepal) was a town in the flat Terai region of south-eastern Nepal with a total elevation change of 15 m. The piped network serves 4200 connections (approximately 21,000 people), 55% of the urban population. The network consists of one overhead tower fed by five boreholes and five further satellite boreholes that feed directly into the 93 km network. There are two supply periods per day that operate on a relatively regular and reliable basis from 5–8 AM and 5–8 PM daily. The survey collected household information and water management practices such as the number of users, installed storage volume, and use of other water sources.
3. Results
The smart meter data were processed to investigate the nature of withdrawal instances. A withdrawal instance is defined as any continuous withdrawal of water, i.e., periods where the meters record a non-zero flow.
Figure 1 shows that 40% of withdrawal instances have a volume of fewer than two litres, and 90% of instances are less than 33 L (each bar represents one litre). It should be noted that the meters register a pulse for every withdrawal that moves the meter dial across the litre threshold. Therefore, a one-litre withdrawal may comprise anything between zero and two litres. The horizontal axis of
Figure 1 has also been cut to a maximum of 100 L to improve the visualisation of the data; instances greater than 100 L do occur (and are significant), but their relative frequency is such that they would not be visible in this plot.
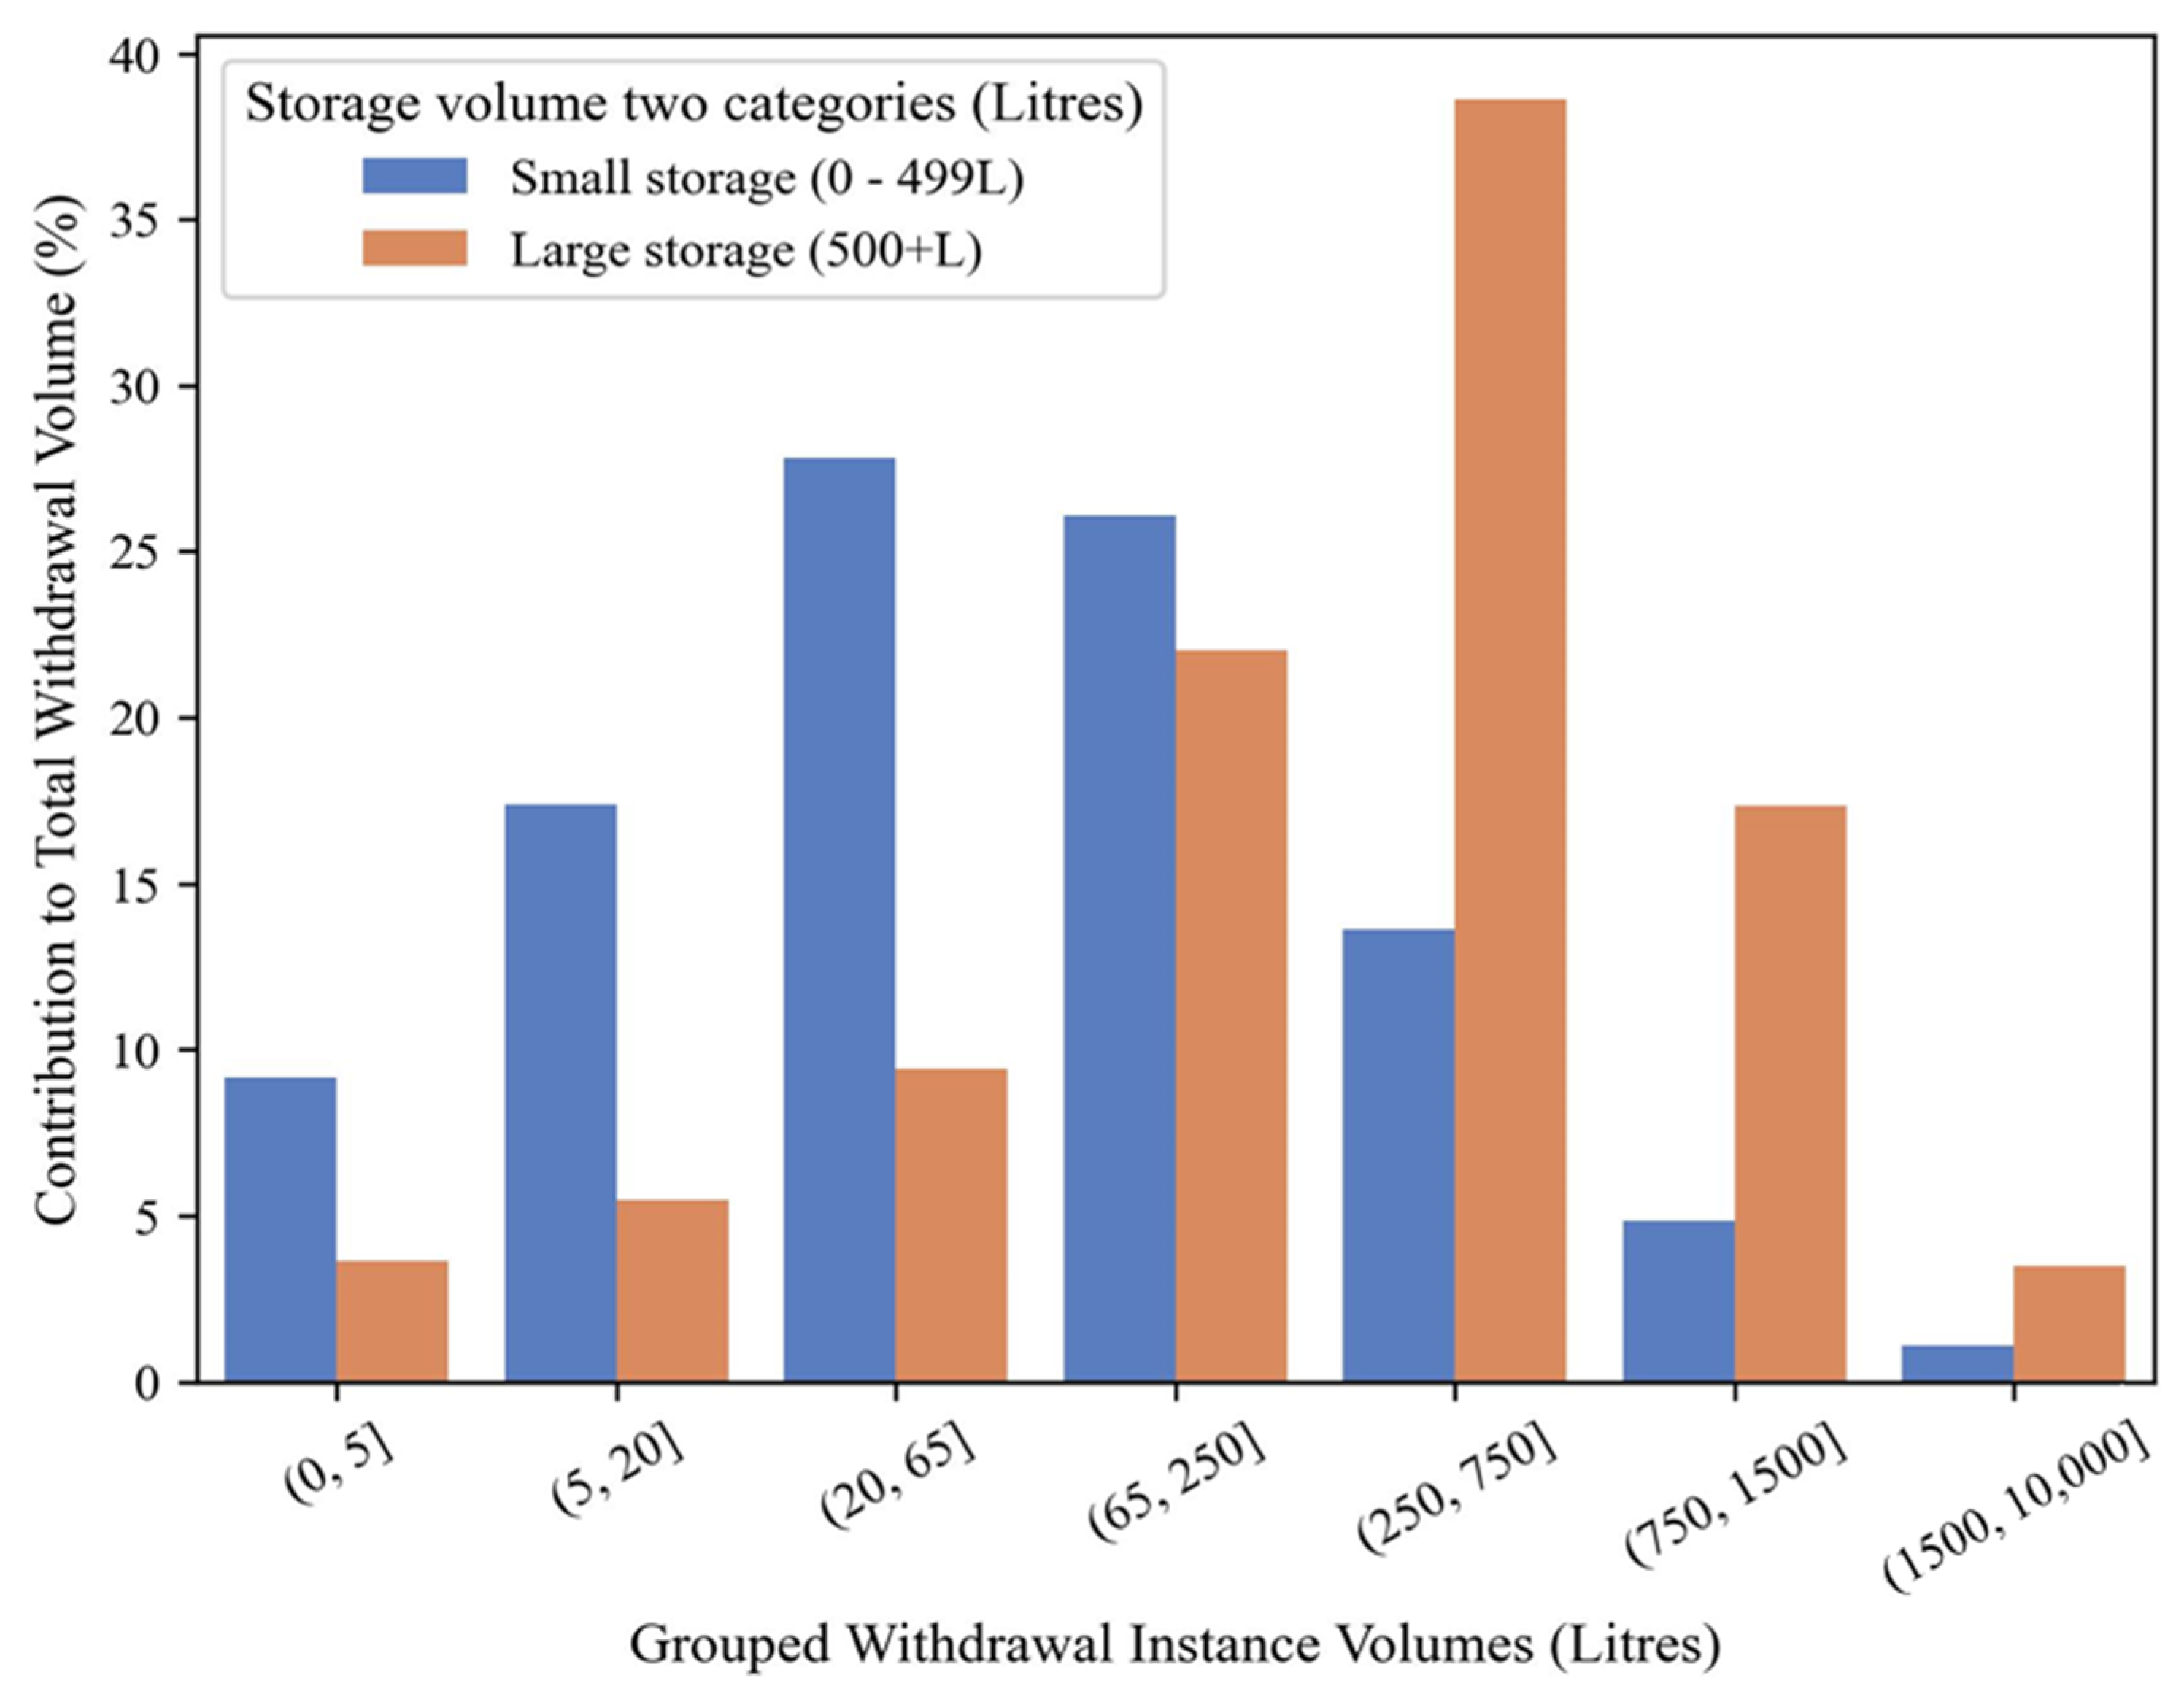
In
Figure 2, the withdrawal instances are grouped into seven discrete ranges according to their associated volume. The contribution of each group to the total water consumption of the household over the measured period is plotted on the vertical axis. To enable comparison, households are separated into those with small storage volumes (defined as less than 500 L) and high storage volumes (defined as 500 L and above). The first insight
Figure 2 provides is in contrast to
Figure 1; although the larger volume withdrawals are much less frequent, their contribution to the total withdrawn volume of households is significant. Secondly, the extent to which different instance volumes contribute to the overall consumption of the households varies. Specifically, households with larger storage volumes tend to withdraw piped water via large-volume withdrawals more than households with small storage (as might be expected).
4. Discussion
The recorded water withdrawals in Lahan show a range of withdrawal behaviours that can be categorised into small direct-use and large tank-filling practices. Current methods of modelling consumers do not incorporate the high-frequency, low-magnitude withdrawals that reflect the direct use of the piped water. In addition, the tendency of a household’s water withdrawal make-up to be dominated by either direct-use or tank-filling varies according to the households’ assets. This variation is also not represented in current methods of modelling consumers using hydraulic IWS models. However, the necessity to incorporate these complexities depends on the desired output of the model.
For network design, the common practice is to use lumped demands at nodes. Under this scenario, the simplifications of homogenous unrestricted or volume-restricted demands may represent reasonable worst-case scenarios that are helpful for design decisions such as sizing pipes. However, the aim of many modelling efforts in the literature is to model the inequality or inequity of water supply. For these purposes, precise demands are more pertinent as they affect the distribution of water across the network. In addition, when quantifying consumer demand satisfaction [
6], a household with the same availability of water from one network to another but less storage volume may be unable to practically withdraw as much water, resulting in a different satisfaction score and, hence, inequality.
IWS networks exhibit a broad spectrum of supply regimes; this study revealed only a small window of this spectrum. Therefore, these findings must be applied to other circumstances with care and consideration.
5. Conclusions
Field measurements have identified a range of withdrawal types practised by households that are not currently reflected in hydraulic IWS models;
Consumer demand profiles vary between different households and household storage volume appears to be a key determining factor;
More research is required to understand the variation in withdrawal behaviour between different IWS networks and supply regimes.
Author Contributions
Conceptualization, M.M., R.C., V.S. and S.W.; formal analysis, M.M.; resources, K.P. and R.P.; writing—original draft preparation, M.M.; writing—review and editing, R.C., V.S. and S.W.; supervision, R.C., V.S. and R.P.; project administration, K.P. and R.P.; funding acquisition, R.P. All authors have read and agreed to the published version of the manuscript.
Funding
This research was funded by an Engineering and Physical Sciences Research Council (EPSRC) studentship as part of the Centre for Doctoral Training in Water Infrastructure and Resilience, grant number EP/S023666/1, with support from the Anglian Water Alliance and WaterAid through The Beacon Project.
Institutional Review Board Statement
This study was conducted in accordance with the Declaration of Helsinki and approved by the Ethics Committee of the University of Sheffield (protocol code 049120 30/08/2022).
Informed Consent Statement
Informed consent was obtained from all subjects involved in this study.
Data Availability Statement
The data presented in this study are available at the request of the corresponding author due to their sensitive nature.
Acknowledgments
The collection of data was greatly supported by WaterAid Nepal colleagues alongside staff at the Nepal Water Supply Corporation (NWSC). These data could not have been collected without the dedicated and skilled work of translators, enumerators and plumbers.
Conflicts of Interest
The authors declare no conflicts of interest.
References
- Bivins, A.W.; Sumner, T.; Kumpel, E.; Howard, G.; Cumming, O.; Ross, I.; Nelson, K.; Brown, J. Estimating Infection Risks and the Global Burden of Diarrheal Disease Attributable to Intermittent Water Supply Using QMRA. Environ. Sci. Technol. 2017, 51, 7542–7551. [Google Scholar] [CrossRef] [PubMed]
- Speight, V.; Khanal, N.; Savic, D.; Kapelan, Z.; Jonkergouw, P.; Agbodo, M. Guidelines for Developing, Calibrating, and Using Hydraulic Models; Water Research Foundation: Denver, CO, USA, 2010; pp. 42–44. [Google Scholar]
- Kumpel, E.; Woelfle-Erskine, C.; Ray, I.; Nelson, K.L. Measuring household consumption and waste in unmetered, intermittent piped water systems. Water Resour. Res. 2017, 53, 302–315. [Google Scholar] [CrossRef]
- Sarisen, D.; Koukoravas, V.; Farmani, R.; Kapelan, Z.; Memon, F.A. Review of hydraulic modelling approaches for intermittent water supply systems. Aqua Water Infrastruct. Ecosyst. Soc. 2022, 71, 1291–1310. [Google Scholar] [CrossRef]
- Abdelazeem, O.; Meyer, D.D.J. How to Model an Intermittent Water Supply: Comparing Modeling Choices and Their Impact on Inequality. J. Water Resour. Plan. Manag. 2024, 150, 04023071. [Google Scholar] [CrossRef]
- Taylor, D.D.J.; Slocum, A.H.; Whittle, A.J. Demand Satisfaction as a Framework for Understanding Intermittent Water Supply Systems. Water Resour. Res. 2019, 55, 5217–5237. [Google Scholar] [CrossRef]
| Disclaimer/Publisher’s Note: The statements, opinions and data contained in all publications are solely those of the individual author(s) and contributor(s) and not of MDPI and/or the editor(s). MDPI and/or the editor(s) disclaim responsibility for any injury to people or property resulting from any ideas, methods, instructions or products referred to in the content. |
© 2024 by the authors. Licensee MDPI, Basel, Switzerland. This article is an open access article distributed under the terms and conditions of the Creative Commons Attribution (CC BY) license (https://creativecommons.org/licenses/by/4.0/).


 ,
, 