Abstract
This study investigates novel methods for estimating metering errors in water meters, crucial for effectively managing apparent losses in Water Distribution Networks. Laboratory experiments were conducted to analyze the impact of various factors on metering errors. The Gene Expression Programming (GEP) algorithm was used to create a metering error assessment model, which was then validated through field trials in a DMA. Results indicate that metering errors are influenced by factors such as installation position, tilt angle, flow rates, and operational time. The GEP-based model showed high accuracy, with a mean squared error as low as 0.08, and a mere +0.5% difference from actual field measurements. This model offers water utility companies a cost-effective tool to assess metering errors without disassembly, offering a cost-effective tool for enhancing water supply management.
1. Introduction
Customer metering inaccuracies, which are mainly caused by metering errors in small-caliber customer water meters, are considered a component of apparent losses [1]. It is crucial to determine metering errors through verification or calculation to decide whether the recalibration or replacement of the water meter is necessary. This study aims to investigate new methods for estimating metering errors. The findings of this study can show that low-cost, high-efficiency assessments and calculations of metering errors are achievable, which is of great practical significance in accurately determining apparent losses, managing WDN losses, enhancing water utility revenues, and improving user water consumption experiences.
2. Materials and Methods
2.1. Verification of Metering Errors
To conduct the experiments verifying the influence of various factors on metering errors, utilizing the start–stop static volumetric method for calibration. Five groups of experiments were designed to study the patterns of influence that various factors have on metering errors, including manufacturer, installation location, inclination angle, operational time, and cumulative water usage. DN15 rotary vane water meter samples were required for each experimental group. The minimum flow rate was given as Q1, which is 0.01 m3/h; the boundary flow rate was given as Q2, which is 0.016 m3/h; the common flow rate was given as Q3, which is 2.5 m3/h; and the overload flow rate was given as Q4, which is 3.125 m3/h.
2.2. Gene Expression Programming Algorithm
GEP is an evolutionary algorithm inspired by the biological evolution principle of “survival of the fittest” [2]. Installation issues can be immediately corrected during construction, and water meter manufacturers are also selected based on the comparison of pass rates. Therefore, this study assumes that water meters are installed at the correct inclination angle and location, and that meters are of good quality from the manufacturer. Using the actual instantaneous flow rate (x1 in m3/h), operational time (x2 in h), and cumulative water usage (x3 in m3) as independent variables, and water meter measurement error (y) as the dependent variable, the metering error model of 18 DN15 water meters in a DMA was established based on GEP.
2.3. Field Experiment
The chosen DMA was newly constructed and verified through preliminary experiments to have almost no leakage phenomena. The DMA was supplied by two DN65 pipelines, each equipped with a DN65 water meter, referred to as the main water meters. These supply pipes were connected to 18 DN15 branch pipes, each fitted with a DN15 water meter, referred to as the branch water meters.
3. Results and Discussion
3.1. Factors Affecting Water Meter Measurement Error Patterns
3.1.1. Manufacturer
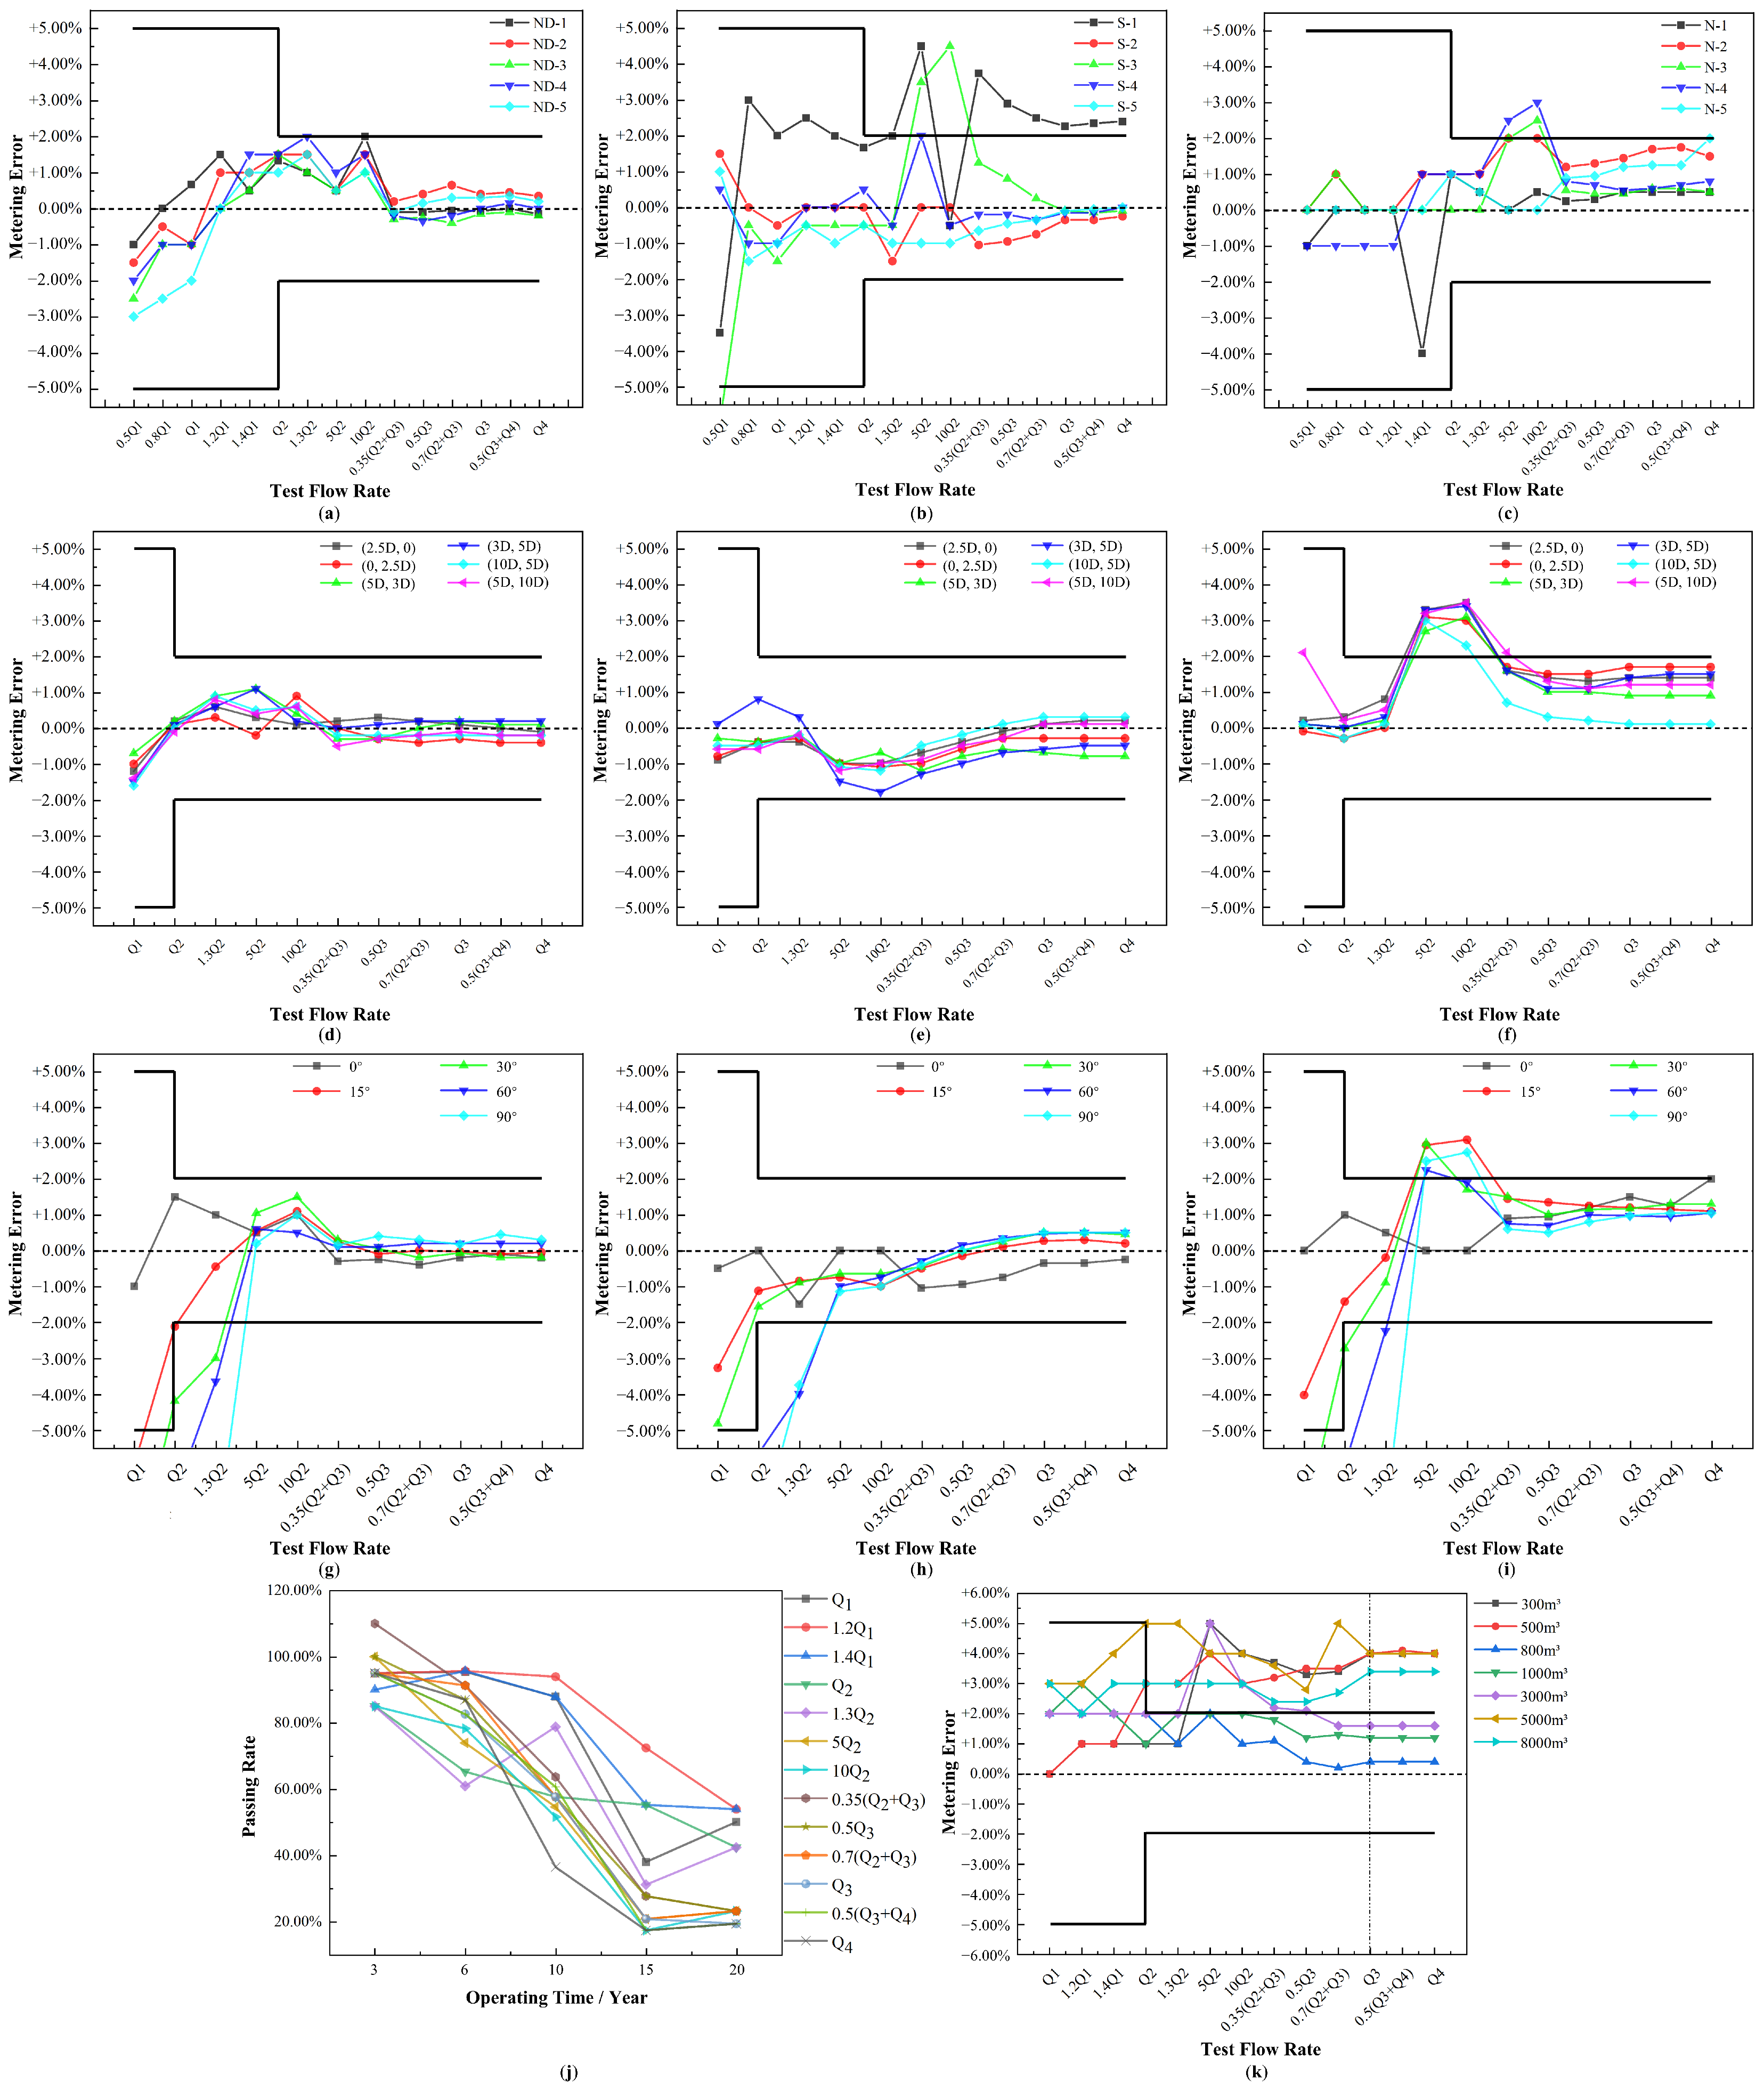
As shown in Figure 1a–c, using Q2 as the dividing point, when the test flow rate was less than Q2, all three manufacturers’ new water meters exhibited a large number of negative errors, while at flow rates greater than Q2, the errors were predominantly positive. These negative errors were caused by the measurement principle of the rotary vane water meter, which relies on water impacting the impeller to drive its rotation and start the water meter counter. When the flow rate is very low, the water meter counter will undercount or not count at all.
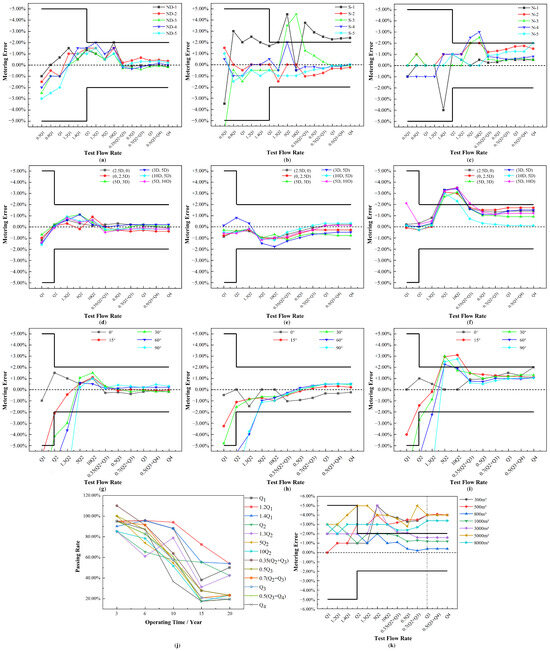
Figure 1.
The metering error results for experiments: (a) Manufacturer ND; (b) Manufacturer S; (c) Manufacturer N; (d) installation location with Manufacturer ND; (e) installation location with Manufacturer S; (f) installation location with Manufacturer N; (g) tilt angle with Manufacturer ND; (h) tilt angle with Manufacturer S; (i) tilt angle with Manufacturer N; (j) operating time with Manufacturer N; (k) cumulative water usage with Manufacturer N.
3.1.2. Installation Location
Although metering errors do not change significantly with the installation position at the same test flow rate, it can still be observed from Figure 1d–f that the error was smallest when the water meters from different manufacturers were installed at a position ten pipe diameters away from the preceding elbow and five pipe diameters away from the following elbow. This suggests that the installation location can have an impact on the performance of water meters, and it is important for water meter installation guidelines to consider such factors to ensure the accuracy and reliability of water usage measurements.
3.1.3. Tilt Angle
As shown in Figure 1g–i, taking the test flow rate Q2 as an example, within the 0 to 90° angle, the errors of all three water meters increased to varying degrees with the increase in tilt angle, eventually exceeding the “funnel” area and failing to meet the metering error requirements. The same pattern was observed at other test flow rates that were affected by the tilt angle. Therefore, if a water meter operates at a non-standard tilt angle, the measured values may deviate significantly from the true values, potentially exceeding the maximum allowable error range.
3.1.4. Operating Time
As shown in Figure 1j, pass rate does not follow an ideal linear relationship of decreasing with increased operating time. It is undeniable that even as operating time increases, the pass rates may rebound somewhat, but they still cannot exceed the initial pass rates when the meters were first put into operation. The overall trend at various test flow rates is still a decrease in pass rates with increased operating time.
3.1.5. Cumulative Water Usage
It can be observed in Figure 1k that the relationship between metering error and cumulative water usage is not a simple linear one. Considering that the instantaneous flow rate passing through the water meter can be roughly calculated by dividing the cumulative water usage by the operating time, when the operating time is the same, a cumulative water usage of 8000 m3 or 5000 m3 implies a higher instantaneous flow rate, while 500 m3 or 300 m3 implies a lower instantaneous flow rate. Therefore, it is inferred that when a water meter operates for a long time at extremely high or low flow rates, the metering errors will increase.
3.2. Metering Error Model
Using Q2 as the boundary, the metering error curve was divided into two segments for model establishment. The expression for the first segment model is:
and the expression for the second segment model is:
y = 2.3 − 0.03 × (x2 × (x1 × (x1 − 4.7) − x1 + (0.55 × x1 + x3) × (x1 − 4.7)) − x3 × (x1 − 4.7) × (x3 + 4.8))/(x2 × (x1 − 4.7)),
y = 0.1 + 1.74 × (x1 × x2 × (0.9 × x3 + 18.7) + (x1 + 3 × x2) × (3.7 × x2 + 3.7 × x3 + 31.1))/(x1 × x2 × (x1 + 3 × x2)).
After 1000 iterations, the minimum value of the fitness function (mean squared error) for the first segment of the model was 0.44, and for the second segment, it was 0.08. This indicates that both segments of the model fit extremely well, and the reliability of using the GEP algorithm to establish a model for water meter measurement error was verified.
3.3. Field Test
In the test DMA, the measurement results of two DN65 main water meters (standard meters) were used as the true water usage of DMA users, denoted as Qt. The branch water meters were reinstalled in the DMA to measure the water usage of users, and the sum of the measurements from the branch water meters was denoted as Qm. The sum of the errors of the sub-meters, , can be calculated using the following formula:
where n = 18, corresponding to the 18 branch water meters.
The x1, x2, and x3 of the branch water meters measured during actual operation were substituted into the model, and the sum of these errors was calculated and denoted as The maximum metering error calculated by the model differs from the actual measured error by +0.5%, which is within an acceptable range and can significantly reduce the cost and time of water meter calibration.
Author Contributions
Conceptualization, K.L. and J.G.; methodology, W.W.; software, S.Q.; validation, H.C., W.Q. and Y.T.; formal analysis, X.Z. All authors have read and agreed to the published version of the manuscript.
Funding
This research was funded by the National Key Research and Development Program of China, grant number 2022YFC3203800; the National Natural Science Foundation of China, grant number 51978203; the Unveiling Scientific Research Program, grant number CE602022000203; the Key Research and Development Program of Heilongjiang Province of China, grant number 2022ZX01A06.
Institutional Review Board Statement
Not applicable for studies not involving humans or animals.
Informed Consent Statement
Informed consent was obtained from all subjects involved in the study.
Data Availability Statement
For access, contact the corresponding author.
Conflicts of Interest
Author Yuan Tian was employed by the company Harbin Corner Science & Technology Inc. The remaining authors declare that the research was conducted in the absence of any commercial or financial relationships that could be construed as a potential conflict of interest.
References
- Pearson, D. Standard Definitions for Water Losses, 1st ed.; IWA Publishing: London, UK, 2019; pp. 17–18. [Google Scholar]
- Zhong, J.; Feng, L.; Ong, Y.-S. Gene Expression Programming: A Survey. IEEE Comput. Intell. Mag. 2017, 12, 54–72. [Google Scholar] [CrossRef]
Disclaimer/Publisher’s Note: The statements, opinions and data contained in all publications are solely those of the individual author(s) and contributor(s) and not of MDPI and/or the editor(s). MDPI and/or the editor(s) disclaim responsibility for any injury to people or property resulting from any ideas, methods, instructions or products referred to in the content. |
© 2024 by the authors. Licensee MDPI, Basel, Switzerland. This article is an open access article distributed under the terms and conditions of the Creative Commons Attribution (CC BY) license (https://creativecommons.org/licenses/by/4.0/).