Abstract
Recent developments in control theory coupled with the growing availability of real-time data have paved the way for improved data-driven control methodologies. This study explores the application of a data-enabled predictive control (DeePC) algorithm to optimize the operation of water distribution systems (WDS). WDSs are characterized by inherent uncertainties and complex nonlinear dynamics. Hence, classic control strategies that involve physical model-based methods are often hard to implement and infeasible to scale. The DeePC method suggests a paradigm shift by utilizing a data-driven approach. This method employs real-time data to dynamically learn an unknown system’s behavior. It utilizes a finite set of input–output samples (control settings, and measured data) to derive optimal policies, effectively bypassing the need for an explicit mathematical model of the system. In this study, DeePC is applied to a pressure management case study and demonstrates superior performance compared to standard control strategies.
1. Introduction
Water distribution systems (WDS) are intricate dynamic systems necessitating real-time decision making to ensure adequate service levels in terms of pressure, quantity, and quality. Typically, these decisions rely on a predictive control framework where data from network sensors are continuously fed into a mathematical model and the model identifies the optimal operation policy, which is subsequently delivered back to the system actuators. This process is referred to as model predictive control (MPC) or real-time control [1]. While real-time control has many applications in WDS management (pressure management, chlorine injection, pump speed, etc.), its implementation presents many challenges due to several factors [2]. Most of the optimization models are based on physical network modeling, which is mathematically complex. Another challenge is the uncertainty inherent in WDS. Unknown factors such as consumer demands, pipe roughness, and chlorine decay coefficients affect the optimality and feasibility of the solution. Recently a novel paradigm of data-enabled predictive control (DeePC) was introduced to cope with the challenge of real-time control [3]. It is based on input-output measurements alone, where the physical system may be unknown. DeePC can be used to find optimal input signals such that corresponding output parameters will follow desired trajectories. DeePC does not depend on a parametric or physical model. Instead, it leverages historical system behavior to find an optimal policy based on combinations of past recorded input–output matches. The nature of this method holds promising potential for WDS control which requires solving highly complex optimization problems subject to a strict computational burden.
2. Methodology
The DeePC theory is herein described for the case of linear systems, and later, regularization terms are introduced for the more complex case of nonlinear uncertain systems. Consider a discrete-time linear system characterized by m inputs and p outputs. Let and represent the system input and output trajectories, respectively. The methodology employs a dataset of measured inputs and outputs spanning a length of T time steps to derive an optimal control policy. For a signal , we denote the Hankel matrix of order L to be a matrix of shifted signal entries, as defined in Equation (1):
A signal is considered “persistently exciting of order L” if the above matrix is of full rank (its rank is equal to L). This means that the signal is rich and long enough to adequately capture the system’s dynamics [1]. Let be the size of an initial subset of records out of the set of T measurements, and Let N be the predictive horizon, such that ; the following Hankel matrices are constructed:
where the p and f subscripts represent past and future, respectively, and the d superscript denotes the measured data, meaning that are the measured input and output signals. and comprise the first block of rows, and and comprise the last N block of rows of the respective Hankel matrices. Based on this notation, the past data are used to estimate the system’s current state, and the future data are used to predict the system’s future state.
The key principle of the DeePC methodology lies in the following result, which states that a Hankel matrix of sufficient order spans the space of all system trajectories. According to [4], an input–output set is a solution to the control problem if and only if there exist that satisfies the following:
Equation (3) signifies that a linear constraint can effectively substitute a physical model to describe the system dynamics. A control problem based on this approximation can be formulated:
where u, y, and are the input, output, and reference trajectories, respectively, all with a length of the forecast horizon. is a regularization term that mitigates overfitting, thus enhancing the robustness of the solution under nonlinear and uncertain conditions. Similar regularization terms can be introduced to regulate the input and output, as presented in [1]. Equation (4) lays out a tractable control problem with a quadratic objective and linear constraints. Further constraints can be added to maintain u and y within a desired range. This control problem is solved within an MPC framework, that is, after solving problem (4), the optimal input trajectory is applied to the system. After s time steps (s < N), the problem is updated to include the latest measurements and then solved again.
Case Study
The Fossolo network represents a single district meter area (DMA), as depicted in Figure 1. The network has one inlet, regulated by a PRV that governs the inlet head. It comprises 36 demand nodes with a total demand fluctuating between 24 and 42 L/s. The objective is to control the PRV setting to ensure minimal sufficient pressure for consumers where excess pressure would exacerbate leakages. Accordingly, the PRV setting serves as the input signal (u), while the output signal (y) corresponds to the pressure measured in a representative sensor.
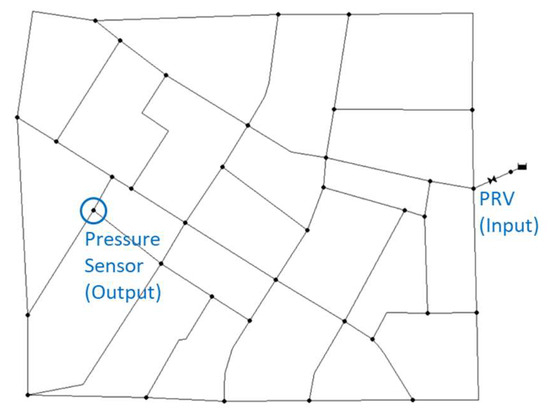
Figure 1.
Case study—Fossolo network.
Since real measured data are not available, this study employed simulated data. The input trajectory is normally distributed, with a mean value of 45 and a standard deviation of 8, and comprises 600 data points. To test the method against real-world noised data, the output signal was adjusted by a random factor within the range of 0.95 to 1.05.
3. Results
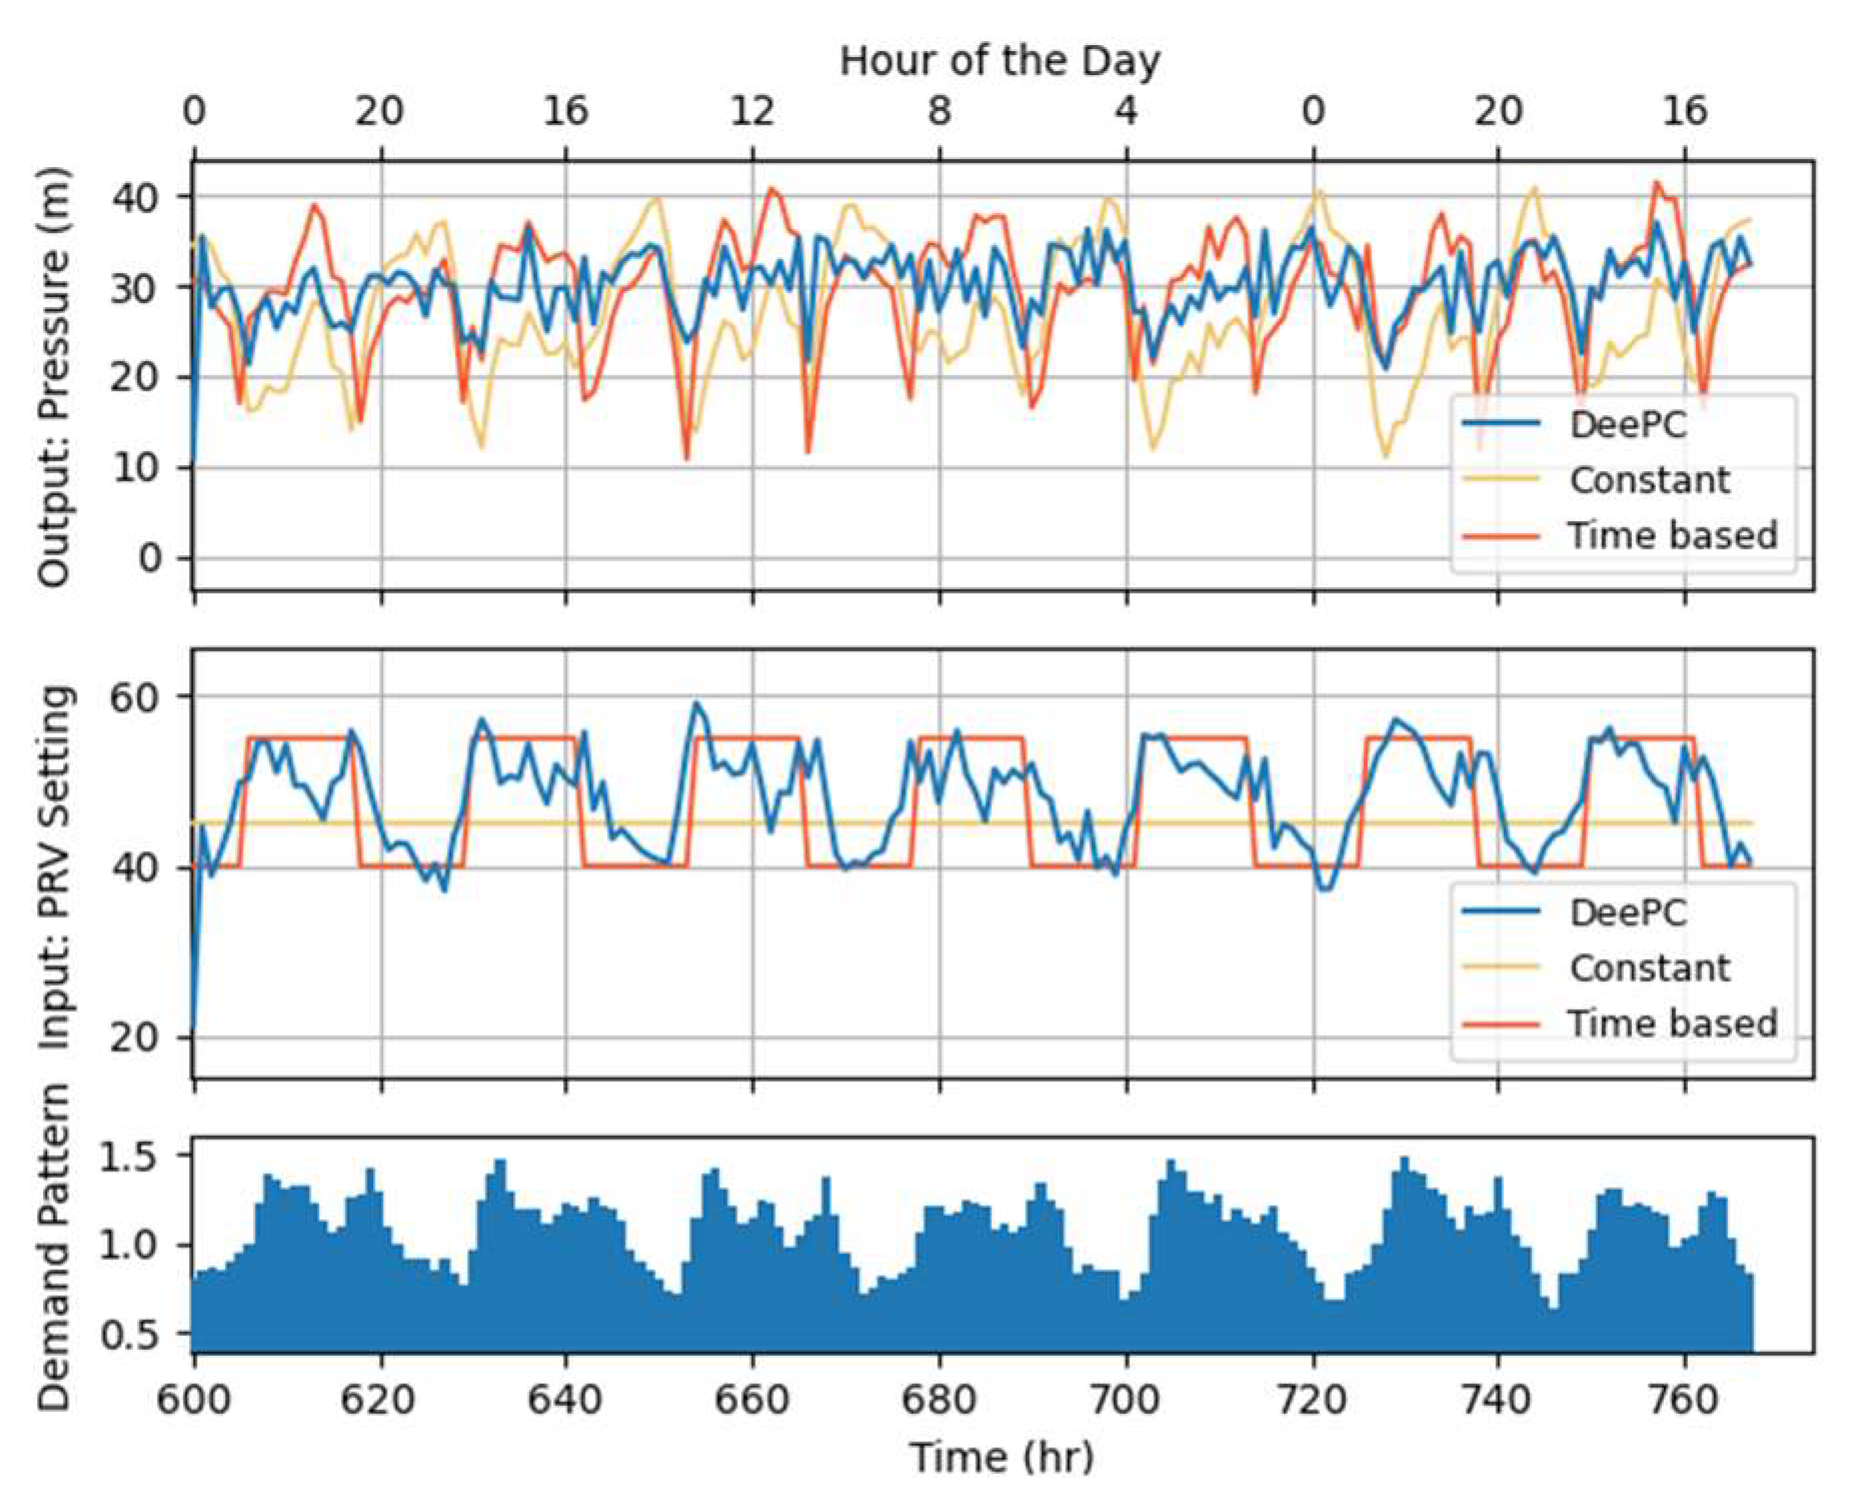
The DMA pressures were optimized over one week with a reference trajectory of 30 m. Additionally, constraints were added to keep the pressure in the range of 25–35 m. The DeePC method was compared to two common control strategies, a constant setting, and a time-based strategy that employs higher PRV settings during the daytime to accommodate increased demands. The input–output trajectories of the three strategies are presented in Figure 2.
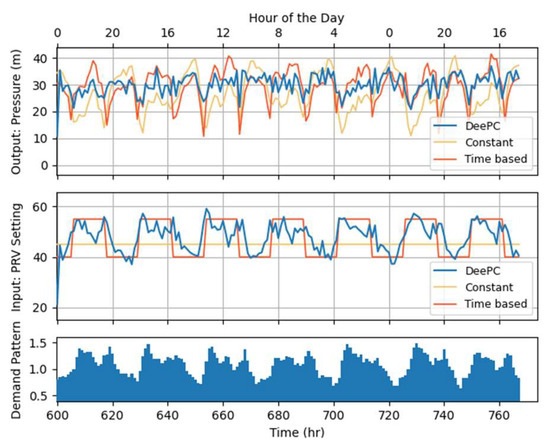
Figure 2.
Input–output trajectories for Fossolo network pressure management.
Figure 2’s upper subplot demonstrates that the DeePC results in a lower-magnitude trajectory that can better track the 30 m target compared to the two alternatives. The input signal of the PRV setting is highly correlated with the demand pattern, allowing for higher pressures at the peak demand times and redundant pressure reduction for the off-peak times. To quantify the performance of the three approaches, the mean absolute error (MAE) was computed. Additionally, constraint violation rates were calculated to evaluate how often pressures exceeded the predefined range of 25–35 m. Furthermore, the violations of a broader range of 10 m deviations were also computed to evaluate the rate of dramatic violations. The results in Table 1 show that DeePC is superior to the constant and time-based controls in all metrics. In terms of deviations from the reference trajectory, DeePC achieved a MAE which is 32% lower than the time-based control. DeePC violated the constraints of only 16.7% of the time steps compared to 64.3% and 35.1 of the constant and time-based controls, respectively, where none of the violations exceeds the 10 m range.

Table 1.
Control methods’ performance.
4. Summary
This study introduces a data-enabled predictive control (DeePC) approach tailored for DMA pressure management. DeePC emerges as a promising technique for WDS control as it avoids intricate physical network modeling and demonstrates resilience in the face of uncertainties and measurement inaccuracies. While the current application focuses on a relatively simple scenario involving a single input–output set, the method’s potential for broader application remains significant. Future research will explore more complex scenarios involving higher-dimensional problems and diverse applications.
Author Contributions
Conceptualization, G.P. and A.O.; methodology, G.P. and A.O.; software, G.P.; validation, G.P. and A.O.; formal analysis, G.P.; investigation, G.P.; writing—original draft preparation, G.P.; writing—review and editing, G.P. and A.O.; visualization, G.P.; supervision, A.O. All authors have read and agreed to the published version of the manuscript.
Funding
This research received no external funding.
Institutional Review Board Statement
Not applicable.
Informed Consent Statement
Not applicable.
Data Availability Statement
The data presented in this study are available upon request.
Acknowledgments
This research was supported by The Bernard M. Gordon Center for Systems Engineering at the Technion.
Conflicts of Interest
The authors declare no conflicts of interest.
References
- Creaco, E.; Campisano, A.; Fontana, N.; Marini, G.; Page, P.R.; Walski, T. Real Time Control of Water Distribution Networks: A State-of-the-Art Review. Water Res. 2019, 161, 517–530. [Google Scholar] [CrossRef] [PubMed]
- Castelletti, A.; Ficchì, A.; Cominola, A.; Segovia, P.; Giuliani, M.; Wu, W.; Lucia, S.; Ocampo-Martinez, C.; De Schutter, B.; Maestre, J.M. Model Predictive Control of Water Resources Systems: A Review and Research Agenda. Annu. Rev. Control 2023, 55, 442–465. [Google Scholar] [CrossRef]
- Coulson, J.; Lygeros, J.; Dorfler, F. Data-Enabled Predictive Control: In the Shallows of the DeePC. In Proceedings of the 2019 18th European Control Conference, ECC, Naples, Italy, 25–28 June 2019; pp. 307–312. [Google Scholar] [CrossRef]
- Willems, J.C.; Rapisarda, P.; Markovsky, I.; De Moor, B.L.M. A Note on Persistency of Excitation. Syst. Control Lett. 2005, 54, 325–329. [Google Scholar] [CrossRef]

Disclaimer/Publisher’s Note: The statements, opinions and data contained in all publications are solely those of the individual author(s) and contributor(s) and not of MDPI and/or the editor(s). MDPI and/or the editor(s) disclaim responsibility for any injury to people or property resulting from any ideas, methods, instructions or products referred to in the content. |
© 2024 by the authors. Licensee MDPI, Basel, Switzerland. This article is an open access article distributed under the terms and conditions of the Creative Commons Attribution (CC BY) license (https://creativecommons.org/licenses/by/4.0/).