Abstract
Water distribution networks (WDNs) are becoming more interconnected with other networks, such as energy and the Internet networks, complicating their analysis. This article proposes an alternative method for reducing the WDN search space and skeletonization using graph theory. The network is represented as a weighted and attributed graph with edge weights as diameters and demand values as vertex attributes. A method for contracting vertices and edges based on similarity values is introduced. The methodology was evaluated using global graph analysis metrics, Crowding and Assortativity Coefficients, showing effectiveness particularly in selecting representative network elements.
1. Introduction
Water Distribution Networks (WDN) have become increasingly complex due to their integration with other networks such as traffic, the Internet, and energy, causing significant problems in network analysis. A failure in any part of this system could destroy the entire network, highlighting the need for effective evaluation methods. Sophisticated network analysis methods, based on graph theory and statistical techniques, are becoming necessary to understand the structure, dynamics, and properties of networks []. These techniques aim to reduce the complexity of network analysis while maintaining confidential information and connectivity.
One prevalent method for simplifying WDN analysis, especially due to computational constraints, is skeletonization, which gained prominence in the early 21st century, particularly for water quality assessment and transient effect modelling []. Skeletonization involves extracting the main structure of WDNs while ensuring connectivity and preserving vital network characteristics []. Despite the absence of a standardized skeletonization process, guidelines provided by entities like the U.S. Environmental Protection Agency advocate for the inclusion of significant portions of the network, prioritizing pipes with substantial capacity and those connecting critical points.
Graph theory offers a promising way to improve WDN analysis by representing networks as weighted and attributed graphs, enabling a more nuanced understanding of network characteristics and behaviors []. Weighted graphs, in which edges incorporate interaction values between vertices, have been widely used in various aspects of WDN management []. Furthermore, attributed graphs, which assign specific characteristics to vertices, offer insights into vertex similarities, community detection, and more accurate decision-making processes []. Graph contraction methods, relatively unexplored in WDN studies, present an attractive option for network skeletonization and search space reduction, simplifying complex graphs while maintaining structural integrity and connectivity. This research develops a methodology for contracting weighted and attributed graphs representing WDNs, evaluating connectivity and contraction effectiveness based on the characteristics of the network elements.
2. Methodology
The methodology focuses on streamlining the analysis of WDNs by skeletonizing the network, aiming to cut down on search space and processing time. It involves two main steps: first, representing the network as a weighted graph based on pipe diameters, and second, enhancing this representation to include demand information as well, creating a weighted and attributed graph. Subsequently, a graph contraction process is implemented, leveraging both weight and attribute data to shrink the network size while preserving critical elements.
2.1. Water Network Representation as a Graph
A graph, typically represented as , consists of a set of vertices (), edges (), and edge weights () []. The matrix representation of such a graph involves a square matrix indexed by vertices, containing edge weight information. In the context of WDS, vertices represent network nodes like demand nodes, reservoirs, and tanks, while edges correspond to pipes, pumps, and valves, with weights chosen according to specific criteria, such as maximum flow rates for leakage studies. Seeking a more comprehensive representation, recent research has explored attributed graphs, where additional information is assigned to vertices []. This weighted and attributed graph representation, denoted as incorporates assignment vectors () describing vertex characteristics, including binary or temporal data, enhancing the fidelity of network analysis. Obtaining such information, such as demand values and pipe diameters, involves computational hydraulic simulations using tools like the Water Network Tool for Resilience (WNTR) package, facilitating WDS creation, simulation, and analysis within the Python programming environment [].
2.2. Graph Contraction
The goal of graph contraction is to reduce graph size while maintaining structural integrity, particularly by merging vertices with similar behavioral attributes []. This process, denoted by , involves assigning labels to vertex subsets based on a terminal projection function , where each label represents a contraction solution for the original graph . To determine the subset of vertices in the weighted belonging to , the function evaluates the absolute difference in edge weights incident on each vertex . If the difference falls below a similarity threshold , indicating similarity between edges, the vertices are contracted into a single component, leading to the formation of the contracted graph based on edge weights. This process ensures that vertices and are grouped into the same labeled component if their connecting edge’s weight difference exceeds the similarity threshold .
2.3. Evaluation Approach
Graph contraction is evaluated by analyzing the preservation of the properties of the original graph, comparing graphs and regarding their topological and structural aspects, focusing on the Agglomeration and Assortativity Coefficients. The Crowding Coefficient measures the strength of vertex connections, calculated as the ratio between triangles formed with a vertex and its neighbors []. Meanwhile, the Assortativity Coefficient evaluates the propensity of vertices to connect with others that have similar characteristics []. This coefficient considers the degree of the analyzed node, where positive assortativity implies high-degree vertices connecting with others with a similar degree, and vice versa for negative assortativity, while values close to zero suggest no clear tendency for similar vertices to connect [].
3. Results and Discussion
The Modena network, a network introduced by [], is initially represented as a graph (Figure 1a) that has 272 vertices and 317 edges, reflecting the number of demand nodes, reservoirs, and pipes. The methodology also allows for the choice of a minimum percentage of vertices and edges to be contracted, which was selected to follow the indications of [], resulting in an approximately 40% reduction in the number of vertices. The creation of the weighted graph also utilizes the coordinates of the nodes as vertex coordinates. Figure 1a illustrates the weighted graph by diameters, where the thickness of the edges represents their weight. The weighted and attributed graph has the same representation, as vertex information is internally contained.
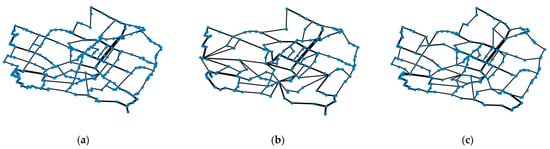
Figure 1.
Graph structural analysis: (a) Modena network graph representation; (b) Weighted contracted graph; (c) Weighted attributed contracted graph.
It is observed in Figure 1a that the weight distribution corroborates with the diameters. Pipes with larger diameters are located near the reservoirs, with diameters exceeding 304 mm. Thus, the edges representing these pipes were not contracted; however, some vertices were mainly contracted and connected to edges that did not exceed the similarity threshold. Figure 1b shows the contracted weighted graph resulting in a graph with 136 vertices, 178 edges, and 58% of the total network demand. By contracting the weighted and attributed graph, new information is considered in the contraction process. The indication from [] is also considered to ensure 75% of the total network demand. Figure 1c shows that the graph reduction is noticeably smaller, resulting in a graph with 171 vertices and 216 edges that ensures 77% of the total demand.
Graph structure evaluation was performed by determining the clustering coefficient and the Assortativity Coefficient. These coefficients refer to how strongly vertices are connected and the tendency of vertices to connect to nodes of similar degrees. Figure 2 presents the coefficient values for each graph: a graph representing the network, the graph weighted by diameters, and the weighted and attributed graph.
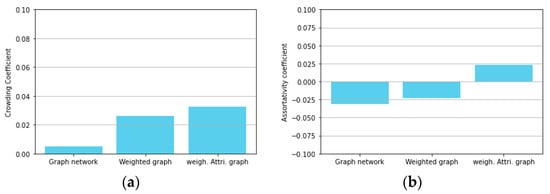
Figure 2.
Graph structural analysis: (a) Crowding Coefficient; (b) Assortativity Coefficient.
Figure 2a shows that the entire network graph has a Crowding Coefficient close to zero, indicating low connectivity among neighboring vertices and suggesting sparse local connection density. In contrast, the contracted weighted graph has a higher Crowding Coefficient, indicating enhanced connectivity among vertices. Notably, the weighted and attributed graph has the highest Crowding Coefficient, suggesting a dense local connection density, potentially indicating a robust network structure conducive to cohesive communities. In Figure 2b, the Assortativity Coefficient results reveal distinct connectivity patterns. Both the Modena network graph and the contracted weighted graph exhibit negative assortativity, where high-degree vertices tend to connect to lower-degree ones. Conversely, the contracted weighted and attributed graph displays positive assortativity, suggesting a tendency for high-degree vertices to connect with others of similar degree. These findings highlight potential differences in network structures, with implications for water distribution optimization strategies based on connectivity preferences among vertices.
4. Conclusions
The research investigated WDN representation techniques such as weighted and attributed graphs, using diameters as edge weights and assigning information values to vertices. Two graph contraction methods were introduced as alternatives to skeletonization and space reduction, one based on weight similarity values and the other on demand value similarity. The evaluation of the methodology using the Crowding Coefficient and Assortativity showed promising results, mainly in reducing computational efforts for network analysis and simulation.
Author Contributions
Conceptualization, D.B. and B.B.; methodology, D.B. and B.B.; software, D.B.; validation, J.A., G.M. and E.L.; formal analysis, B.B.; investigation, D.B.; supervision, B.B. and E.L. All authors have read and agreed to the published version of the manuscript.
Funding
This research was funded by CAPES, CNPq, grant number 404605/2021-4 and FAPEMIG, grant number APQ-01320-21.
Institutional Review Board Statement
Not applicable.
Informed Consent Statement
Not applicable.
Data Availability Statement
The data used in this research are obtained through the application of the methodology and can be obtained by contacting the corresponding author.
Conflicts of Interest
The authors declare no conflicts of interest.
References
- Herrera, M.; Abraham, E.; Stoianov, I. A Graph-Theoretic Framework for Assessing the Resilience of Sectorised Water Distribution Networks. Water Resour. Manag. 2016, 30, 1685–1699. [Google Scholar] [CrossRef]
- Panguluri, S.; Grayman, W.; Clark, R.; Garner, L.; Haught, R. Water Distribution System Analysis: Field Studies, Modeling, and Management; US Environmental Protection Agency, Water Supply and Water Resources Division: Washington, DC, USA, 2005.
- Barros, D.B.; Souza, R.G.; Meirelles, G.; Brentan, B. Leak detection in water distribution networks based on graph signal processing of pressure data. J. Hydroinform. 2023, 25, 2281–2290. [Google Scholar] [CrossRef]
- Berahmand, K.; Haghani, S.; Rostami, M.; Li, Y. A new attributed graph clustering by using label propagation in complex networks. J. King Saud Univ.-Comput. Inf. Sci. 2022, 34, 1869–1883. [Google Scholar] [CrossRef]
- Katherine, K.; David, H.; Michael, B.; Joseph, H.; Terranna, H.; Regan, M.; Jonathan, B. Water Network Tool for Resilience (WNTR) User Manual; Sandia National Lab. (SNL-NM): Albuquerque, NM, USA, 2017; Volume 1.
- Bonsma, P.; Paulusma, D. Using contracted solution graphs for solving reconfiguration problems. Acta Inform. 2019, 56, 619–648. [Google Scholar]
- Saramäki, J.; Kivelä, M.; Onnela, J.P.; Kaski, K.; Kertesz, J. Generalizations of the clustering coefficient to weighted complex networks. Phys. Rev. E 2007, 75, 027105. [Google Scholar] [CrossRef] [PubMed]
- Bragalli, C.; D’Ambrosio, C.; Lee, J.; Lodi, A.; Toth, P. Water Network Design by MINLP; Rep. No. 2008. RC24495; IBM: Armonk, NY, USA, 2008. [Google Scholar]
Disclaimer/Publisher’s Note: The statements, opinions and data contained in all publications are solely those of the individual author(s) and contributor(s) and not of MDPI and/or the editor(s). MDPI and/or the editor(s) disclaim responsibility for any injury to people or property resulting from any ideas, methods, instructions or products referred to in the content. |
© 2024 by the authors. Licensee MDPI, Basel, Switzerland. This article is an open access article distributed under the terms and conditions of the Creative Commons Attribution (CC BY) license (https://creativecommons.org/licenses/by/4.0/).