Abstract
The operation of control devices in a water distribution network establishes a transient flow that leads to pressure oscillation during a certain time. Depending on the pressure wave’s amplitude, infrastructure can be exposed to dangerous pressure levels, collapsing or breaking the pipes. Predicting the maximum and minimum head pressure values caused by an operation can assist in the design of safety devices and increase the lifespan of the distribution network. Nevertheless, the calculation of the pressure wave magnitude based on hydraulic equations can be time consuming, reducing the possibility of an optimal approach for designing a protection system. In this sense, this study presents a data-driven model for predicting pressure values caused by transient flows in a water distribution network. The methodology is implemented using an ensemble tree linked to the XGBoost algorithm and it is applied in two case studies.
1. Introduction
A flow regime is said to be transient when some of its characteristics (e.g., mass, momentum, or energy) vary over time. In a water distribution network (WDN), transient flows arise when the equilibrium experienced by the network is altered; while the system exhibits a transient flow regime, a pressure wave occurs, causing pressure surges. The amplitude of this oscillation depends on the intensity of the disturbance applied to the system. In a WDN, improper pump operation [1], rapid valve closure, and the emergence of leaks create significant disturbances in the network, leading to pressure spikes that network components are not designed to withstand, potentially causing network ruptures, interrupting the water supply, decreasing the system’s lifespan, and increasing maintenance costs.
Studying the behavior of transient flows enables network protection, as it becomes possible to predict the propagation of the shock wave generated by a valve operation and even predict the location of leaks [2]. However, hydraulic models require the use of high-cost equipment and computational models require solving complex equations that demand high computational capacity. In this sense, the use of metamodels employing machine learning can allow the evaluation of hydraulic transients with lower financial and computational costs.
The methodology is applied using linear regression algorithms that are fed with databases obtained from traditional calculation methods (e.g., the method of characteristics—MOC). Once the database is consolidated, the algorithms are able to predict flow and pressure more effectively. The method has already been used for predicting pressure in a water distribution network operating under steady-state conditions using artificial neural networks (ANN) algorithms [3], and it has also been used for transient prediction using physics-informed neural network PINN algorithms [2].
This article proposes the use of a random forest algorithm for hydraulic transient analysis. The method was applied in two case studies: a water distribution network exposed to a leak and a gravity-fed pipeline with water flow abruptly interrupted.
2. Materials and Methods
2.1. Hydraulic Modeling
The hydraulic modeling necessary for evaluating hydraulic transients depends on the use of mass conservation and momentum equations. An elastic model is established that considers motion inertia, fluid compressibility, and conduit deformation, which can be used for all types of flow and which can generate more reliable results for transient flows than other methods. Using mass and momentum conservation, Equations (1) and (2) describe the elastic model for transient flows.
where, is hydraulic load, is time, is celerity, is flow rate, is gravity, is area, and is diameter.
The equations of the elastic model did not have an analytical solution and can only be solved with numerical methods. The method of characteristics [4] transforms partial differential equations into ordinary differential equations that can be numerically solved but that require high computational costs when applied to larger and more complex networks.
2.2. XGBoost
The construction of the metamodel is based on the XGBoost algorithm [5], which combines the results of a set of decision trees into a final result. This type of algorithm is extremely robust and efficient compared to simple decision tree algorithms. The algorithm begins creating subsets of the original database using bootstrapping. Each of these subsets generates a decision tree trained with the specificities of the subset used, and, when combined at the end of the process, they generate a result with higher accuracy to avoid overfitting. The algorithm’s results are also validated using common statistical metrics such as R-squared, mean-squared error, and root-mean-squared error.
3. Case Study
The methodology presented was applied in two case studies to verify the accuracy of XGBoost in predicting the maximum and minimum pressures created by a pressure surge in a network. The algorithm was tested on a water distribution network where the transient flow was generated by the sudden emergence of a leak at a random point in the network. It was also tested on a gravity-fed pipeline where the transient flow was generated by the instantaneous closure of a valve. Both cases are described below.
3.1. Case Study 1: Modena Network
In this simulation, leaks of different intensities are induced at all nodes of a water supply network, and pressure surges are calculated at four selected nodes of the network, which represent nodes monitored by pressure meters. As input data, the algorithm receives the node where the leak occurs, the leak flow rate, and the pressure measured at monitored nodes before the start of the leak. The simulation returns eight results considering the values of overpressure and subpressure for the four monitored nodes.
3.2. Case Study 2: Gravity Pipeline
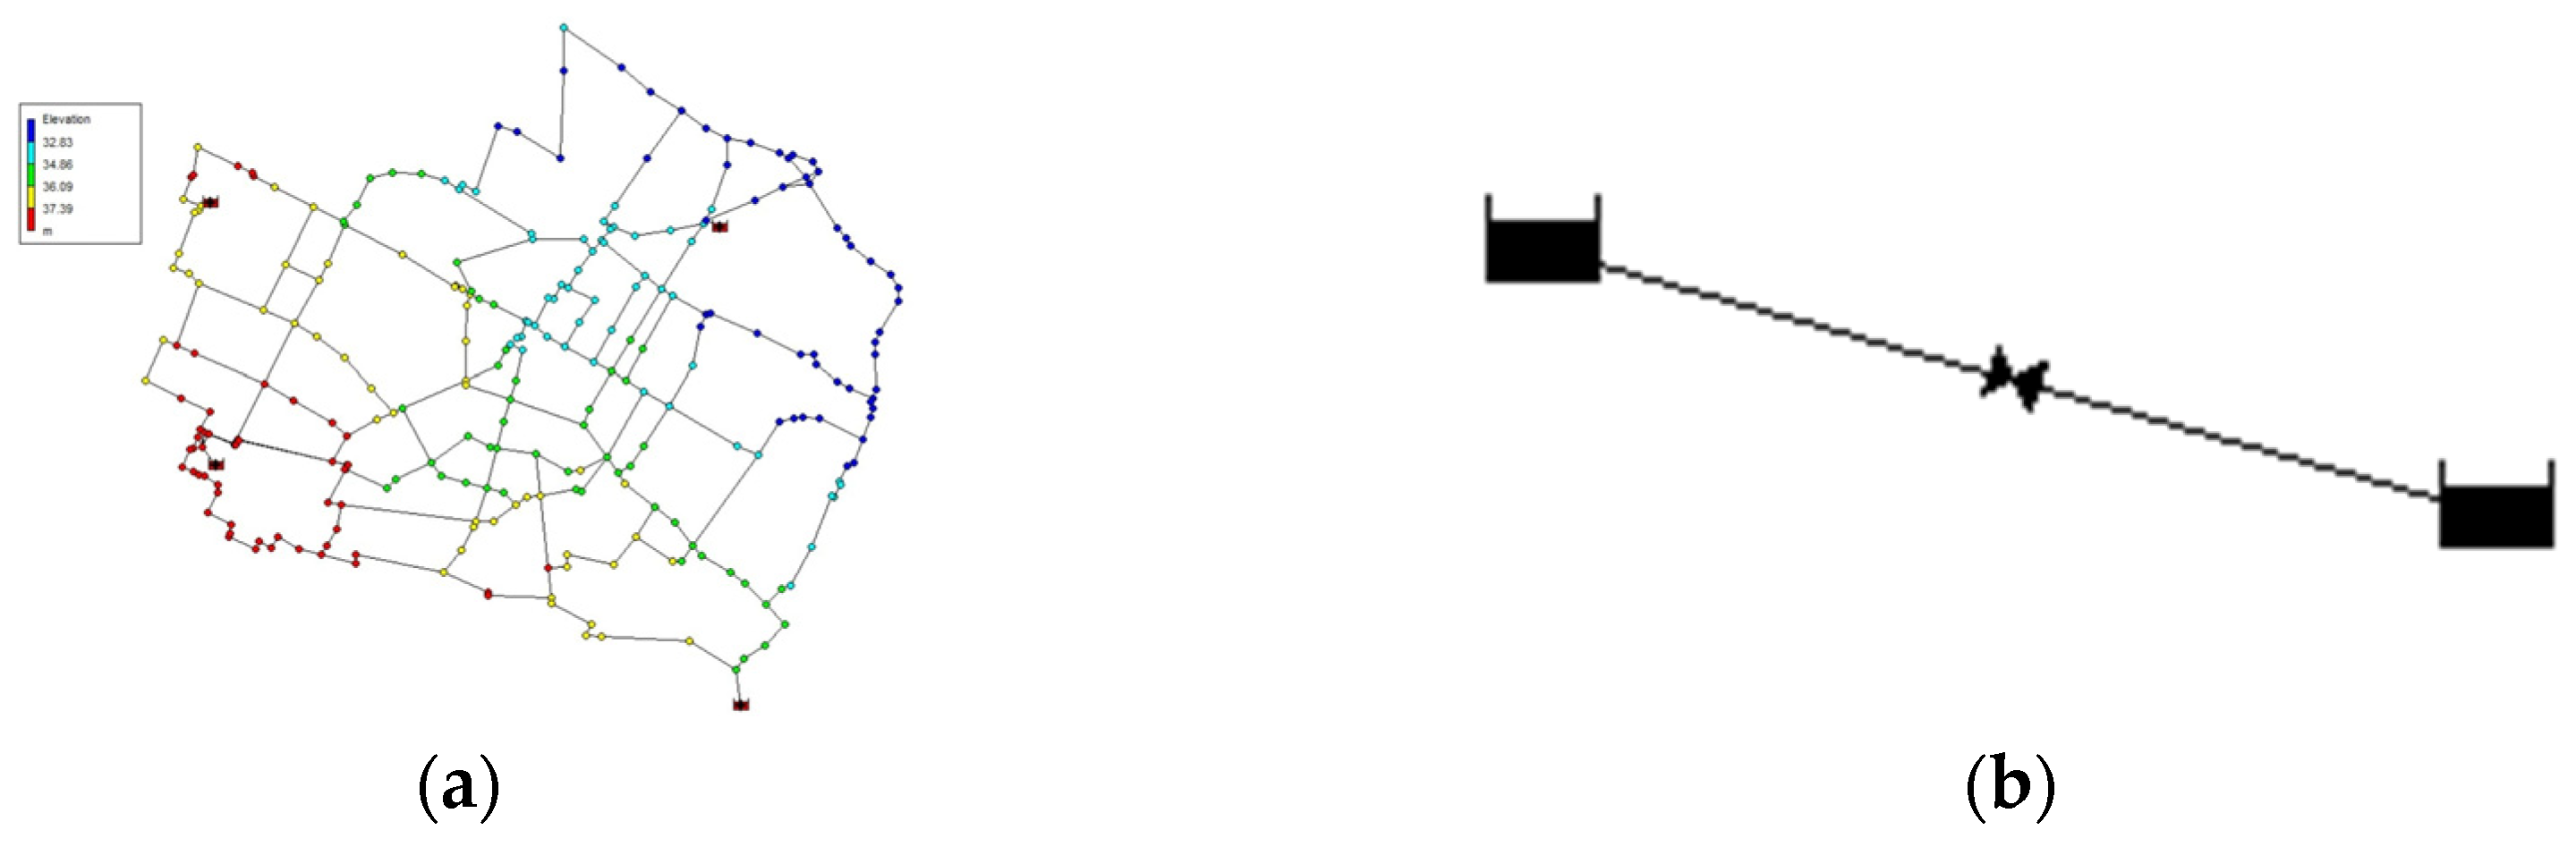
In this simulation, a system consisting of a water source, a pipeline, and a valve has its flow interrupted by the instantaneous closure of the valve. Infrastructure data such as friction factor, elevation difference between reservoirs, pipeline length and diameter, and celerity are used as input data. The database used in this case includes 2.8 million scenarios originating from variations in the five input variables as described by [6]. In this simulation, 70% of the dataset is used for training the model and 30% is used for validation. Figure 1b shows the system used in the study.
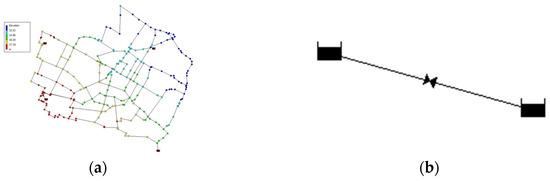
Figure 1.
(a) Water distribution network Modena; (b) gravity pipeline.
4. Results
The simulations were conducted using MATLAB R2023b software. The algorithm employed creates subsets with the data and is trained with each subset, seeking the best results after 30 iterations. For validation of the results, the pressure values estimated by the algorithm in both cases were evaluated using statistical metrics such as R-squared, mean-squared error, and root-mean-squared error, as shown in Table 1, that present the grouped results of the statistical metrics used to evaluate the outcomes.

Table 1.
Results for each simulation.
For the Modena network, it is possible to assess the nodes and flow rates for which the model is capable of simulating the best results. Figure 2 presents the results of an overpressure situation for one of the monitored nodes; the histogram shows the absolute error frequency for this simulation, showing that 90% of the results are around 1 m, which is low for a WDN.
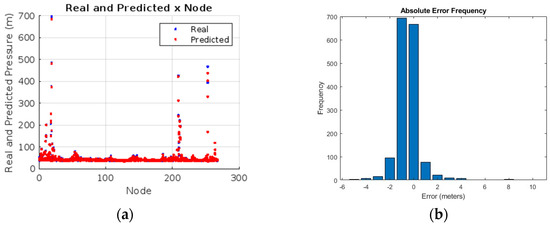
Figure 2.
Results of the Modena network: (a) the predicted and real pressure for each node of the system and (b) the error histogram.
All simulations yielded results greater than 0.9 for the R-squared value, which means that the algorithm is able to obtain good predictions for pressures in transient flow. On the other hand, an analysis of the RMSE takes into account a pressure error of 3 m, which represents a low error considering the operating pressures of a water distribution network.
The gravity pipeline case demonstrated that the method can be used for various infrastructure conditions, as it considered variations in friction factor, geometric slope, length, diameter, and celerity, resulting in the best R-squared value among all simulations.
Author Contributions
Conceptualization, B.B. and G.M.; methodology R.B. and R.G.S.; software R.B. and R.G.S.; validation, B.B. and R.G.S.; formal analysis R.B., G.M. and B.B.; writing—original draft preparation, R.B.; writing—review and editing, R.G.S., B.B. and G.M.; supervision, B.B.; project administration, B.B. and G.M.; funding acquisition, B.B. All authors have read and agreed to the published version of the manuscript.
Funding
This research was funded by CNPq, grant number 404605/2021-4, and FAPEMIG, grant number APQ-01320-21.
Institutional Review Board Statement
Not applicable.
Informed Consent Statement
Not applicable.
Data Availability Statement
Data available upon request.
Conflicts of Interest
The authors declare no conflicts of interest.
References
- El-Hazek, A.N.; Ahmed, M.F.; Badawy, N.A.M. Transient flow simulation, analysis and protection of pipeline systems. J. Water Land Dev. 2020, 47, 47–54. [Google Scholar] [CrossRef]
- Ye, J.; Do, N.C.; Zeng, W.; Lambert, M. Physics-informed neural networks for hydraulic transient analysis in pipeline systems. Water Res. 2022, 221, 118828. [Google Scholar] [CrossRef] [PubMed]
- Meirelles, G.; Brentan, B.M.; Manzi, D.; Luvizotto. Metamodel for nodal pressure estimation at near real-time in water distribution systems using artificial neural networks. J. Hydroinformatics 2018, 20, 486–496. [Google Scholar]
- Wylie, E.B.; Streeter, V.L. Fluid Transients in Systems; Prentice-Hall: Englewood Cliffs, NJ, USA, 1993. [Google Scholar]
- Chen, T.; He, T.; Benesty, M.; Khotilovich, V.; Tang, Y.; Cho, H.; Chen, K.; Mitchell, R.; Cano, I.; Zhou, T. Xgboost: Extreme Gradient Boosting, R Package version 0.4-2; R Package: Madison, WI, USA, 2015; Volume 1, pp. 1–4. [Google Scholar]
- Souza, R.G.; Móller, D.S.; Evangelista, L.A.; Brentan, B.M.; Meirelles, G. Uso de redes neurais artificiais para previsão do golpe de aríete. In Proceedings of the Simpósio Brasileiro de Recursos Hídricos, Aracaju, Brazil, 24 November 2023. [Google Scholar]

Disclaimer/Publisher’s Note: The statements, opinions and data contained in all publications are solely those of the individual author(s) and contributor(s) and not of MDPI and/or the editor(s). MDPI and/or the editor(s) disclaim responsibility for any injury to people or property resulting from any ideas, methods, instructions or products referred to in the content. |
© 2024 by the authors. Licensee MDPI, Basel, Switzerland. This article is an open access article distributed under the terms and conditions of the Creative Commons Attribution (CC BY) license (https://creativecommons.org/licenses/by/4.0/).