Proceeding Paper

Modeling Temperature Fluctuations during Intermittent Water Usage within Water Systems: Water Quality Impact †

Industrial Chair on Drinking Water, Department of Civil, Geological and Mining Engineering, Polytechnique Montréal, CP 6079, Succ. Centre-ville, Montréal, QC H3C 3A7, Canada
*
Author to whom correspondence should be addressed.
Presented at the 3rd International Joint Conference on Water Distribution Systems Analysis & Computing and Control for the Water Industry (WDSA/CCWI 2024), Ferrara, Italy, 1–4 July 2024.
Eng. Proc. 2024, 69(1), 86; https://doi.org/10.3390/engproc2024069086
Published: 9 September 2024

Abstract

:
Temperature is a crucial factor that can influence chemical and microbiological activities within building water systems. Due to factors like widespread water conservation programs or shutdowns resulting from events like the COVID-19 pandemic, water stagnation in these systems can escalate, impacting water temperature. By integrating EPANET-MSX with field data, this study seeks to simulate and analyze spatial and temporal fluctuations in water temperature and microbial growth resulting from temperature variations. The simulated temperature data and Legionella concentrations at three points are compared with field data during a period of three weeks. Overall, the modeled showerhead temperatures show good alignment with the monitored data, although underestimations occur in specific locations and time periods. The comparison between actual Legionella measurements and simulated concentrations, considering only temperature effects, demonstrates better alignment with field data for daily flushing showers. However, as stagnation increases, discrepancies between the modeled data and actual measurements suggest that other factors, such as available nutrients, may limit growth.

1. Introduction

Potable water systems can serve as a reservoir for Legionella pneumophila (Lp), an opportunistic pathogen. Transmission occurs through the inhalation of contaminated water aerosols, potentially leading to Legionnaires’ disease. Cold water heating over 25 °C and hot water cooling under 55 °C within building water systems is problematic, as warm environments have been associated with the presence of Legionella [1]. At times, thermostatic mixing valves (TMVs) can be employed to deliver tempered water, ensuring the prevention of scalding. However, these warm environments, jointly with large surface areas, creates an optimal niche in which biofilm and Legionella can proliferate [2].

2. Materials and Methods

2.1. Water Shower System Configuration and Experimental Setup

This study focuses on modeling temperature and Lp growth according to temperature variations in a large, grouped shower system within a five-story sports complex constructed in 1976 (Canada). This shower system distributes tempered water to 22 showerheads via a single thermostatic mixing valve (TMV). Detailed descriptions of this shower system and the building’s plumbing are available in [3]. For the purpose of this study, a simplified piping configuration of this large grouped shower system was created in EPANET. In this configuration, 2 or 3 adjacent showerheads are collectively represented by a single node in the model, referred to as a block (B).
Online temperature measurements were conducted continuously using a digital thermometer with a range of −50–300 °C at the TMV and three different blocks (B2, B4, and B7) in the shower system. After a 12-week period without any shower usage, the first sampling event took place on 16 November 2020. On the same day, immediate remedial flushing and shock chlorination with free chlorine was conducted. Following the mitigation intervention, on each weekday, showerheads were subjected to either daily flushing (5X/week: B1 and B2) or weekly flushing (1X/week: B4, B5) or were left stagnant (B7 and B8). Microbiological sampling (first-draw and five-minute flush samples) was carried out over the course of the three weeks, only on Mondays. The study timeline and details regarding water sample collection and processing can be found elsewhere [4].

2.2. Hydraulic and Water Quality Modeling

A constant flow rate of 12 lpm was applied to each showerhead in the model. Demand patterns for each block in the hydraulic model relied on available data on flushing times or temperature variations, potentially introducing inaccuracies during the validation process when comparing temperature measurements to modeling results. The model was run for a duration of 26 days, and the hydraulic and water-quality time steps were 15 s and 5 s, respectively. The water temperature recorded over 26 days, obtained from online temperature sensors at the TMV, was utilized as the input in the model at the TMV. A time step of 15 s was employed for integrating the pattern into the hydraulic model, and in cases of missing data, the last recorded data were utilized. For simplification, the simulations assumed a constant room temperature of 24.5 °C, although measured data showed fluctuations between 21.8 °C and 26.1 °C. In the model, the Lp concentration at the entrance of the shower system was set to 645 gc/L. This value was determined by averaging the results of 5 min flush samples collected at 1-, 2-, and 3-week intervals following the mitigation interventions in the daily flushed showers (B2 and B4) located closest to the TMV.
In this context, temperature was modeled according to the methodology outlined in [5]. In the model, pipes were classified as either free or isolated, based on observation in the field. Lp variable growth over time (dLp/dt) as a function of water temperature (T) was simulated using the growth curve in [5], with optimal and minimal growth temperatures of T o p t = 37 °C and T m i n = 15 °C and growth of μ m a x = 1.15 × 10⁻⁵ s−1 at the optimal temperature:
d L p d t = μ m a x · exp T T o p t 2 0.2 * T m i n T o p t 2 · L p

3. Results and Discussion

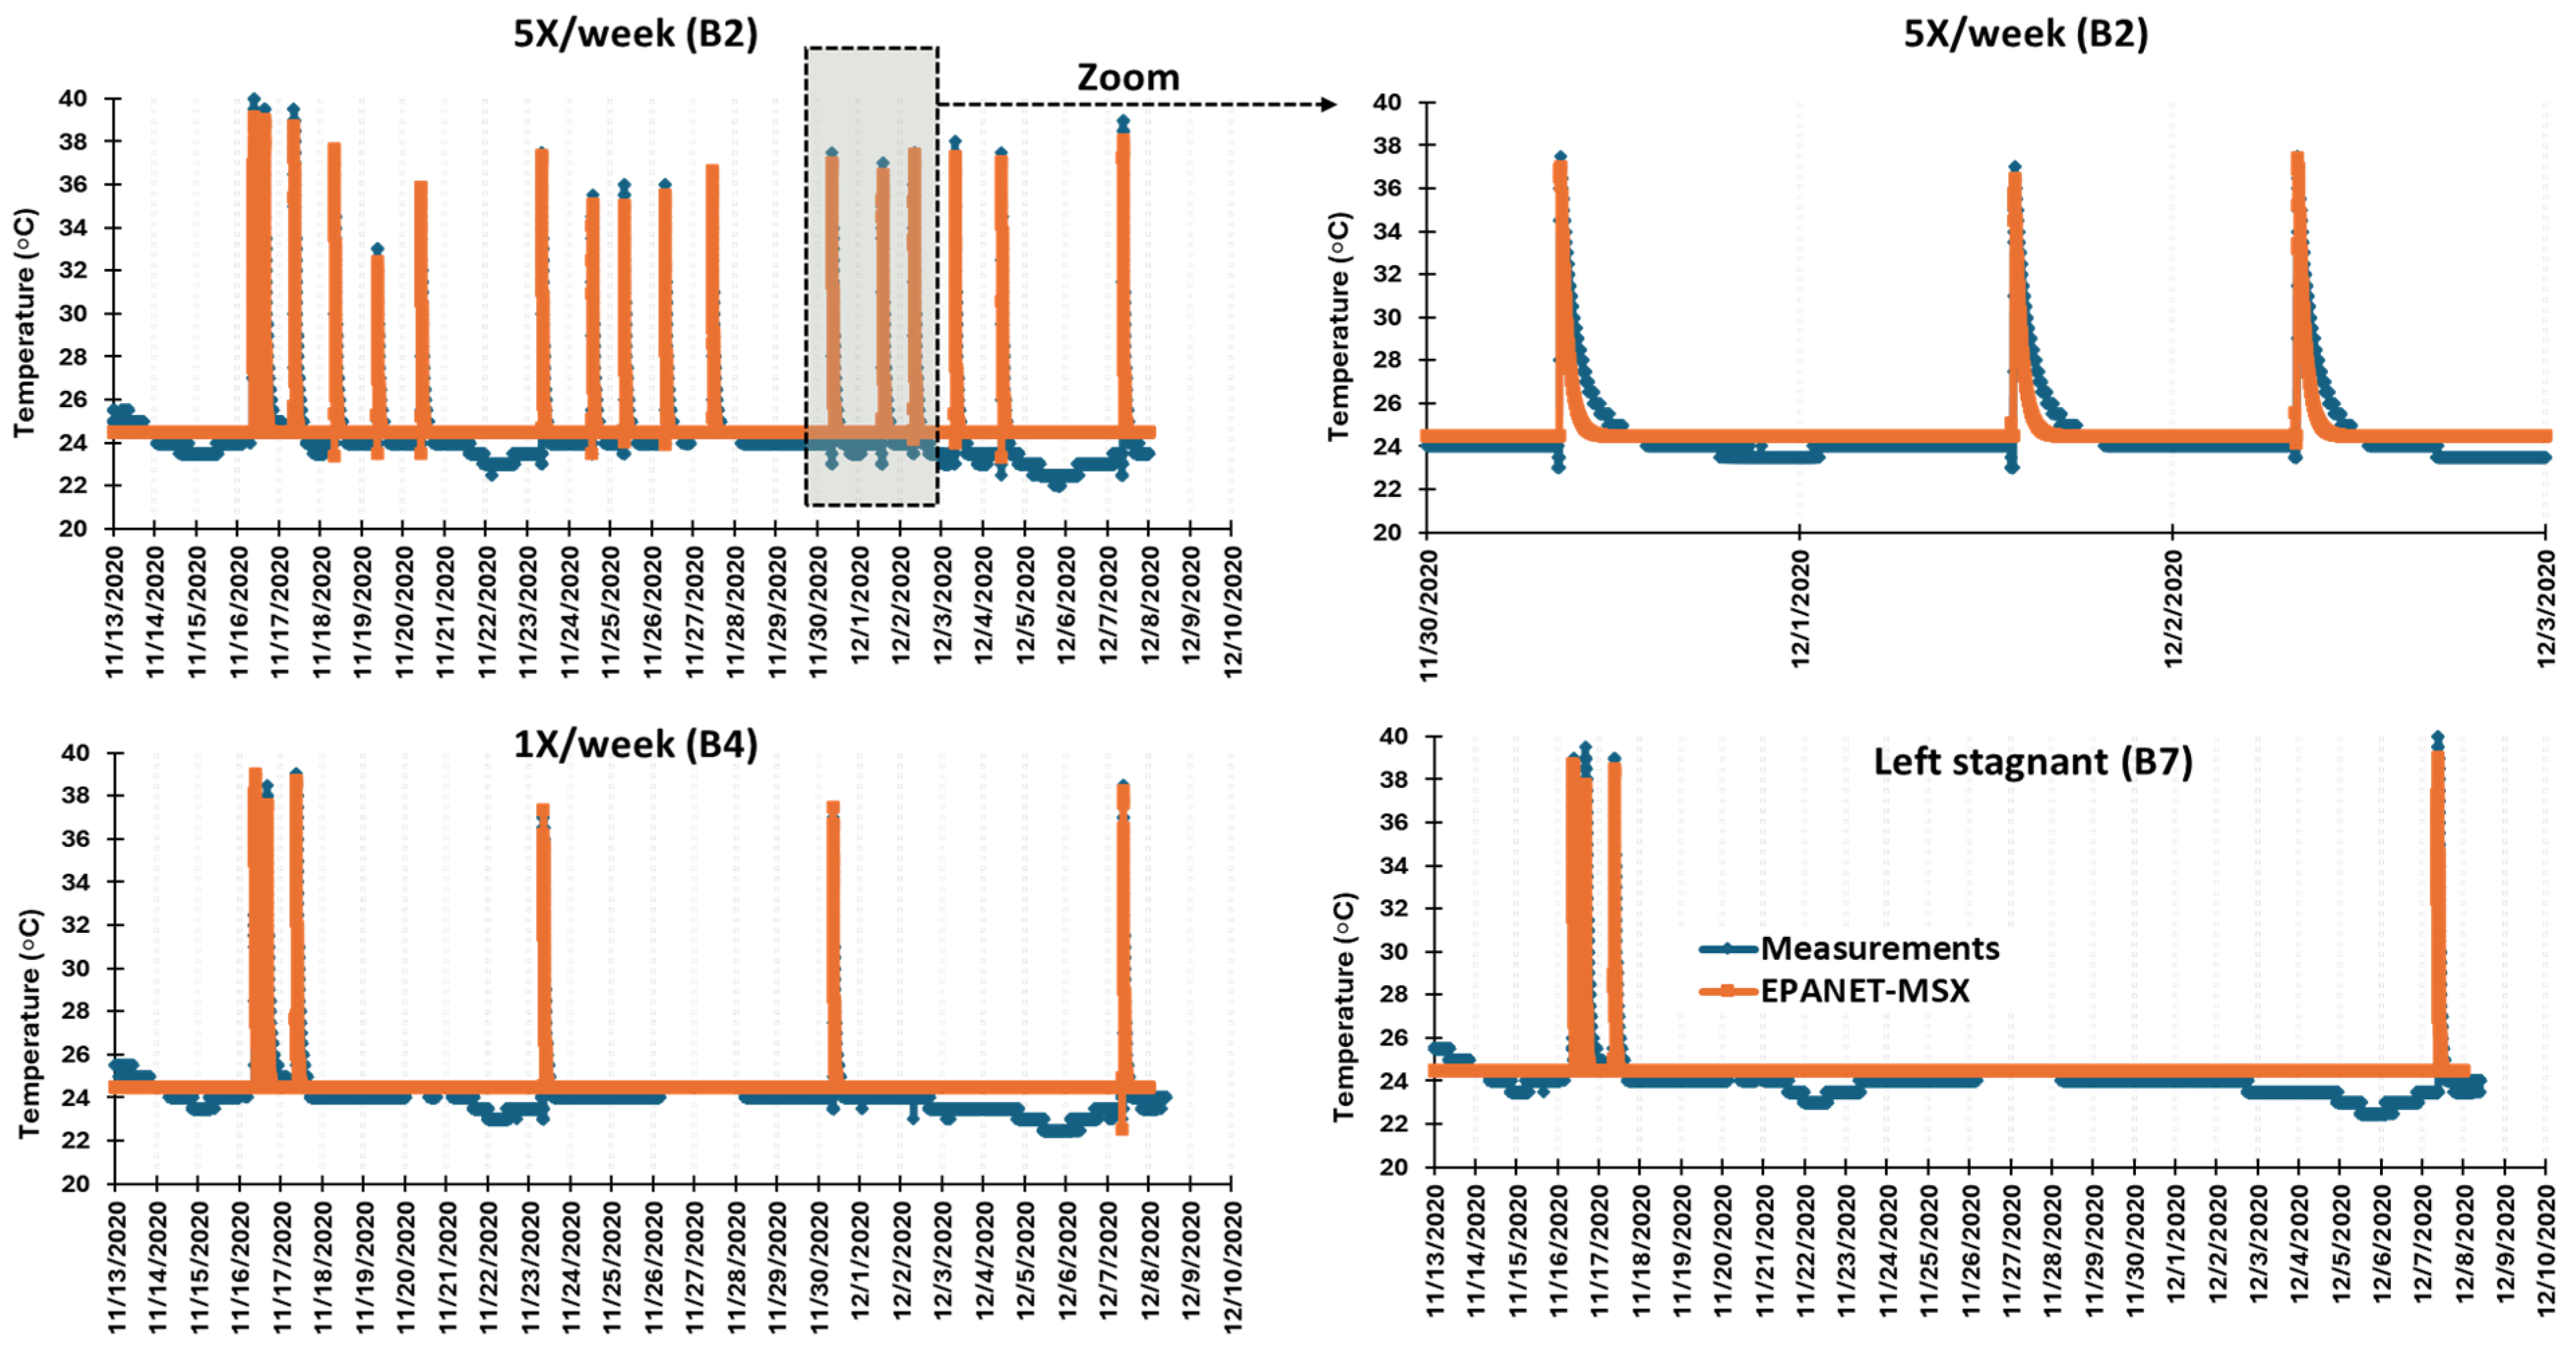
3.1. Spatial and Temporal Variation in Temperature

In this analysis, we compared the temperature values obtained from measurements with those calculated by our model at three distinct locations: B2, B4, and B7 (Figure 1). The maximum simulated temperatures at the three blocks during the usage period closely aligned with the measured data, with differences of up to 2 °C at most. However, during temperature decrease in stagnation, the model typically reached ambient temperature more rapidly compared to the measured data. The differences between the modeled and measured temperatures can be attributed to several assumptions made in the model, which may not accurately represent reality. These include factors such as pipe thickness, diameter, flow rates at the showerheads, usage patterns, system configuration simplifications, ambient temperature variations, and pipe insulation, among others.

3.2. Spatial and Temporal Variation in Microorganisms

The simulated Lp concentrations were compared with first-draw and 5 min flush samples collected at 1-, 2-, and 3-week intervals following the mitigation interventions, indicated by red circles (Figure 2). Green circles represent qPCR Lp measurements after 12 weeks of distal stagnation not directly comparable to the model results due to the absence of a simulation for this period but shown as a reference of the initial state. The first-draw samples after the 12-week distal stagnation for B2, B4, and B7 ranged from 9300 to 12,300 gc/L. Three weeks after shock chlorination with preventative flushing—implemented daily or weekly, or left stagnant—the concentration of the first-draw samples decreased to 1260, 1350, and 1980 gc/L, respectively. The study showed that when the shower was flushed daily, there was a good agreement with field data in general, as depicted in Figure 2. However, when stagnation increased, there was more disagreement between the modeled data (which only considered temperature changes) and the actual measurements. This discrepancy can be attributed to various factors, such as growth rate, nutrient limitation, or the effects of shock chlorination in the field. Previous studies highlighted that extended periods of stagnation might not consistently lead to ongoing microbial growth, suggesting variability influenced by factors like nutrient availability, especially in the absence of disinfectant measures [4,6].

4. Conclusions

Numerical modeling tools can serve as invaluable assets for designing and accurately estimating exposure to minimize public health risks and effectively manage building water systems. This study specifically focused on simulating temperatures within a shower system, modeling Legionella growth in bulk in response to temperature variations and interpreting and validating these simulations through field measurement data. The results emphasize the necessity for further investigation to incorporate additional factors that influence Legionella bacteria within building water systems, including nutrient availability, chlorine levels, and biofilm detachment. Such a comprehensive understanding is essential when using mechanistic models to develop robust strategies to mitigate the risk of Legionnaires’ disease and ensure the safety of water systems.

Author Contributions

Conceptualization: F.H., M.G.-C., and M.P.; methodology, F.H., M.G.-C., C.O., and M.P.; software, F.H.; validation, F.H., C.O., and M.P.; formal analysis, F.H., C.O., and M.P.; writing—original draft preparation, F.H.; writing—review and editing, C.O., M.G.-C., and M.P.; visualization, F.H., C.O., and M.P.; supervision, M.P.; project administration, M.P.; funding acquisition, M.P. All authors have read and agreed to the published version of the manuscript.

Funding

This research was funded by the Industrial Chair on Drinking Water at Polytechnique Montreal (NSERC-ALLRP 560764–20).

Institutional Review Board Statement

Not applicable.

Informed Consent Statement

Not applicable.

Data Availability Statement

Some or all of the data used/generated during the study are available from the corresponding author by request.

Acknowledgments

The authors acknowledge Yves Fontaine from Polytechnique Montreal for technical support, as well as the sports complex building employees and managers.

Conflicts of Interest

The authors declare no conflicts of interest.

References

  1. Bédard, E.; Fey, S.; Charron, D.; Lalancette, C.; Cantin, P.; Dolcé, P.; Laferrière, C.; Déziel, E.; Prévost, M. Temperature diagnostic to identify high risk areas and optimize Legionella pneumophila surveillance in hot water distribution systems. Water Res. 2015, 71, 244–256. [Google Scholar] [CrossRef] [PubMed]
  2. National Academies of Sciences, Engineering, and Medicine (NASEM). Management of Legionella in Water Systems; The National Academies Press: Washington, DC, USA, 2019; p. 304. [Google Scholar]
  3. Grimard-Conea, M.; Deshommes, E.; Doré, E.; Prévost, M. Impact of recommissioning flushing on Legionella pneumophila in a large building during the COVID-19 pandemic. Front. Water 2022, 4. [Google Scholar] [CrossRef]
  4. Grimard-Conea, M.; Prévost, M. Controlling Legionella pneumophila in Showerheads: Combination of Remedial Intervention and Preventative Flushing. Microorganisms 2023, 11, 1361. [Google Scholar] [CrossRef] [PubMed]
  5. Moerman, A. Drinking Water Temperature Modeling in Domestic Systems, in Civil Engineering; Delft University of Technology (TU Delft): Delft, The Netherlands, 2013; p. 84. [Google Scholar]
  6. Rhoads, W.J.; Ji, P.; Pruden, A.; Edwards, M.A. Water heater temperature set point and water use patterns influence Legionella pneumophila and associated microorganisms at the tap. Microbiome 2015, 3, 67. [Google Scholar] [CrossRef]
Figure 1. Comparison of temperature values measured and calculated over time at three locations (B2, B4, and B7).
Engproc 69 00086 g001
Figure 2. Comparison of Legionella pneumophila concentrations measured and calculated over time at 3 locations (B2, B4, and B7). Green circles represent the qPCR Legionella pneumophila results following a 12-week distal stagnation period not included in simulations.
Engproc 69 00086 g002
Disclaimer/Publisher’s Note: The statements, opinions and data contained in all publications are solely those of the individual author(s) and contributor(s) and not of MDPI and/or the editor(s). MDPI and/or the editor(s) disclaim responsibility for any injury to people or property resulting from any ideas, methods, instructions or products referred to in the content.

