Proceeding Paper

Leak Localization Using Autoencoders and Shapley Values †

by
Prasanna Mohan Doss
*,
Marius Møller Rokstad
and
Franz Tscheikner-Gratl
Department of Civil and Environmental Engineering, The Norwegian University of Science and Technology (NTNU), 7031 Trondheim, Norway
*
Author to whom correspondence should be addressed.
Presented at the 3rd International Joint Conference on Water Distribution Systems Analysis and Computing and Control for the Water Industry (WDSA/CCWI 2024), Ferrara, Italy, 1–4 July 2024.
Eng. Proc. 2024, 69(1), 92; https://doi.org/10.3390/engproc2024069092
Published: 10 September 2024

Abstract

:
This study outlines the use of a game theoretic approach for preliminary leak localization in water distribution networks. The proposed method consists of an autoencoder model at its core, trained to reconstruct input pressure signals recorded during nominal operation. Any significant change in the signal reconstructions is attributed to the presence of leaks and is determined by tracking statistical discrepancies using a sliding-window changepoint detection technique. Consequently, Shapley values are computed to identify the most influential sensors and approximate localization. With this approach, abrupt leaks were estimated within the 100 m radius and for incipient leaks at high flow rates.

1. Introduction

For many water utilities worldwide, one of the most difficult tasks is locating leaks in water distribution networks (WDNs). In Norway, about 30% of water is lost through leaking pipelines [1]. The problem of detecting and locating leaks is challenging due to the complexity of network size, aging infrastructure, and urbanization. It also leads to potential health hazards due to low pressure points [2]. Leak detection and localization has been an active area of research since the early 1990s. Over the years, there have been several approaches developed by researchers all over the world, the main categories being model-based approaches, data-driven approaches, and in recent years, a combination of both approaches, namely hybrid methods. A detailed overview of these approaches can be found in [3]. In recent years, due to the availability of computing power and low-cost sensors, there has been a strong transition towards adopting digital solutions for efficient operation and monitoring of WDNs [4]. In this study, a data-driven prediction modelling approach is proposed for leak localization. It encompasses a deep neural network model for predictions followed by time-series analysis for detecting the onset of leaks, and finally application of model explainability through Shapley values for approximate localization. The following assumptions are made in the proposed study.
  • The pressure sensors are sufficiently available and placed at optimal locations for monitoring leaks.
  • Measurements during no-leak periods or at pressures estimated from a calibrated hydraulic model are available.
  • The measurement data are of good quality and span different scenarios for training data-driven models.

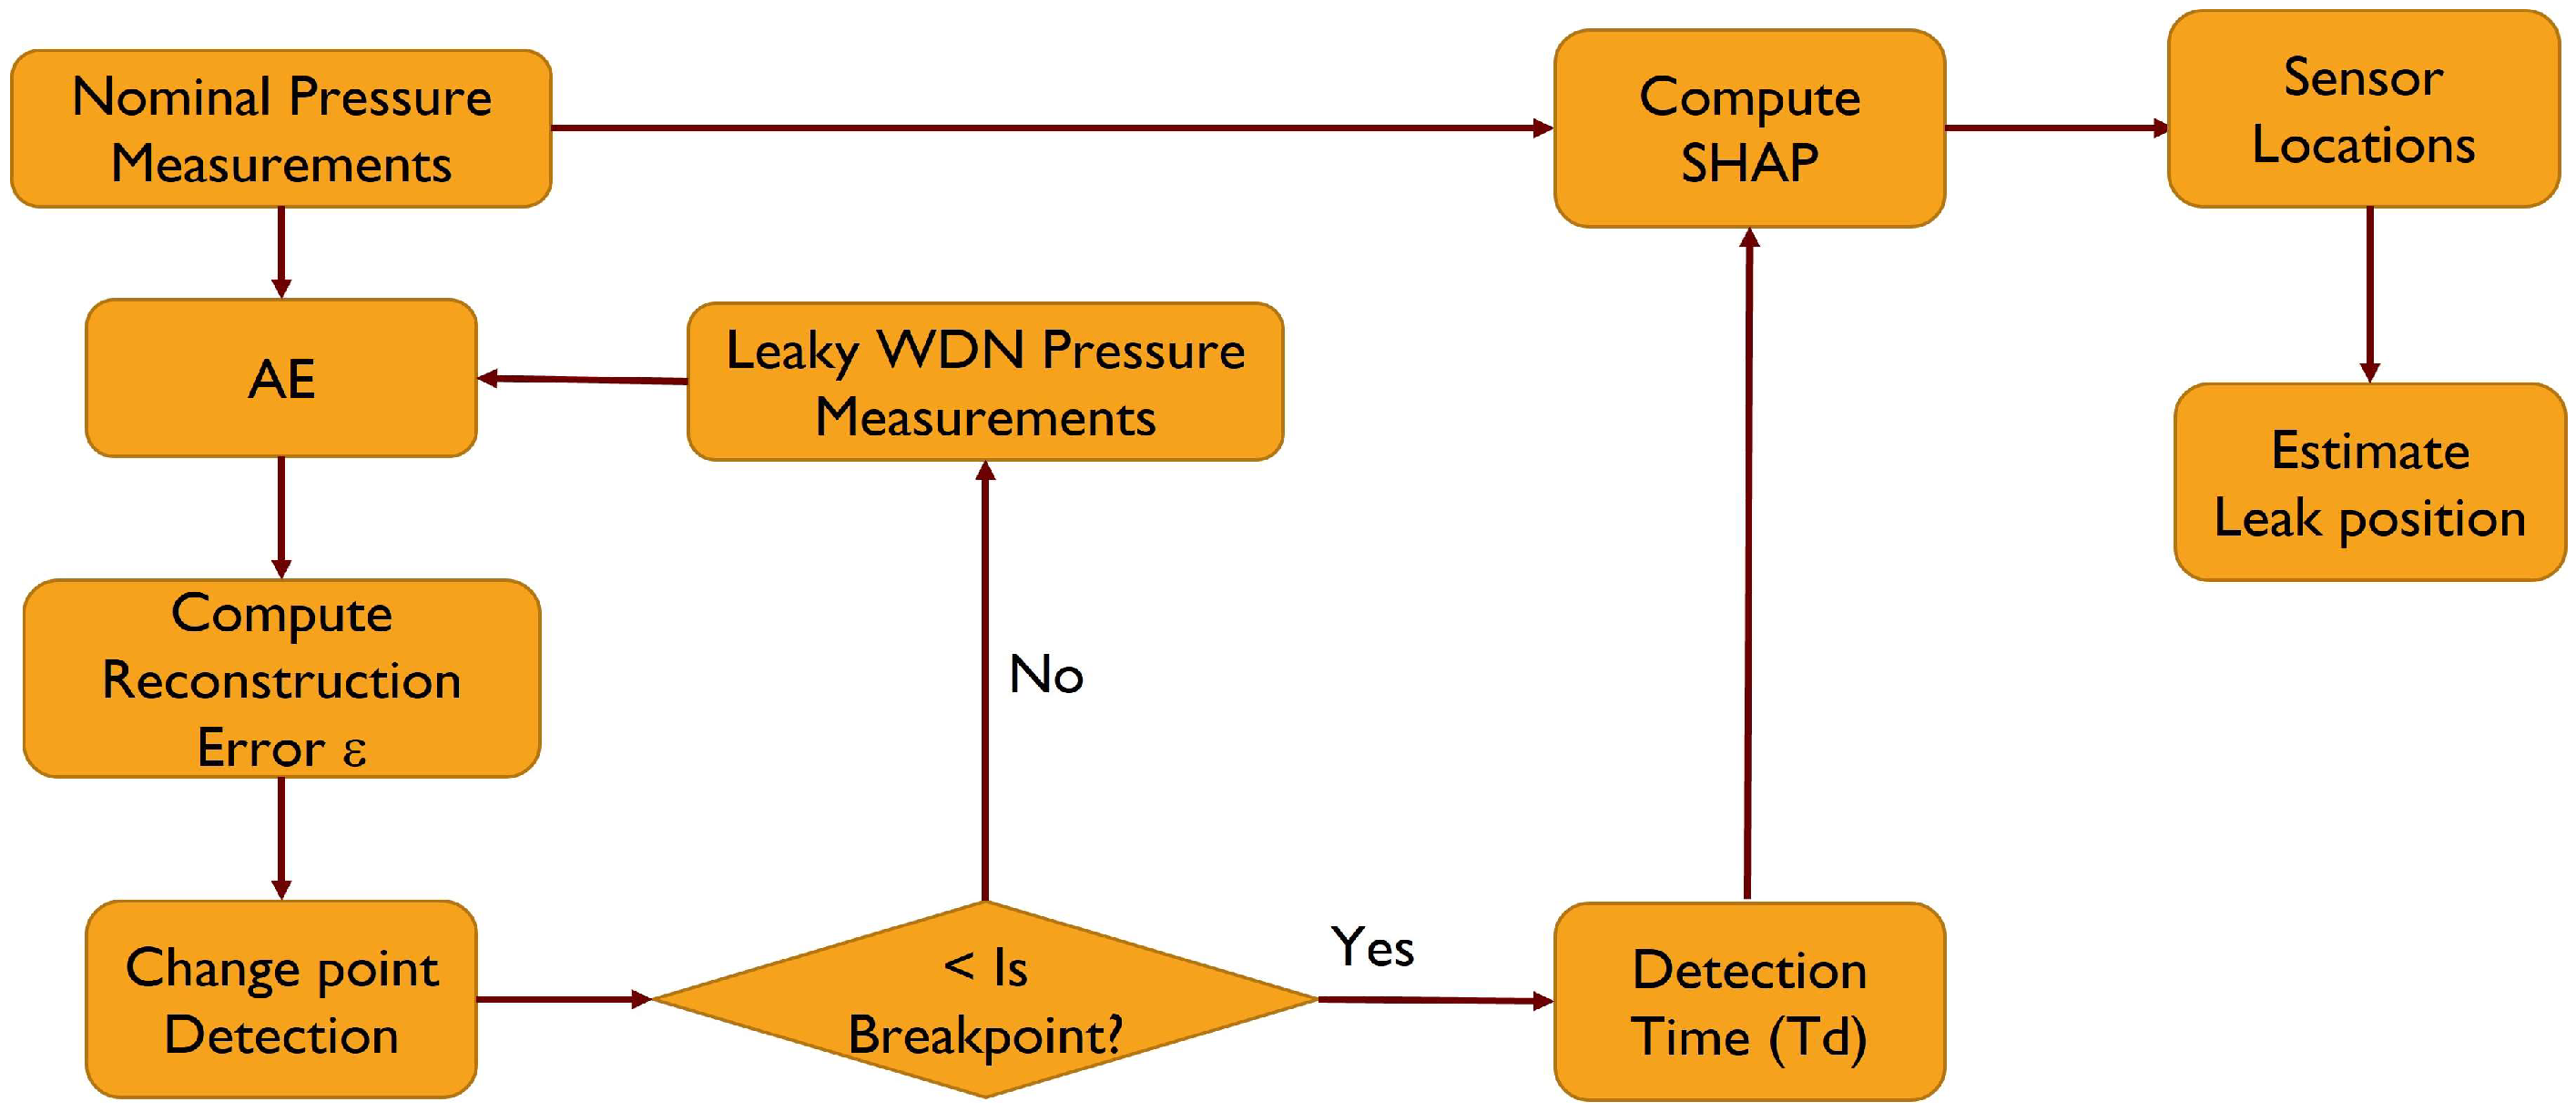
2. Materials and Methods

The methodology in this study can be described in three successive steps. In step 1, pressure signals recorded during normal operations of WDN, i.e., assuming no leak scenarios, are used for autoencoder training and evaluation. The autoencoder is trained in a semi-supervised manner to reconstruct the original pressure signals. In the next step, the mean squared errors (MSE) obtained from signal reconstructions are used for detecting any anomalous events. It is assumed that any significant change in statistical properties (i.e., mean and variance) of the signal reconstructions is due to the onset of leaks. In step 3, for each of the detected anomalous events, Shapley additive values are computed to determine the most contributing and most offsetting features of the neural network model. In this study, all input features correspond to pressure sensors that are used for network monitoring. Hence, Shapley values provide the most significant sensors that show large deviations due to leaks. Assuming that the sensors are optimally placed over the network for efficient monitoring and the locations are known, an approximate location of leak can be obtained by weighting the sensor locations with their corresponding Shapley weights. The overall steps followed are shown in Figure 1.
A brief background on each of the above steps is presented below.

2.1. Step 1: Autoencoders (AE)

Autoencoders are a class of neural networks that reconstruct the input features. They are used for efficiently learning large number of features without explicit need for labelling [5]. The autoencoder consists of two sections: an encoder (E) and a decoder (D). The encoder network learns the significant features of input combinations through non-linear transformation from input dimension x ^ Rm to a lower dimensional space as latent vector z Rn. The decoder then transforms them back into original space as reconstructions x ^ Rm. At every time step t, the mean squared error is computed using x t x ^ t 2 .

2.2. Step 2: Changepoint Detection

During normal operations, the input signals and reconstruction from autoencoders are close, and hence the MSE error is centered around zero, with some background noise due to prediction and measurement error. However, when a leak occurs, there is a significant change in mean and variance in MSE time series. The problem of time to detect leak can therefore be translated into changepoint detection using the obtained MSE time series. A sliding-window-based changepoint detection technique is used [6]. For a sliding window of size T, the sequence is sub-divided into two adjacent windows (a) and (b). Then a two-sample test is done to find whether there exists a significant difference between the means of the two windows. This process is repeated until the entire sequence length is analyzed for changepoints. In this study, based on a trial-and-error approach, a window length of 60 samples corresponding to 5 h is used.

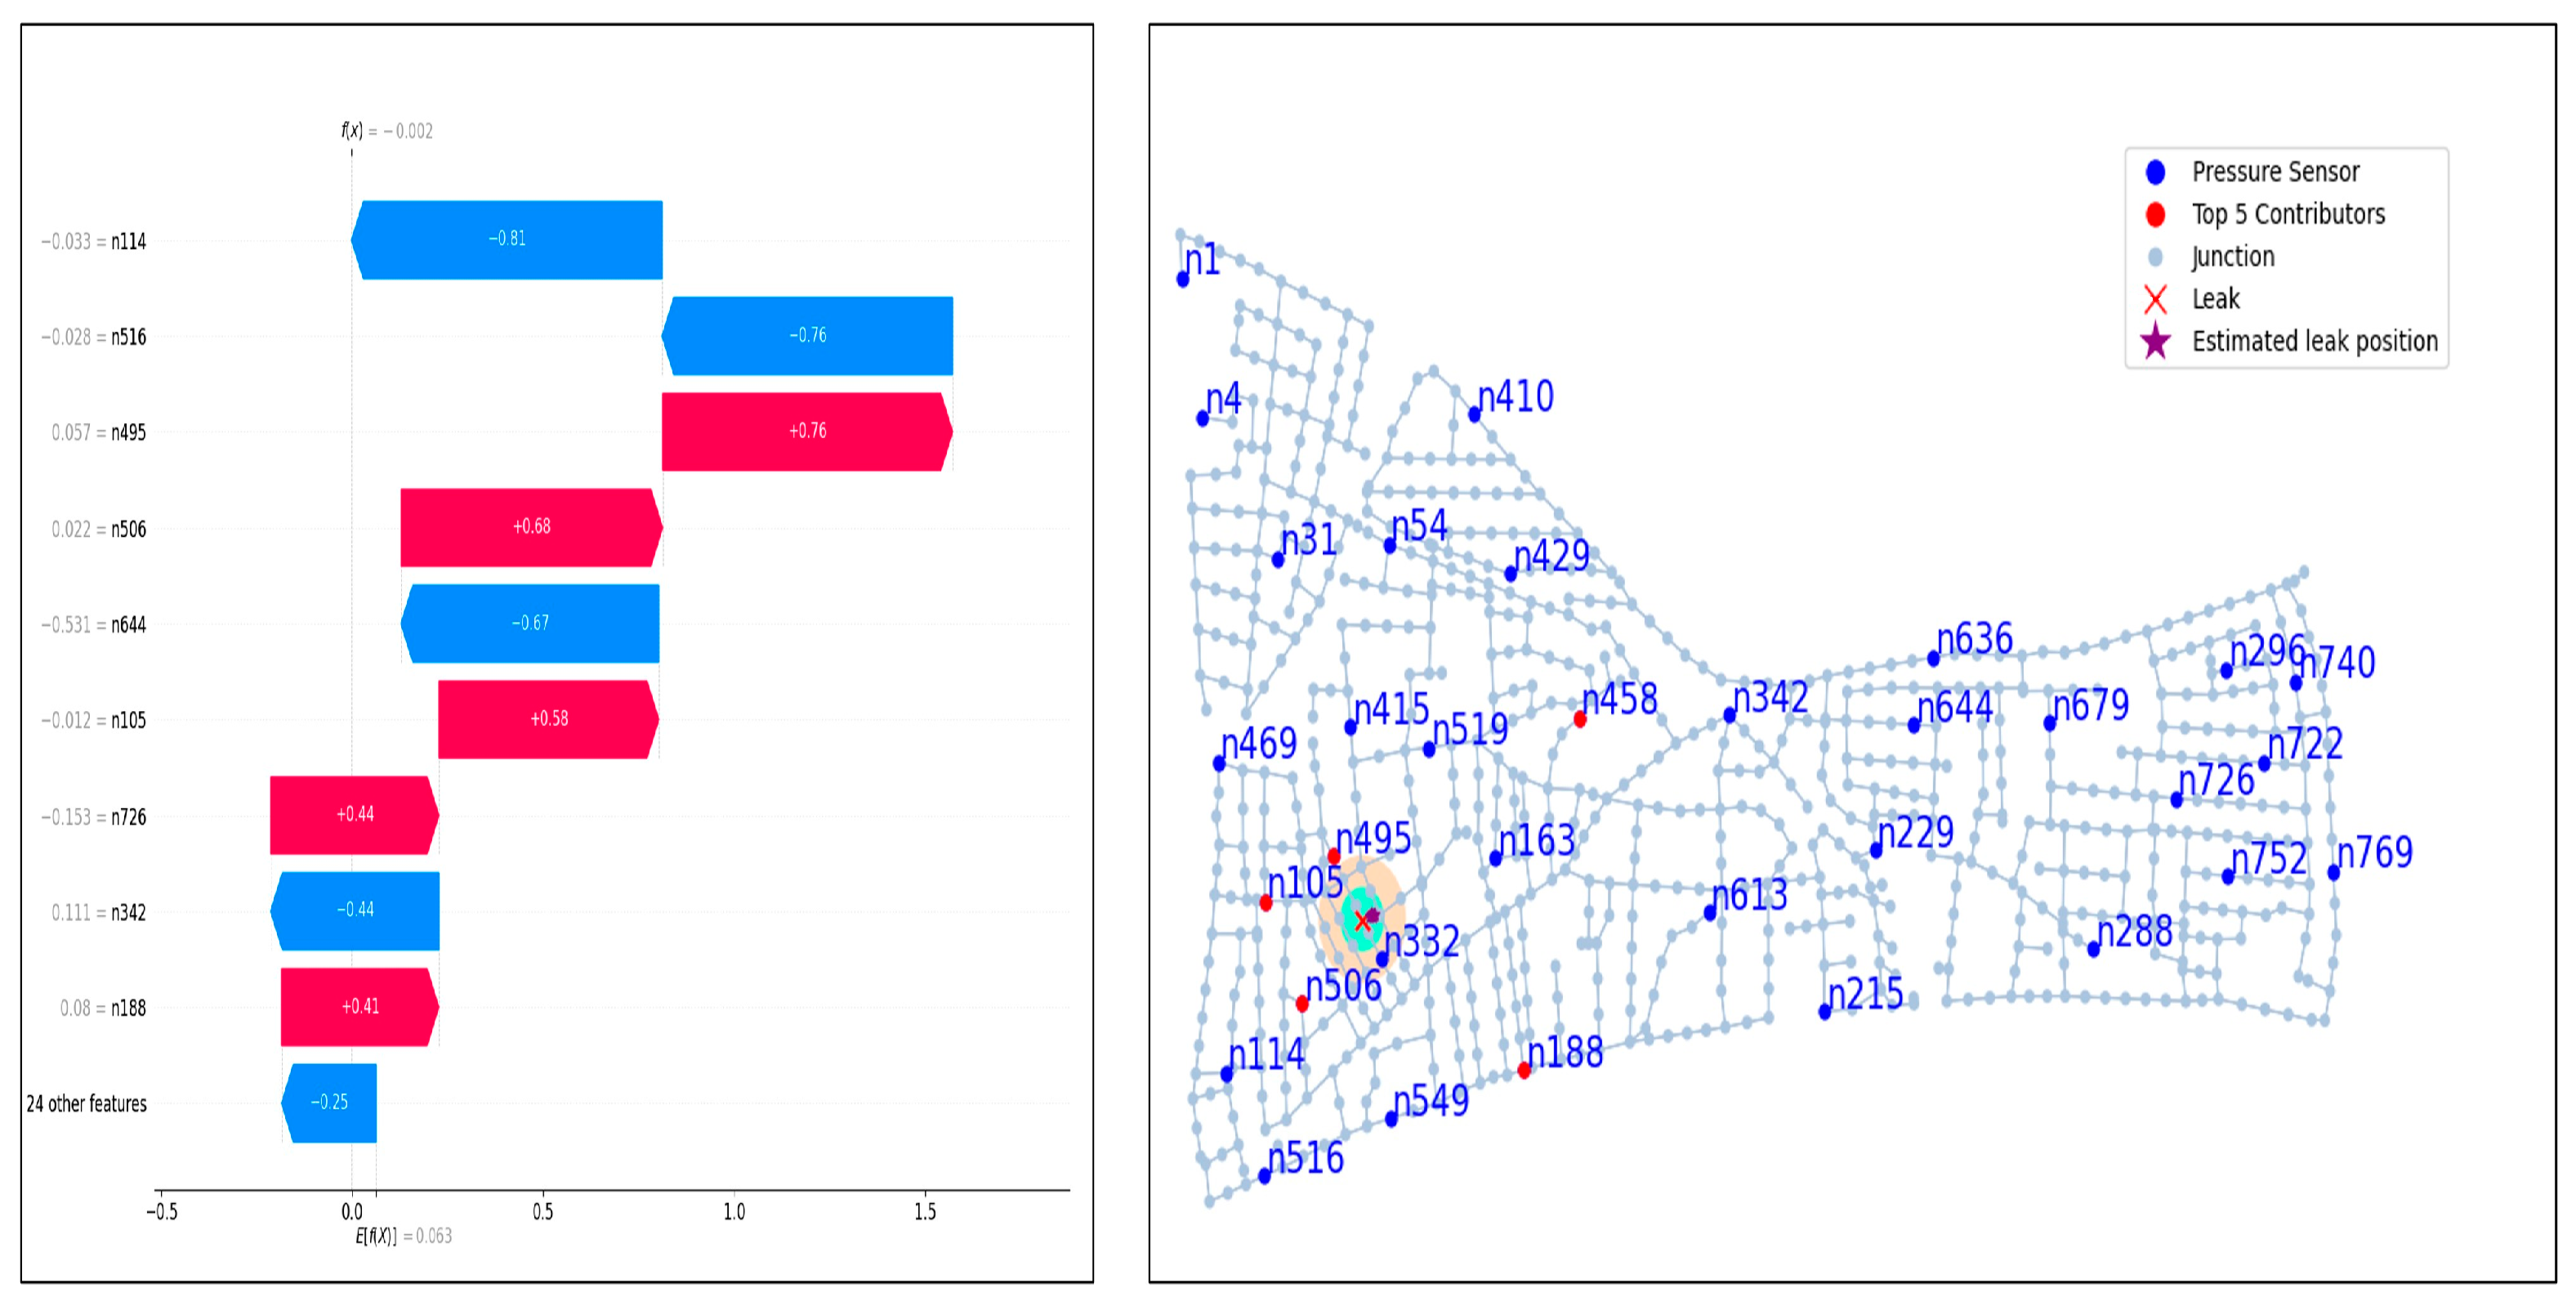
2.3. Step 3: Computation of Shapley Values

In the first two steps, the method determines when a leak can be attributed, but it does not give much information on why the MSE error was high for certain time stamps and which input features are contributing to this high MSE error. This determination is especially difficult with black-box models like machine learning and deep neural networks. This is described as model explainability and has been discussed in detail in the literature [7]. Briefly summarized, for any black-box model f and input data x, the model outputs can be explained by computing SHAP (SHapley Additive exPlanations). The SHAP values are calculated by computing interactions among input variables x while considering the effects and absence of one or more subsets of input features.
For the leak localization problem, we take sensors as input features and compute SHAP values on the MSE errors. Hence, for each detected leak event from step 2, a set of the most contributing sensors can be determined from their Shapley values Sx. Ideally, the sensors that are closest to the leak will have larger deviations than the other sensors. Hence the preliminary leak location can be estimated by weighing the sensor coordinates (xx, yy) with the Shapley values Sx.

3. Results and Discussion

To demonstrate this methodology, the widely studied L-Town benchmark network is used [8]. In this study, the nominal hydraulic model without any leak scenarios is simulated and used for training. For the simulated single-leak scenarios, the leak is assumed to be at the center of the pipes and modelled as an extra demand. Two kinds of leaks, an abrupt leak emulating a burst and incipient leaks representing background leaks, are simulated. The autoencoder model is then trained and the MSE time series are obtained for different leak scenarios.
The following figures illustrate an exemplary case for an abrupt leak at pipe p514. The most contributing sensors for high MSE errors have high +ve SHAP values, and the sensors with high -ve values are offsetting sensors that tend to make net MSE error close to the expected MSE value. The top contributing and offsetting features are shown in Figure 2 (left), and the estimated leak position as determined by weighting sensor locations with the top five contributing features is shown in Figure 2 (right).
The proposed method showed promising preliminary localization of leaks within a 100 m radius for abrupt leaks. However, for incipient leaks, a comparable localization precision is obtained only when the leak flow rates are higher (greater than 5 m3/h). In the future, combining fast leak detection techniques with explainable models could improve localization accuracy for background leaks.

Author Contributions

Conceptualization, P.M.D.; methodology, P.M.D., M.M.R., and F.T.-G.; software, P.M.D.; validation, P.M.D.; formal analysis, P.M.D.; investigation, P.M.D.; resources, M.M.R. and F.T.-G.; data curation, P.M.D.; writing—original draft preparation, P.M.D.; writing—review and editing, M.M.R. and F.T.-G.; visualization, P.M.D.; supervision, M.M.R. and F.T.-G.; project administration, P.M.D., M.M.R., and F.T.-G.; funding acquisition, F.T.-G. All authors have read and agreed to the published version of the manuscript.

Funding

This work has been funded by the European Union’s Horizon 2020, under grant agreement No. 869171 (B-WaterSmart).

Institutional Review Board Statement

Not applicable.

Informed Consent Statement

Not applicable.

Data Availability Statement

The original data presented in the study are openly available at https://doi.org/10.5281/zenodo.4017659 on 15 March 2023).

Conflicts of Interest

The authors declare no conflicts of interest.

References

  1. Statistics Norway. Available online: https://www.ssb.no/en/natur-og-miljo/vann-og-avlop/statistikk/kommunal-vannforsyning (accessed on 15 January 2024).
  2. Odhiambo, M.; Viñas, V.; Sokolova, E.; Pettersson, T.J.R. Health risks due to intrusion into the drinking water distribution network: Hydraulic modelling and quantitative microbial risk assessment. Environ. Sci. Water Res. Technol. 2023, 9, 1701–1716. [Google Scholar] [CrossRef]
  3. Hu, Z.; Chen, B.; Chen, W.; Tan, D.; Shen, D. Review of model-based and data-driven approaches for leak detection and location in water distribution systems. Water Supply. 2021, 21, 3282–3306. [Google Scholar] [CrossRef]
  4. Cominola, A.; Giuliani, M.; Piga, D.; Castelletti, A.; Rizzoli, A.E. Benefits and challenges of using smart meters for advancing residential water demand modeling and management: A review. Environ. Model. Softw. 2015, 72, 198–214. [Google Scholar] [CrossRef]
  5. Baldi, P. Autoencoders, Unsupervised Learning, and Deep Architectures. In Proceedings of the ICML Workshop on Unsupervised and Transfer Learning, Washington, DC, USA, 2 July 2011. [Google Scholar]
  6. Truong, C.; Oudre, L.; Vayatis, N. Selective review of offline change point detection methods. Signal Process. 2020, 167, 107299. [Google Scholar] [CrossRef]
  7. Lundberg, S.M.; Lee, S.I. A unified approach to interpreting model predictions. In Proceedings of the Advances in Neural Information Processing Systems, Long Beach, CA, USA, 4–9 December 2017. [Google Scholar]
  8. Vrachimis, S.G.; Eliades, D.G.; Taormina, R. Dataset of BattLeDIM: Battle of the Leakage Detection and Isolation Methods. Available online: https://zenodo.org/records/4017659 (accessed on 15 January 2024).
Figure 1. Algorithm for preliminary leak localization.
Engproc 69 00092 g001
Figure 2. Shapley values for leak alarm (left) and estimated leak location (right) for leak p514.
Engproc 69 00092 g002
Disclaimer/Publisher’s Note: The statements, opinions and data contained in all publications are solely those of the individual author(s) and contributor(s) and not of MDPI and/or the editor(s). MDPI and/or the editor(s) disclaim responsibility for any injury to people or property resulting from any ideas, methods, instructions or products referred to in the content.

