Abstract
In this study, a graph-based method is implemented for sensor placement in a water distribution network (WDN) instead of using a hydraulic model. The proposed methodology determines the pressure sensors’ location based on the node betweenness centrality of nodes from their source, considering the WDN topology and assigning hydraulic-inspired edge weights. Furthermore, the Non-dominated Sorting Genetic Algorithm (NSGA-II) determines the end node of the WDN’s critical paths for sensor placement to maximize monitoring network efficiency to calibrate the model and avoid additional data collection. For different numbers of sensors, the NSGA-II algorithm is implemented 10 times and the final Pareto front is determined. The graph-based approach reduces the sensor placement problem complexity to an acceptable level and can be implemented as a surrogate approach for hydraulic-based sensor placement.
1. Introduction
In the context of water distribution networks (WDNs), the mathematical models serve multiple functions, including WDN operation, pressure management, and leakage detection. However, before utilizing the model, it is crucial to calibrate WDNs using field data, such as information obtained from pressure sensors [1].
Previous studies used different criteria such as the value of nodal pressure sensitivity to WDN parameter variation and graph metrics to optimize the sensor location [2]. Furthermore, some studies determined the sensor location based on global sensitivity analysis [2,3]. This approach considers the interactions between different parameters and their effects on the model’s output. However, usually, such sensitivity analysis takes a significant amount of time, primarily due to the execution of hydraulic models.
In contrast to sensitivity analysis, graph theory-based methods require less computational time, e.g., De Schaetzen et al. and Fontana et al. determined the sensor location based on the graph theory method [4,5]. They located the sensors at the furthest distance from the source, and the distance was calculated based on the shortest path metric. Weber and Hos determined the sensor location based on pressure sensitivity to roughness variation and maximized the hydraulic distance between them utilizing the shortest path [1]. However, these graph-based approaches are unable to fully capture the hydraulic behavior of WDNs as a hydraulic model does. In recent years, some studies implemented weighted hydraulically inspired graphs instead of using hydraulic models of WDNs to decrease the computational time [6]. In the current study, a hydraulically weighted graph is used for sensor placement, mimicking the hydraulic behavior of WDNs. In the initial stage, nodes in a WDN are clustered based on source heights and energy dissipation along the shortest paths [7]. This is particularly important for multi-reservoir WDNs because if a graph-based approach is utilized for sensor placement in such networks, identifying the primary source of each node is essential in replicating the WDN hydraulic behavior. Furthermore, as inspired by Sitzenfrei et al. [8], this research, for the first time, proposed a modified graph metric called node betweenness centrality from source (NBC*) to identify a set of important nodes for sensor placement.
2. Materials and Methods
This research proposes a multi-objective optimization algorithm to determine the sensors’ location based on graph metrics. This methodology contains two main steps. In the first step, the NBC* of each node is calculated, and in the second step, the optimization algorithm determines the sensor location based on the NBC* of each node that has been produced in the first step.
2.1. Node Betweenness Centrality from Source (NBC*)
As the proposed method is implemented in a multi-source WDN, at first, the source primary supplying each node is determined based on a graph-based source tracking approach [9]. Afterward, the NBC* of a node N from the source to all nodes is calculated using Equation (1). NBC* counts how often node N is a part of the shortest path (σs,i) connections between the source s that supplies node N and the demand node i, which is inspired by the graph metrics proposed in [8].
2.2. Multi-Objective Optimization
The NSGA-II maximizes the first object function F1 based on Equation (2) to find the critical paths, representing the routes in a WDN with the highest water demand. Therein, NBC* is weighted with the nodal demands Qj and summed up along the critical flow paths. Additionally, it minimizes F2, defines the number of repeated nodes in all critical paths to avoid collecting redundant pressure data, and improves the coverage of the monitoring network. The decision variables are the sensor location at the final point of the critical paths. The number of critical paths is equal to the number of sensors in the proposed methodology.
where E is the number of critical flow paths; k is the end node of each critical path (CP); m is the first node index after the source in each critical path; and is the demand of node j in (m3/s).
2.3. Roughness Calibration and Validation
To validate the proposed methodology, the roughness calibration of the WDN is performed and the calibration accuracy is assessed. The genetic algorithm (GA) is utilized to determine the roughness of the pipes in the network. The roughness of each pipe group, based on the pipe’s original roughness, is treated as a decision variable, and the objective function is represented by Equation (3).
where S is the number of sensors; T is the number of time steps; Preal is the pressure of the node based original pipe roughness of the model; and Psim is the pressure of the nodes based on the roughness that is determined as a decision variable in the optimization algorithm. Afterwards, the pressure error is calculated based on Equation (3) for all nodes of the WDN.
3. Results
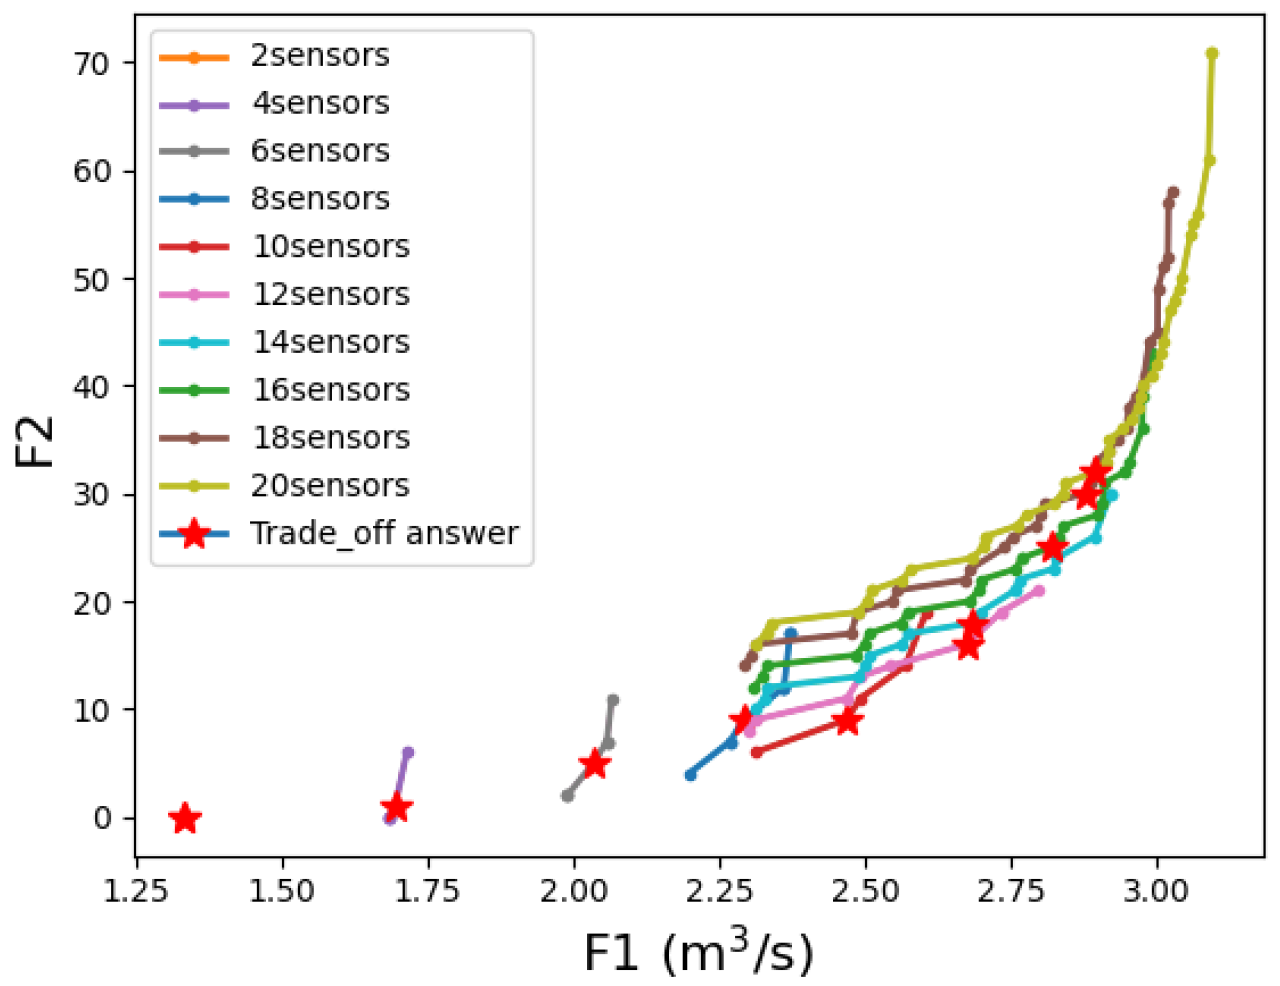
The proposed methodology in this study was implemented in the Modena WDN located in Italy, which consists of 268 junctions and 317 pipes. The results of the NSGA-II optimization method and the Pareto front for various numbers of sensors are depicted in Figure 1. It can be observed from Figure 1 that there is a trade-off between the number of repeated nodes and F1.
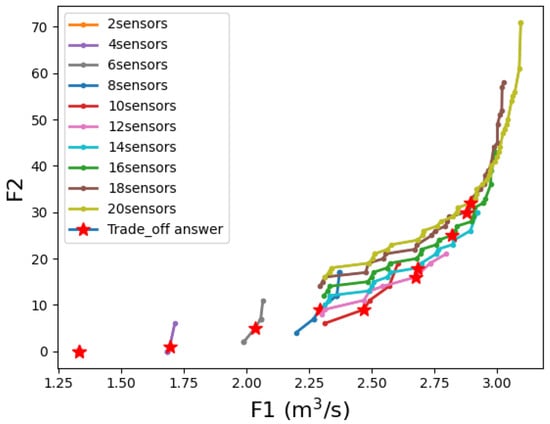
Figure 1.
Pareto front for different numbers of sensors and trade-offs associated with each solution.
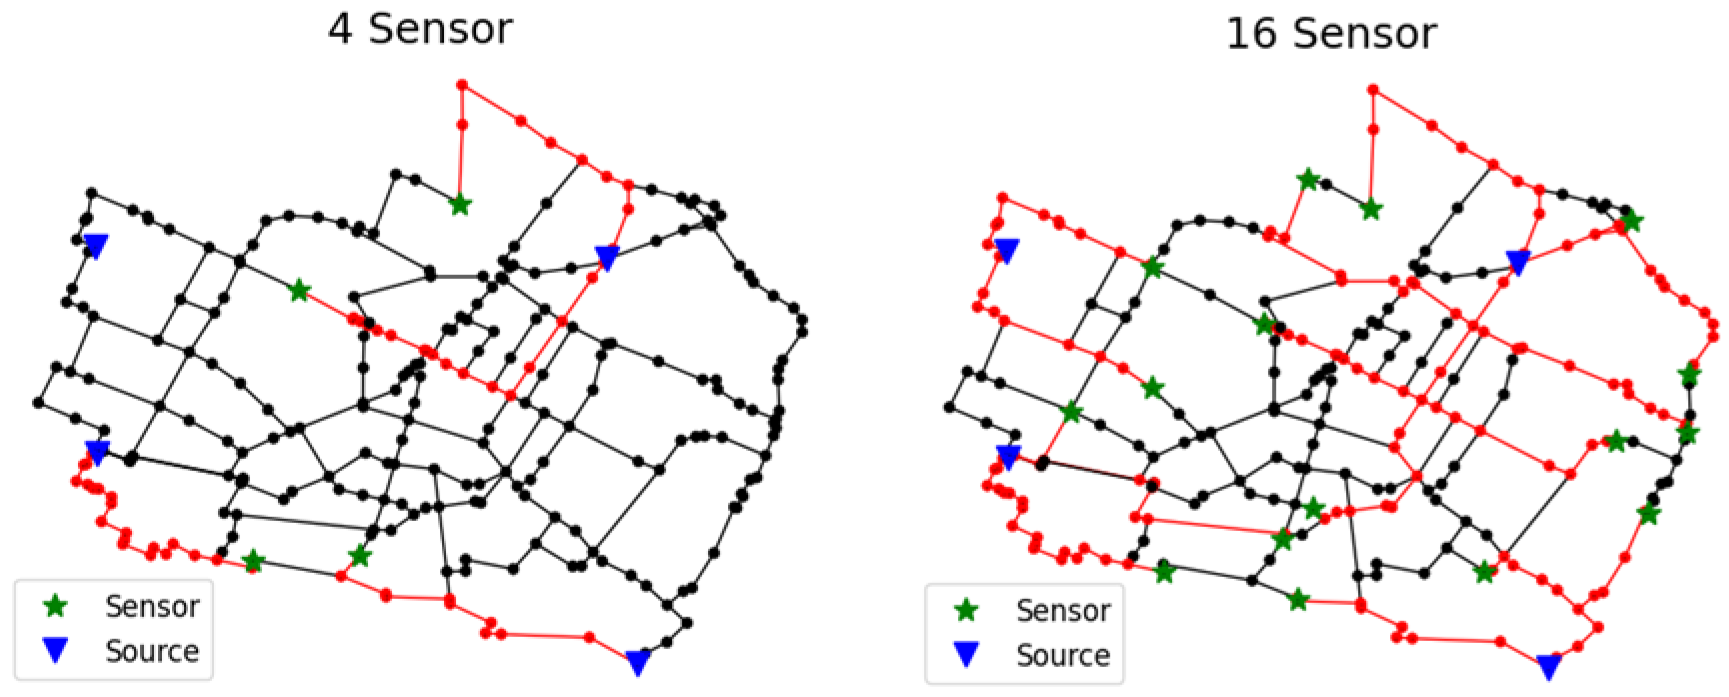
The trade-off solution in each Pareto front is chosen based on the compromise method and the point that has a lower distance from the utopia point that is selected in each Pareto front. This distance is calculated based on normalized objective function values from the utopia point [9]. Critical paths for calibration and sensor location at the end of these paths are shown in Figure 2. Furthermore, the calibration accuracy for the four, ten, twelve, and sixteen sensors is shown in Table 1. These scenarios are chosen based on clustering the best answers of the Pareto fronts.
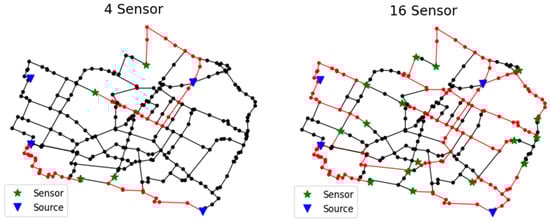
Figure 2.
Sensor location for 4 and 16 sensors.

Table 1.
Calibration accuracy for 4, 10, 12, and 16 sensors scenarios.
It is noteworthy that the average node pressure in the WDN, considering the actual roughness, stands at around 25 m. This indicates that the pressure error value calculated for ten sensors is almost 1% of the average pressure, representing high accuracy in the proposed model.
4. Discussion
This paper determines critical paths for WDN calibration based on NBC* and places the sensor at the end of these paths. The results show that the pipe roughness variation along these paths is sensed by the sensors. The number of ten sensors is in the shortest distance from the utopia point of optimization, and, according to Table 1, there is a noticeable improvement in the calibration accuracy with ten sensors, suggesting it as a suitable number for sensor placement.
Author Contributions
Conceptualization and methodology, M.R., M.H., M.T. and R.S.; software and validation, M.R.; formal analysis, M.R.; writing—original draft preparation, M.R.; writing—review and editing, M.R., M.H., M.T. and R.S; supervision, M.H., M.T. and R.S. All authors have read and agreed to the published version of the manuscript.
Funding
This research received no external funding.
Institutional Review Board Statement
Not applicable.
Informed Consent Statement
Not applicable.
Data Availability Statement
Data availability can be subject to request.
Conflicts of Interest
The authors declare no conflicts of interest.
References
- Wéber, R.; Hős, C. Efficient technique for pipe roughness calibration and sensor placement for water distribution systems. J. Water Resour. Plan. Manag. 2020, 146, 04019070. [Google Scholar] [CrossRef]
- Rajabi, M.; Tabesh, M. Pressure Sensor Placement for Leakage Detection and Calibration of Water Distribution Networks Based on Multiview Clustering and Global Sensitivity Analysis. J. Water Resour. Plan. Manag. 2024, 150, 04024010. [Google Scholar] [CrossRef]
- Abbasi Moghaddam, V.; Tabesh, M. Sampling design of hydraulic and quality model calibration based on a global sensitivity analysis method. J. Water Resour. Plan. Manag. 2021, 147, 04021035.5. [Google Scholar] [CrossRef]
- De Schaetzen, W.B.F.; Walters, G.A.; Savic, D.A. Optimal sampling design for model calibration using shortest path, genetic and entropy algorithms. Urban Water. 2000, 2, 141–152. [Google Scholar] [CrossRef]
- Fontana, N.; Giugni, M.; Gliozzi, S.; Vitaletti, M. Shortest path criterion for sampling design of water distribution networks. Urban Water J. 2015, 12, 154–164. [Google Scholar] [CrossRef]
- Hajibabaei, M.; Yousefi, A.; Hesarkazzazi, S.; Minaei, A.; Jenewein, O.; Shahandashti, M.; Sitzenfrei, R. Resilience enhancement of water distribution networks under pipe failures: A hydraulically inspired complex network approach. AQUA—Water Infrastruct. Ecosyst. Soc. 2023, 72, 2358–2376. [Google Scholar] [CrossRef]
- Hajibabaei, M.; Hesarkazzazi, S.; Minaei, A.; Savić, D.; Sitzenfrei, R. Pareto-optimal design of water distribution networks: An improved graph theory-based approach. J. Hydroinform. 2023, 25, 1909–1926. [Google Scholar] [CrossRef]
- Sitzenfrei, R.; Wang, Q.; Kapelan, Z.; Savić, D. Using complex network analysis for optimization of water distribution networks. Water Resour. Res. 2020, 56, e2020WR027929. [Google Scholar] [CrossRef] [PubMed]
- Marler, R.T.; Arora, J.S. Survey of multi-objective optimization methods for engineering. Struct. Multidiscip. Optim. 2004, 26, 369–395. [Google Scholar] [CrossRef]
Disclaimer/Publisher’s Note: The statements, opinions and data contained in all publications are solely those of the individual author(s) and contributor(s) and not of MDPI and/or the editor(s). MDPI and/or the editor(s) disclaim responsibility for any injury to people or property resulting from any ideas, methods, instructions or products referred to in the content. |
© 2024 by the authors. Licensee MDPI, Basel, Switzerland. This article is an open access article distributed under the terms and conditions of the Creative Commons Attribution (CC BY) license (https://creativecommons.org/licenses/by/4.0/).