Abstract
Modelling multiple pipe failure scenarios in stormwater networks is a challenging task due to the computational burden of conventional methods. In this context, this study proposes a hybrid graph hydrodynamic model (GHM) that combines the advantages of graph theory and hydrodynamic modelling to enhance the identification of critical pipe failures (i.e., computationally efficient and high accuracy). First, based on graph theory, critical pipe combinations are identified, followed by hydrodynamic modelling to accurately assess the flooding impacts of these critical combinations. The findings underscore the effectiveness of GHM, particularly in scenarios requiring numerous simulation runs.
1. Introduction
Urban stormwater networks (USNs) are critical infrastructures that help mitigate pluvial flooding by draining stormwater from urban areas [1]. Criticality analysis in USNs can serve as a foundation for risk-based asset management, which can lead to enhancing the resilience of the overall system [2]. Enhancing the overall resilience, however, requires a comprehensive examination of the entire network to identify critical components. Various research studies have discussed identifying critical components in USNs using diverse methodologies [2,3]. These studies, however, focus solely on single-pipe failure analysis. There are almost no methodologies designed to model multiple pipe failure scenarios, which are common in natural disasters. This limitation is due to the time constraints of conventional methods like hydrodynamic modelling (HMM), making it impractical to simulate all possible failure combinations.
Recent research has focused on developing alternate modelling strategies that are more computationally efficient, like graph theory. USNs can be represented as mathematical graphs, and graph measures can be used to solve different modelling problems [4]. Graph theory-based methodology (GTM) can be used to identify critical elements with less computational efforts compared to HMM. However, these methodologies might not provide accurate impacts of these critical components’ failure due to various simplifications. Therefore, for modelling multiple pipe failure combinations in USNs, a hybrid method is proposed in this study.
2. Methodology
The hybrid graph hydrodynamic model (GHM) methodology consists of two parts. The first part is the identification of critical multiple pipe failure components using GTM and the second part is the accurate estimation of flooding impacts of these pipe failure combinations using HMM.
2.1. Graph Theory Method
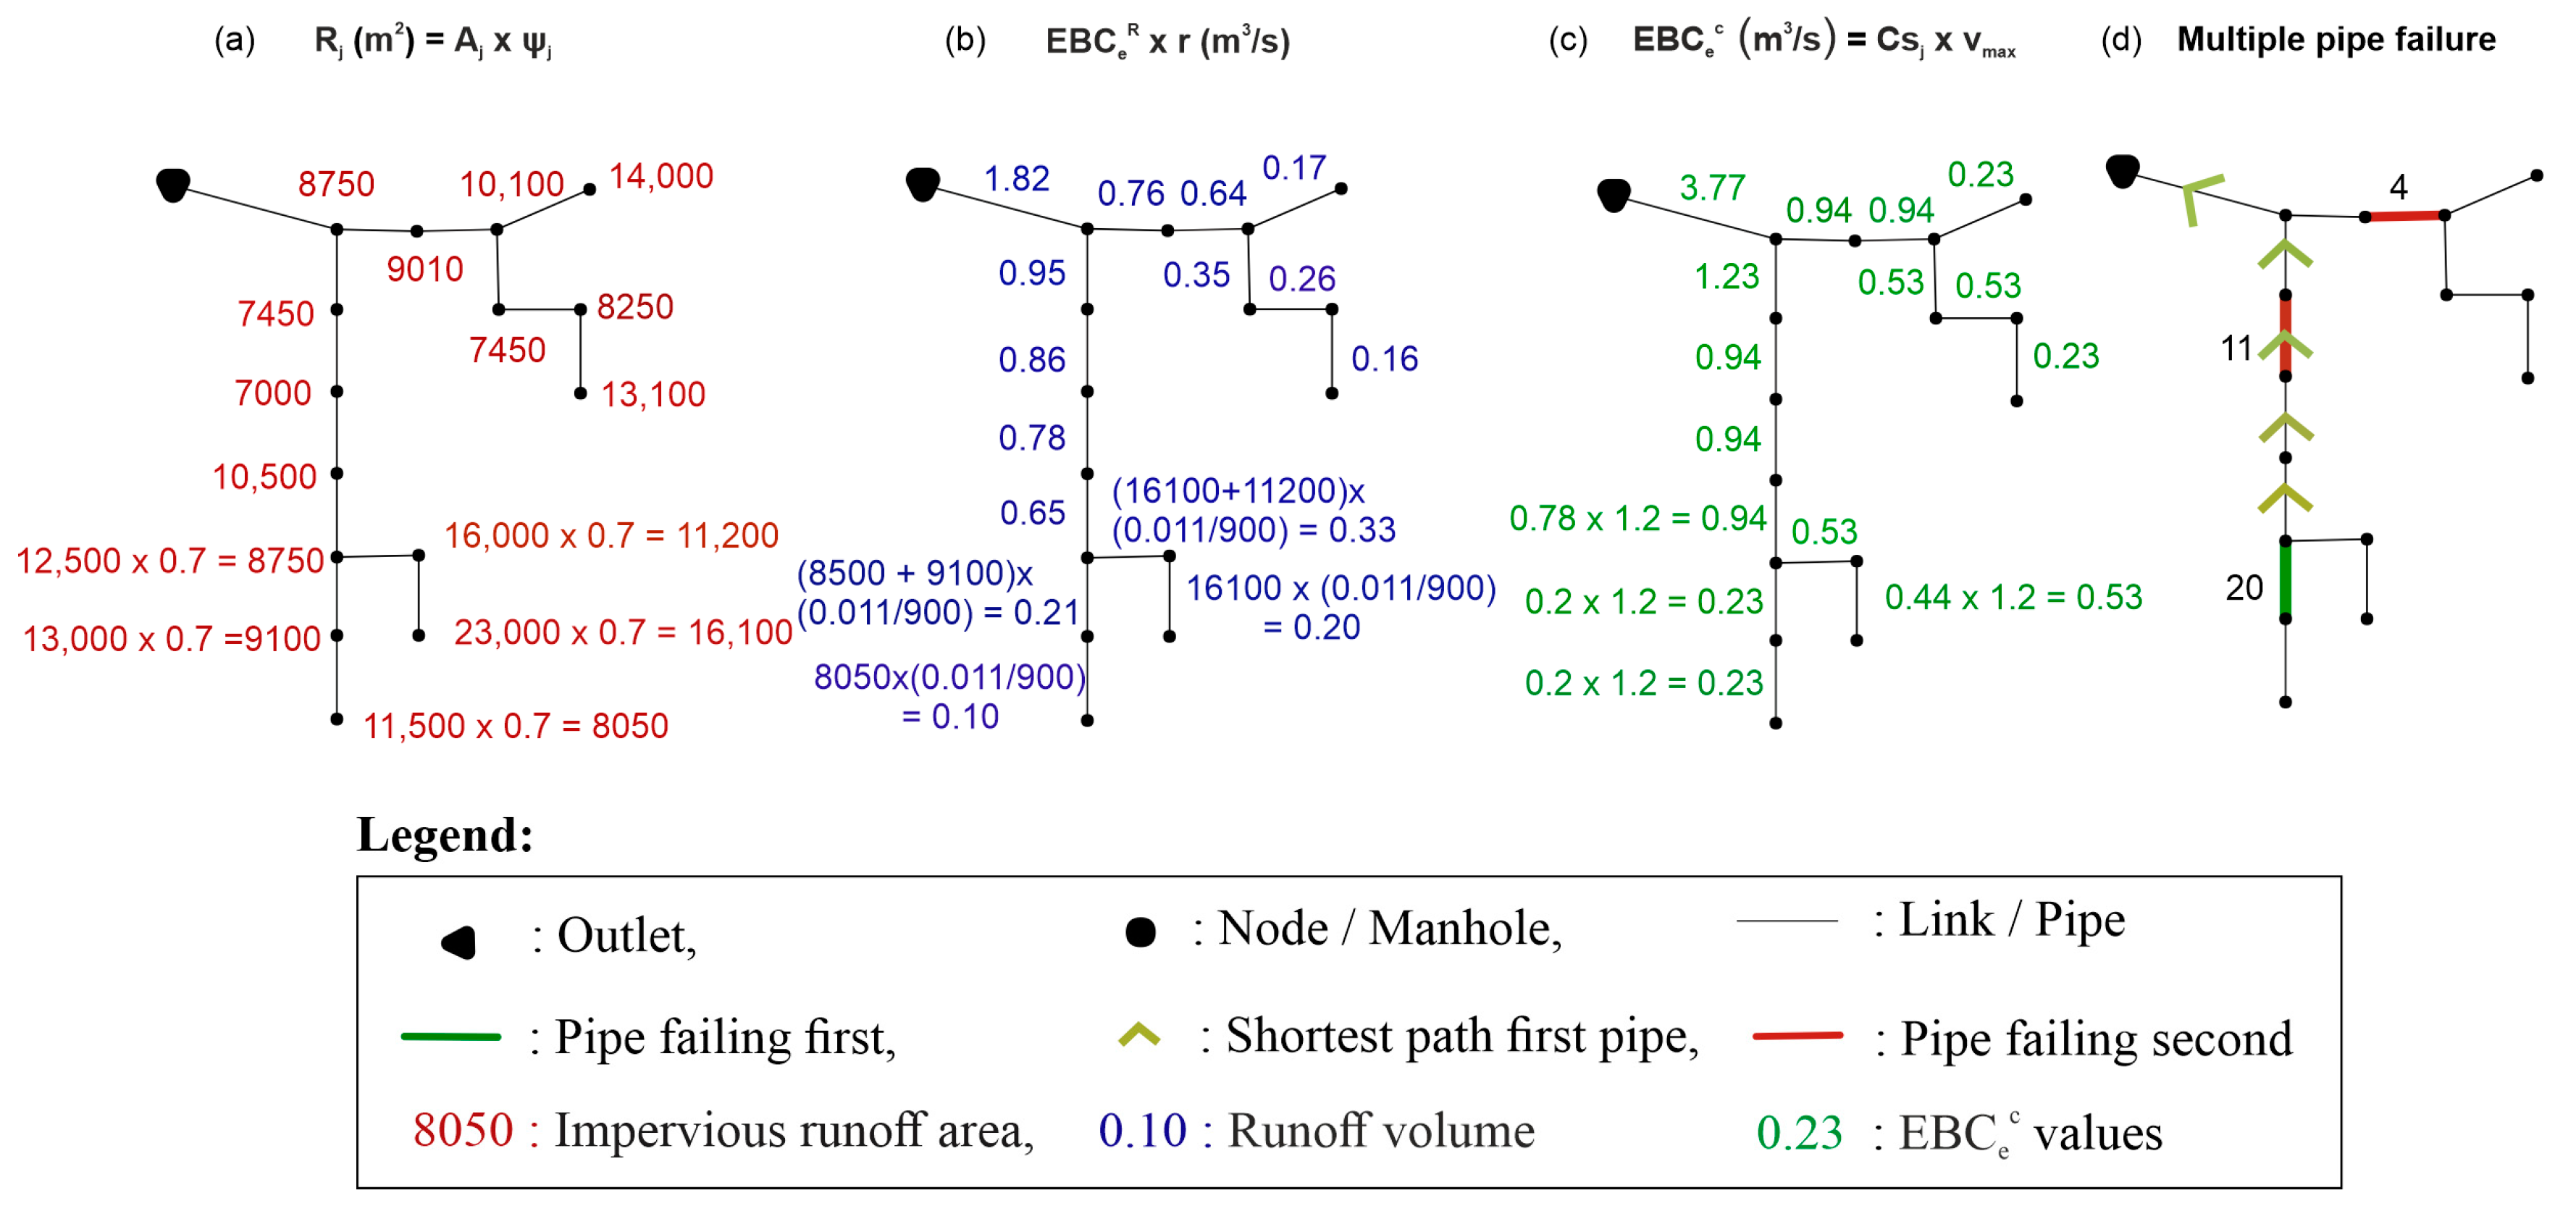
The mathematical representation and analysis of USNs can be accomplished using a graph. This study employs customized graph measures that incorporate hydraulic and functional properties of USNs, such as runoff edge betweenness centrality (EBCeR) and capacity edge betweenness centrality (EBCec). Figure 1a–c explains how these metrics are calculated for a toy example. The runoff area Rj(m2) for node j is calculated by the subcatchment area Aj and the imperviousness ψj. The EBCeR connects each node j with an outlet node via the shortest path and counts how often an edge is part of that shortest path weighted with Rj values. EBCeR values are multiplied by the amount of rain (r = 11 mm/15 min) to obtain the runoff volume. The EBCec values are calculated with the cross-section area CSj of that edge (j) times a maximum flow velocity vmax (assumed to be 1.2 m/s). These metrics provide an estimation of ideal flow distribution and the maximum technically feasible flow, respectively. Further, they can be used to assess flooding volume when particular pipes fail (for more information on the individual graph measures, refer to [5]). The number of different failure combinations can be represented by
where N is the number of pipes in the network and i is the failure level. For single-pipe failures (i = 0), there are N combinations. For three pipe failures (level i = 2), the total number of pipe combinations to be tested is N∙(N − 1)∙(N − 2). Similarly, the methodology can be repeated for any failure level. GTM is used to test all possible failure combinations. The study uses the EBCeR concept to calculate flooding volumes resulting from the failure of a combination of pipes.
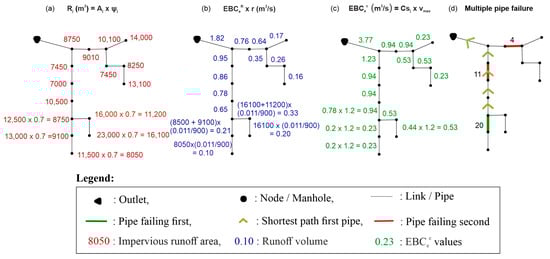
Figure 1.
Illustrative example explaining EBCeR (a,b) and EBCec (c) concepts and GTM for two-pipe failure scenario (d).
As shown in the illustrative example (Figure 1d), it is assumed that pipe 20 fails first, marked in green. First, the shortest path is calculated from pipe 20 to the next outlet. If the pipe that fails second lies in the shortest path of the first pipe (pipe 11), a mere summation of EBC20R and EBC11R does not give an accurate flooding impact. In this case, EBC20R has to be subtracted from the total flooding impact of the combination. On the other hand, if the pipe failing second is not in the shortest path (pipe 4), simple addition, i.e., EBC20R + EBC4R, will give the accurate flooding impact. This methodology is repeated for all possible combinations and the combinations are ranked according to their estimations of flooding volume.
2.2. Hydrodynamic Modelling
HMM is then used to calculate exact flooding volumes of the top-ranked most critical combinations from GTM. The methodology developed by [1] for single-pipe failure is extended to multiple pipe failure and used to calculate exact flooding volumes in this study. Here, instead of modelling one pipe as blocked, all the pipes in a combination are modelled as blocked/collapsed and flooding impacts are then calculated based on hydrodynamic modelling results.
2.3. Case Studies
The first case study is an Alpine network located in Austria that has 428 pipes that drain an area of around 699 hectares. The number of investigated combinations for this network is 428 × 427 = 182,756 (1st level failure). The second USN is a part of the network of the city of Ahvaz in Iran, which has 529 pipes that drain an area of around 500 hectares [2], hence making the total combinations 529 × 528 = 279,312 (1st level failure). For both networks, 1-year return period block rainfall of 15 min duration is used, yielding a total volume of 11.4 mm.
3. Results and Discussion
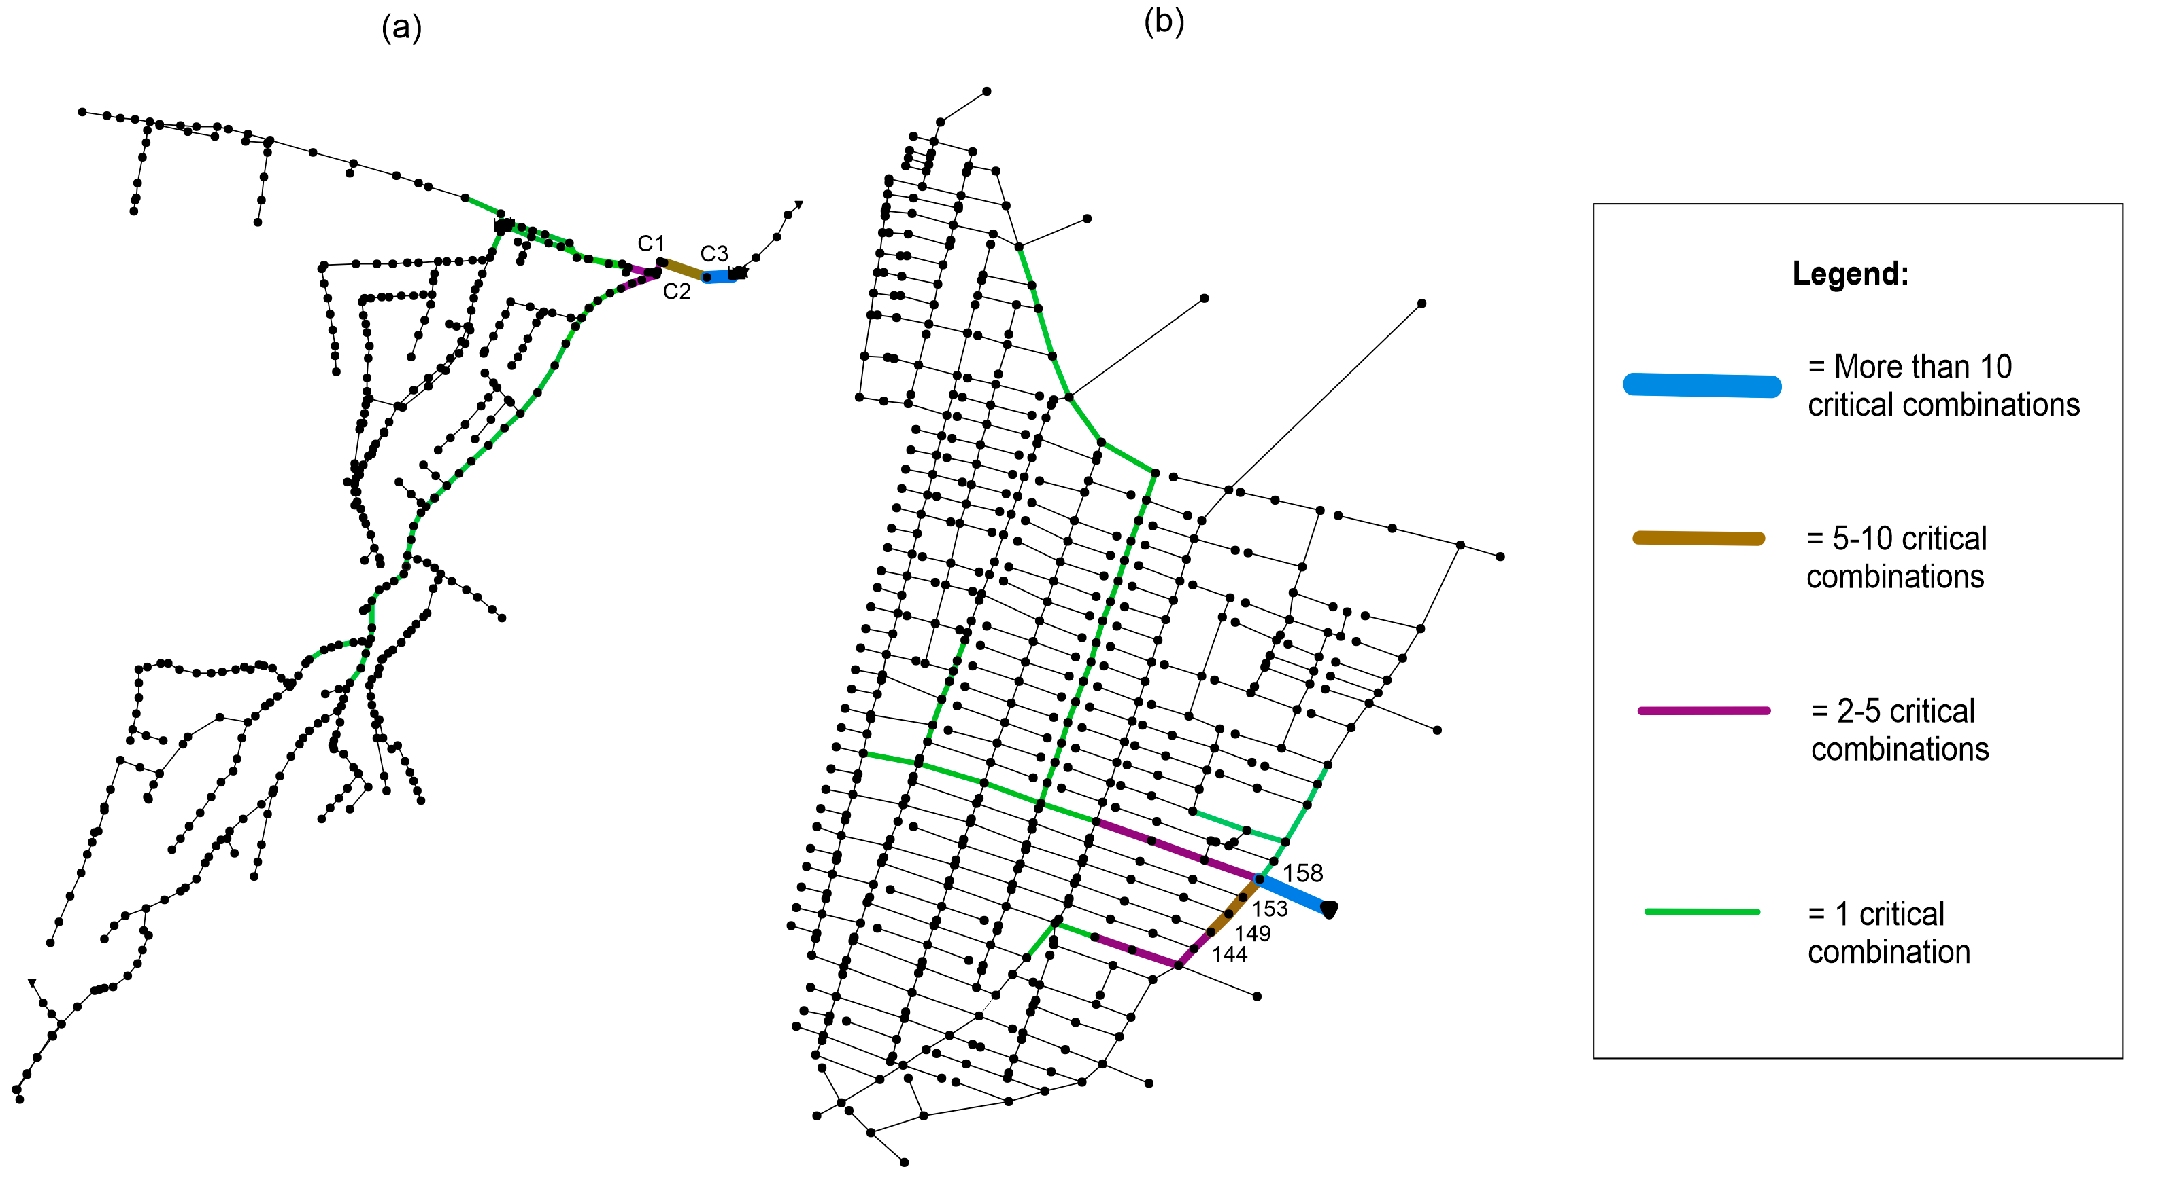
GHM is used in this study to identify pipes that appear most commonly in critical combinations. First, all possible combinations are run using GTM and the first 20% of the combinations are further evaluated. These combinations are analyzed to identify the pipes that appear multiple times in these combinations, being the most critical pipes when considering multiple pipe failure scenarios. The pipes that appear once or more than one time in critical combinations are shown in Figure 2 along with the pipes that are part of the three most critical combinations (see also Table 1). It can be seen that for the Alpine network with high ground slopes, most downstream pipes (close to the outlet) are the pipes that appear multiple times, while for the almost-flat Ahvaz case, this is not the case. Further, the Ahvaz case has a more complex topology, and therefore, the critical pipes cannot be determined as intuitively as for the Alpine case.
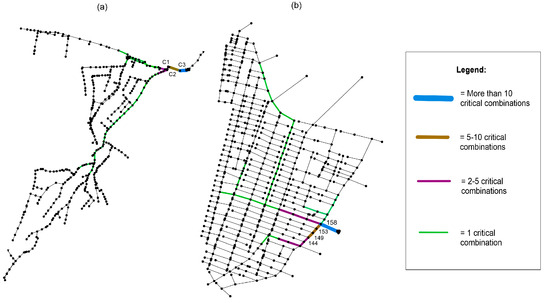
Figure 2.
Pipes appearing most commonly in critical combinations for (a) Alpine and (b) Ahvaz networks.

Table 1.
Critical combinations identified using GTM and flooding impacts calculated using HMM.
The second step of the GHM is to calculate the exact flooding volumes for the block rain events for these critical combinations using HMM. Table 1 shows the flooding impact of the top three critical combinations for both networks for two-pipe failure scenarios.
Computational Time
Table 2 shows the comparison of the computational time of GTM and HMM for both networks when all possible combinations are first run using GHM methodology and then using HMM. All simulations are conducted on a laptop with an Intel® Core™ i7-10610U CPU @ 2.3 GHz processor and 8 GB RAM. It can be noted that the GHM has a computational gain factor of around 102 for the Alpine network and a factor of 133 for the Ahvaz network. This shows a very significant speed-up compared to HMM, making it possible to run more scenarios like multiple failure combinations where the number of combinations increases dramatically.
Table 2.
Computational time comparison of GHM and HMM for Alpine and Ahvaz networks.
4. Summary and Conclusions
In this study, a hybrid graph hydrodynamic model is presented to model multiple pipe failure combinations in USNs. The hybrid graph hydrodynamic model (GHM) combines the computational efficiency of GTM and the accuracy of HMM. GHM can be used to first identify critical multiple pipe failure combinations using GTM and then calculate the exact flooding volumes of these critical combinations using HMM to give an accurate estimation of multiple pipes failing together. The proposed GHM can be useful for utilities to identify critical combinations of multiple pipe failures and their flooding impact, which can subsequently be used to plan proactive counter measures.
Author Contributions
Conceptualization and methodology, A.D. and R.S. (Robert Sitzenfrei); formal analysis, A.D.; data curation, A.D., R.S. (Rahul Satish) and M.O.; writing—original draft preparation, A.D.; writing—review and editing, A.D., R.S. (Rahul Satish), M.H., M.O. and R.S. (Robert Sitzenfrei). All authors have read and agreed to the published version of the manuscript.
Funding
This research was funded in part by the Austrian Science Fund (FWF) P 36737-N.
Institutional Review Board Statement
Not applicable.
Informed Consent Statement
Not applicable.
Data Availability Statement
Networks used in this study are available at https://github.com/iut-ibk/CCWI2024_AunDastgir, last accessed on 15 June 2024.
Conflicts of Interest
The authors declare no conflicts of interest.
References
- Möderl, M.; Kleidorfer, M.; Sitzenfrei, R.; Rauch, W. Identifying weak points of urban drainage systems by means of VulNetUD. Water Sci. Technol. 2009, 60, 2507–2513. [Google Scholar] [CrossRef] [PubMed]
- Meijer, D.; Van Bijnen, M.; Langeveld, J.; Korving, H.; Post, J.; Clemens, F. Identifying Critical Elements in Sewer Networks Using Graph-Theory. Water 2018, 10, 136. [Google Scholar] [CrossRef]
- Mair, M.; Sitzenfrei, R.; Kleidorfer, M.; Möderl, M.; Rauch, W. GIS-based applications of sensitivity analysis for sewer models. Water Sci. Technol. 2012, 65, 1215–1222. [Google Scholar] [CrossRef]
- Turan, M.E.; Bacak-Turan, G.; Cetin, T.; Aslan, E. Feasible Sanitary Sewer Network Generation Using Graph Theory. Adv. Civ. Eng. 2019, 2019, 8527180. [Google Scholar] [CrossRef]
- Dastgir, A.; Hesarkazzazi, S.; Oberascher, M.; Hajibabaei, M.; Sitzenfrei, R. Graph method for critical pipe analysis of branched and looped drainage networks. Water Sci. Technol. 2022, 87, 157–173. [Google Scholar] [CrossRef] [PubMed]
Disclaimer/Publisher’s Note: The statements, opinions and data contained in all publications are solely those of the individual author(s) and contributor(s) and not of MDPI and/or the editor(s). MDPI and/or the editor(s) disclaim responsibility for any injury to people or property resulting from any ideas, methods, instructions or products referred to in the content. |
© 2024 by the authors. Licensee MDPI, Basel, Switzerland. This article is an open access article distributed under the terms and conditions of the Creative Commons Attribution (CC BY) license (https://creativecommons.org/licenses/by/4.0/).