Abstract
Two-thirds of UK higher education institutions operate as energy-intensive buildings and have failed to achieve the 2020 goal of reducing emissions by 43% from 2005 levels, as pledged in 2005. Converting existing buildings into low-emission ones is challenging, and setting achievable targets with sustainable design strategies is crucial. A case study was conducted on the University of Dundee’s dental clinic, analysing the economic viability of a hybrid microgrid with an on-site solar photovoltaic, natural-gas-fuelled combined heat and power generator, and the national grid. Three design configurations were analysed: Grid + CHP, Grid + PV, and Grid + PV + CHP. The results showed that the Grid + PV + CHP system has the lowest levelised cost of electricity (LCOE) and is over 75% more cost-effective and shows a minimum of 7.5% reduction in emissions. This configuration has a simple payback period of 2.9 years, a discounted payback period of 2.6 years, a return on investment of 30.1%, and an internal rate of return of 34.4%.
1. Introduction
Climate change is a global issue nowadays because this change is happening at an unprecedented rate. One of the main reasons for this is the use of nonrenewable energy sources such as fossil fuels [1]. Increasing the share of renewable energy sources to produce electricity and the primary energy demand will be the optimum short-term strategy for mitigating climate change due to global warming [2]. A total of 18 million tonnes of CO2e were emitted by 537 UK institutions in 2020/21, accounting for 2.3% of the UK’s carbon footprint [3,4]. The UK has set a groundbreaking strategy for achieving net-zero emissions and aims to exclude itself from contributing to climate change by 2050 [5]. Achieving net-zero refers to maintaining a balance between the amount of greenhouse gas (GHG) emissions produced and the amount removed from the atmosphere. This balance can be achieved through the combination of emission reduction and removal [6]. Implementing net-zero energy systems is crucial for limiting the rise in global temperature to 1.5 °C. However, transitioning to net-zero poses both technological and social challenges simultaneously. To address climate change, it is vital to decarbonise the building sector, responsible for 40% of total energy usage and 36% of GHG emissions [7].
During this study, the power generation strategies for converting the energy-intensive higher education institutions in the UK to low-emission facilities was explored for three scenarios consisting of a hybrid microgrid with on-site solar photovoltaic (PV), natural-gas-fuelled combined heat and power (CHP) generator, and the national grid and are Grid + CHP, Grid + PV, and Grid + PV + CHP. The modelling and simulation work of this study was performed using the HOMER Pro-Microgrid software package. The three scenarios were evaluated for economic viability (mainly to reduce the levelised cost of electricity (LCOE)), performance and optimization of energy utilization, and mitigation of emissions. A case-study-based modelling work was performed based on the existing dental clinic of the University of Dundee to convert it to a sustainable facility as explained in the next sections of this paper.
2. Methodology
The case study involved modelling work based on the dental school of the University of Dundee, a 10-storey building accommodating a dental clinic and academic offices. HOMER Pro 3.16.2 (Hybrid Optimization of Multiple Energy Resources) software from the National Renewable Energy Laboratory (NREL) in the USA was used for the modelling. This software aids in designing micro-power systems and comparing different power generation technologies [8].
The input data included the average monthly solar irradiation and temperature of Dundee City, as well as the building’s electrical and thermal energy consumption, which was determined from previous meter readings and recordings. The energy demand was further broken down into winter and summer months, with specific hourly and daily patterns considered. The winter months were estimated to consume 70% of the annual electricity and heat demand. Three design configurations—Grid + CHP, Grid + PV, and Grid + PV + CHP—were studied, with components selected to meet the building’s electrical and thermal demands. Overall, this study involved evaluating various energy generation technologies and their applicability to the specific energy demands of the dental school.
Sizing of the photovoltaic (PV) array: There is a formula for the calculation of solar PV array size. The variables for this calculation are average sun hour per day (Tmin), daily electrical energy consumption (E), and the system’s DC voltage (VDC). Losses are brought into consideration to avoid the issue of under-sizing. Losses are calculated by dividing the energy demand per day by the product of the efficiencies of all the system components to obtain the energy required, Er [9].
Tilting of the PV: array type: open rack, tilt angle: 20 degrees, azimuth angle: 180 degrees, orientation: facing south, PV capacity: 300 W
LCOE: The LCOE was obtained by considering the systems’ operational and running costs. This can be calculated using this formula: LCOE = [10].
Io = investment cost, At = yearly cost, Mt.el = electricity produced in kWh per year, i = discount rate, n = lifetime of the system, and t = number of years.
3. Results and Discussion
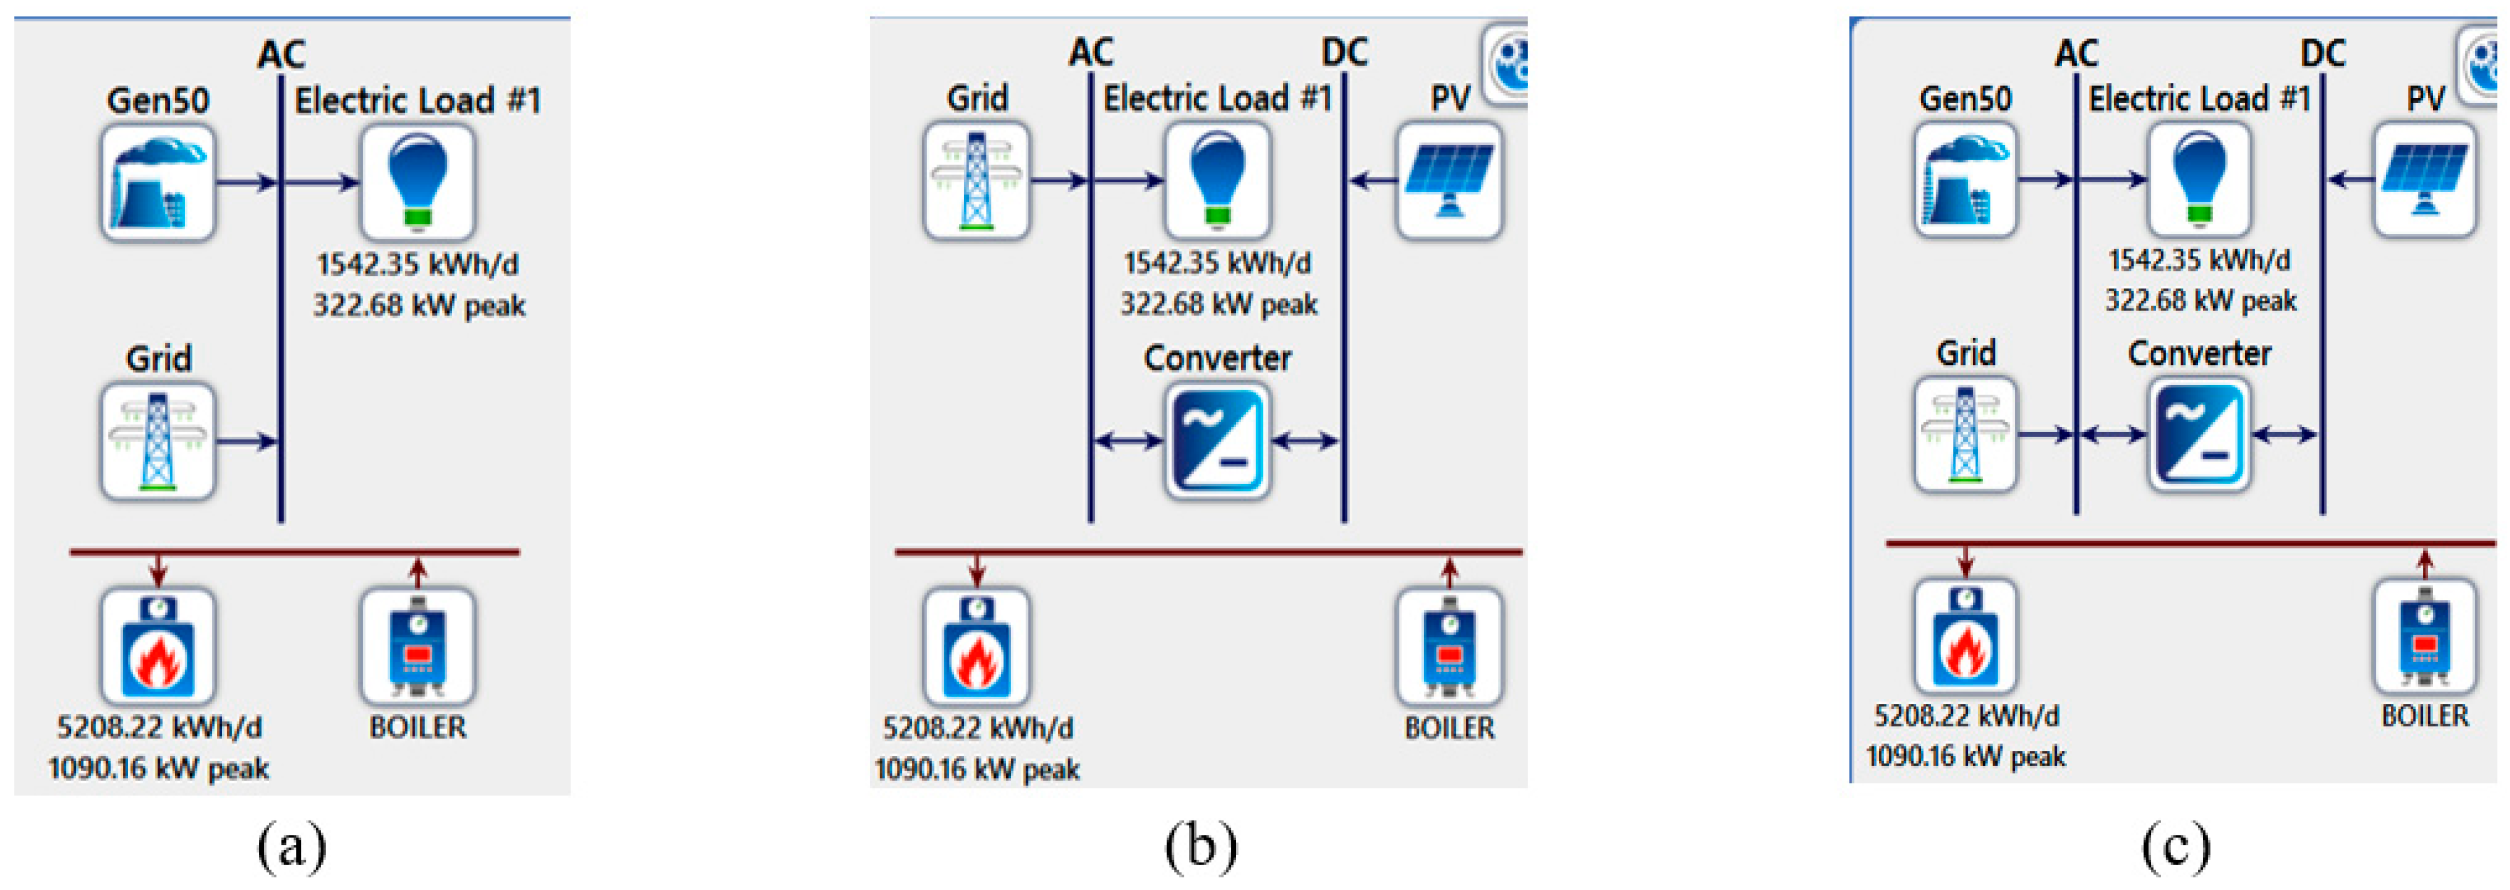
It was found that the average daily, monthly, and yearly electrical demand of the building is 1542 kWh, 46,913 kWh, and 562,958 kWh, respectively, and thermal demand of the building is 5208 kWh, 158,417 kWh, and 1,901,000 kWh, respectively. As mentioned in the methodology, three energy generation configurations shown in Figure 1a–c were studied, and the system performance, LCOE, and the emissions of the three configurations are presented in the following sections.
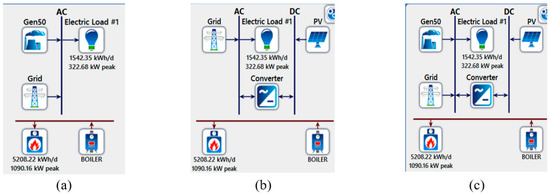
Figure 1.
(a) Grid + CHP, (b) Grid + PV, and (c) Grid + PV + CHP.
Configuration 1:
Grid + CHP: A total of 745,206 kWh/year of electricity can be produced, with 438,000 kWh/year being delivered by the CHP. The deficit of 307,206 kWh/year of electricity will be purchased from the grid. The excess energy of 182,248 kWh/year will be sold to the grid during summer. A total of 100% of the thermal energy requirement of the building would be supplied through the boiler.
Configuration 2:
Grid + PV: Using this system, a total of 619,960 kWh/year of electricity was produced. Due to the inadequate electricity generation from the solar PV system during the winter months, 367,899 kWh/year of electricity, amounting to 59.3% of the required electrical energy, is purchased from the grid. The contribution from the PV system is 252,061 kWh/year of the total electricity requirement, amounting to a 40.7% contribution for the total electricity generation. After the building utilises 562,956 kWh/year of electricity, which is 92.7% of the total production and an excess of 44,399 kWh/year, electricity can be sold to the grid. The annual thermal energy requirement (1,901,000 kWh/year) can be generated by the boiler in this configuration. It was defined that the rated capacity of the PV system is 300 kW with a mean output of 691 kWh/day, a capacity factor of 9.59%, and a total annual production of 252,061 kWh. The minimum output of the PV is 0 kW while the maximum output is 288 kW. The LCOE was estimated at $0.2123/kWh.
Configuration 3:
Grid + PV + CHP: The results show that this system produces a total of 859,463 kWh of electricity per annum. In total, PV contributed 252,061 kWh which is 29.3% of the total energy production. The CHP contributed 438,000 kWh, which amounts to 51% of the energy mix. However, 19.7% of the total energy requirement needs to be purchased from the grid. The AC primary load is 562,958 kWh/year, and 283,902 kWh/year of excess electricity is sold to the grid. The boiler produced the 1,901,000 kWh of the annual thermal energy requirement.
Table 1 and Table 2 summarise the LCOE and emission of the three system configurations analysed in this study. The configuration with Grid + PV + CHP obtained the lowest LCOE. Table 3 presents the comparison of the economics of three system configurations.

Table 1.
Summary of the LCOE of the three system configurations.
Table 2.
Summary of the emissions of the three system configurations.
Table 3.
Comparison of the economics using the different systems.
4. Conclusions
This research evaluates the performance of three design configurations of a hybrid energy generation system to be implemented in an existing building to reduce the levelized cost of electricity (LCOE) and total emissions. The configurations use the national grid, solar photovoltaic (PV), and CHP generator. The analysis was conducted for the dental hospital of University of Dundee, United Kingdom. The annual electrical energy demand is 562,958 kWh and thermal energy demand is 1,190,000 kWh.
The results show that the Grid + PV + CHP system has the lowest LCOE at $0.0503/kWh, with a present worth of $182,599, return of investment (ROI) of 30.1%, a 34.4% internal rate of return (IRR), and a 2.6-year simple payback period. While the Grid + PV configuration generates the lowest emissions, space constraints in urban areas limit its effectiveness. However, using a Grid + PV + CHP system can achieve a 7.5% reduction in GHG emissions over the Grid + CHP system. It is also noted that the Grid + PV + CHP system emissions can be further reduced by operating the CHP with a renewable source with low LCOEs such as biodiesel, hydrogen, or ammonia. This suggests that utilizing renewable energy sources in hybrid energy systems can significantly impact sustainability by reducing global warming, fuel costs, and environmental pollution.
Author Contributions
Conceptualization, E.O., A.W. and W.F.; methodology, E.O., A.W. and W.F.; software, E.O.; validation, E.O.; formal analysis, E.O., A.W. and W.F.; investigation, E.O., A.W. and W.F.; resources, E.O., A.W. and W.F.; data curation, E.O., A.W. and W.F.; writing—original draft preparation, E.O., A.W. and W.F.; writing—review and editing, E.O., A.W. and W.F.; visualization, E.O., A.W. and W.F.; supervision, A.W. and W.F. All authors have read and agreed to the published version of the manuscript.
Funding
This research received no external funding.
Institutional Review Board Statement
Not Applicable.
Informed Consent Statement
Not Applicable.
Data Availability Statement
The data presented in this study are available upon request from the corresponding author.
Conflicts of Interest
The authors declare no conflict of interest.
References
- Bhattacharjee, S.; Das, U.; Chowdhury, M.; Nandi, C. Role of hybrid energy system in reducing effects of climate change. In Dynamics of Energy, Environment and Economy: A Sustainability Perspective; Springer International Publishing: Cham, Switzerland, 2020; pp. 115–138. [Google Scholar]
- Kalkan, N.; Bercin, K.; Cangul, O.; Morales, M.G.; Saleem, M.M.K.M.; Marji, I.; Metaxa, A.; Tsigkogianni, E. A renewable energy solution for Highfid Campus of University of Southampton. Renew. Sustain. Energy Rev. 2011, 15, 2940–2959. [Google Scholar] [CrossRef]
- University of Leeds. Analysis Reveals Scale of Tertiary Education’s Carbon Emissions. Available online: https://climate.leeds.ac.uk/news/analysis-reveals-scale-of-tertiary-educations-carbon-emissions/ (accessed on 1 October 2023).
- HESA (2022) Table 2—Energy. Available online: https://www.hesa.ac.uk/data-and-analysis/estates/table-2 (accessed on 29 June 2023).
- UK’s Path to Net Zero Set Out in Landmark Strategy. Available online: https://www.gov.uk/government/news/uks-path-to-net-zero-set-out-in-landmark-strategy (accessed on 3 May 2023).
- National Grid. What Is Net Zero? Available online: https://www.nationalgrid.com/stories/energy-explained/what-is-net-zero (accessed on 3 May 2023).
- Ahmed, A.; Ge, T.; Peng, J.; Yan, W.C.; Tee, B.T.; You, S. Assessment of the renewable energy generation towards net-zero energy buildings: A review. Energy Build. 2022, 256, 111755. [Google Scholar] [CrossRef]
- Zahboune, H.; Zouggar, S.; Krajacic, G.; Varbanov, P.S.; Elhafyani, M.; Ziani, E. Optimal hybrid renewable energy design in autonomous system using Modified Electric System Cascade Analysis and Homer software. Energy Convers. Manag. 2016, 126, 909–922. [Google Scholar] [CrossRef]
- Al-Shamani, A.N.; Othman, M.Y.H.; Mat, S.; Ruslan, M.H.; Abed, A.M.; Sopian, K. Design & Sizing of Stand-Alone Solar Power Systems a House Iraq. Available online: https://www.uomus.edu.iq/lecture/222.pdf (accessed on 3 May 2023).
- Levelized Cost of Energy. Available online: https://corporatefinanceinstitute.com/resources/valuation/levelized-cost-of-energy-lcoe/ (accessed on 14 June 2024).
Disclaimer/Publisher’s Note: The statements, opinions and data contained in all publications are solely those of the individual author(s) and contributor(s) and not of MDPI and/or the editor(s). MDPI and/or the editor(s) disclaim responsibility for any injury to people or property resulting from any ideas, methods, instructions or products referred to in the content. |
© 2024 by the authors. Licensee MDPI, Basel, Switzerland. This article is an open access article distributed under the terms and conditions of the Creative Commons Attribution (CC BY) license (https://creativecommons.org/licenses/by/4.0/).